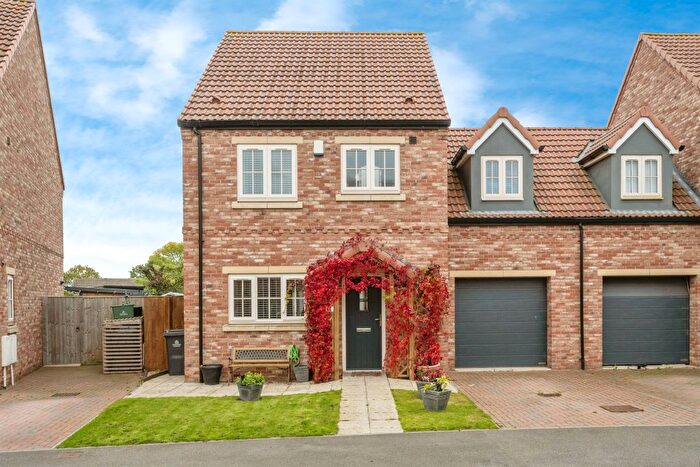
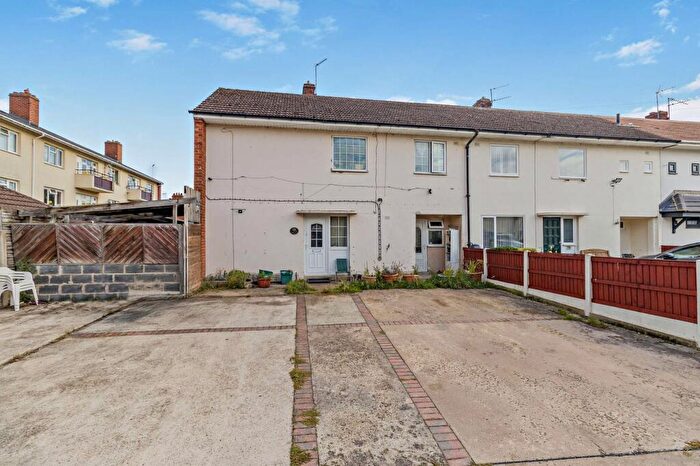
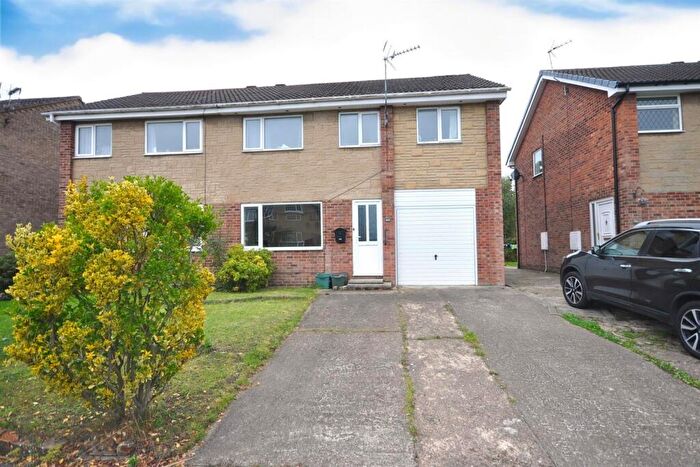
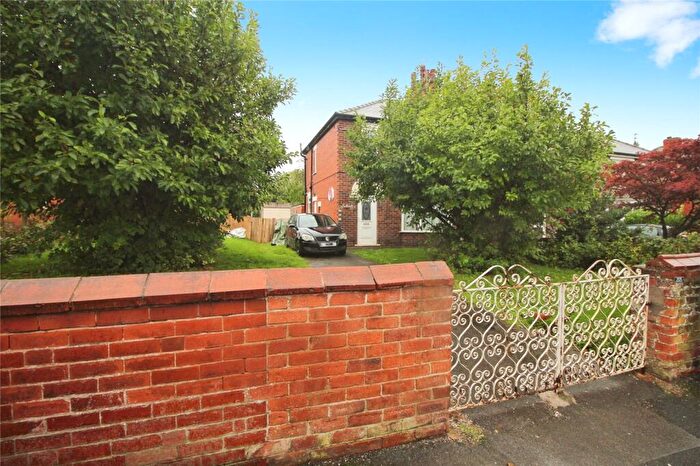
Houses for sale & to rent in Thorne & Moorends, Doncaster
House Prices in Thorne & Moorends
Properties in Thorne & Moorends have an average house price of £158,555.00 and had 99 Property Transactions within the last 3 years¹.
Thorne & Moorends is an area in Doncaster, Doncaster with 620 households², where the most expensive property was sold for £350,000.00.
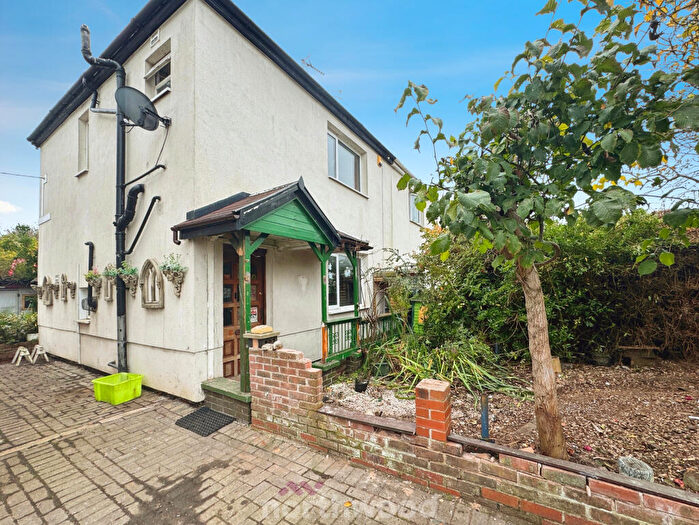
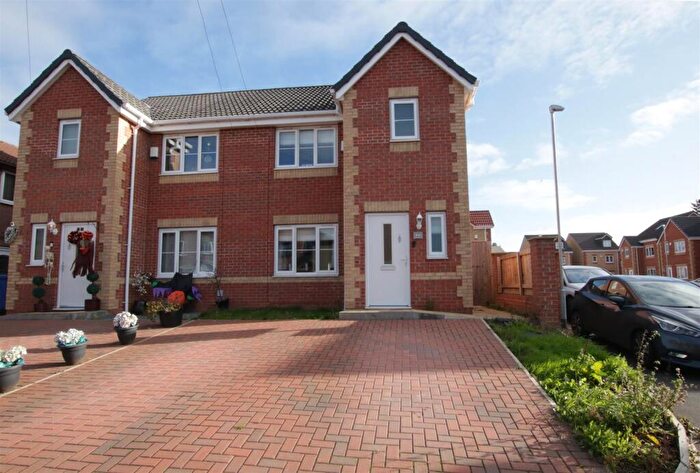
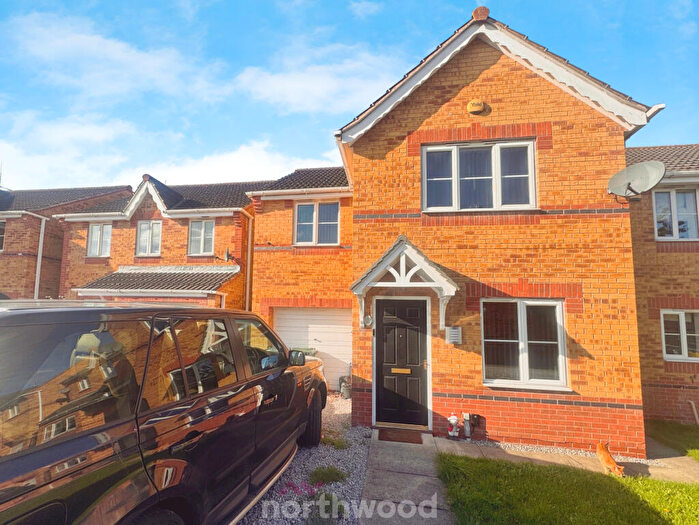
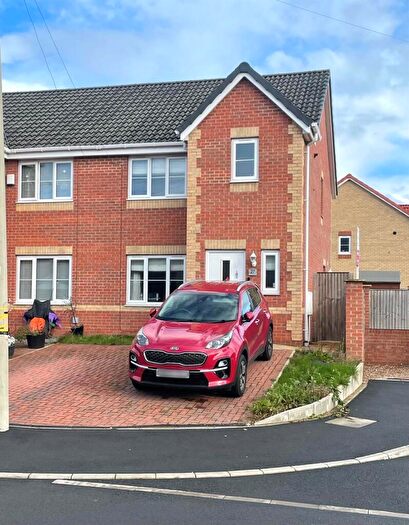
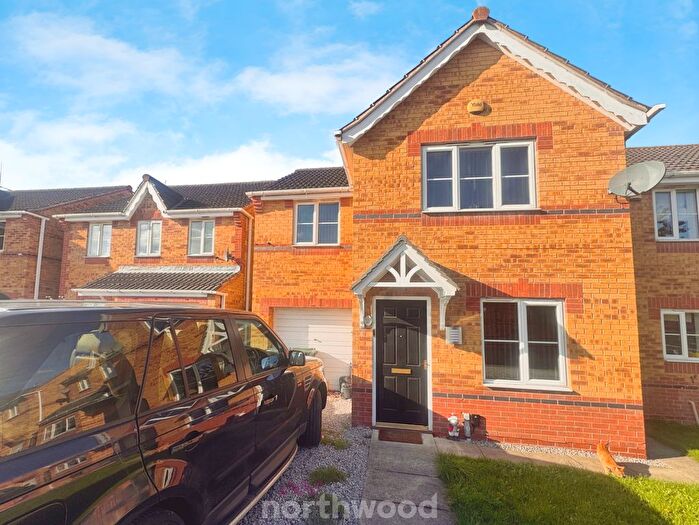
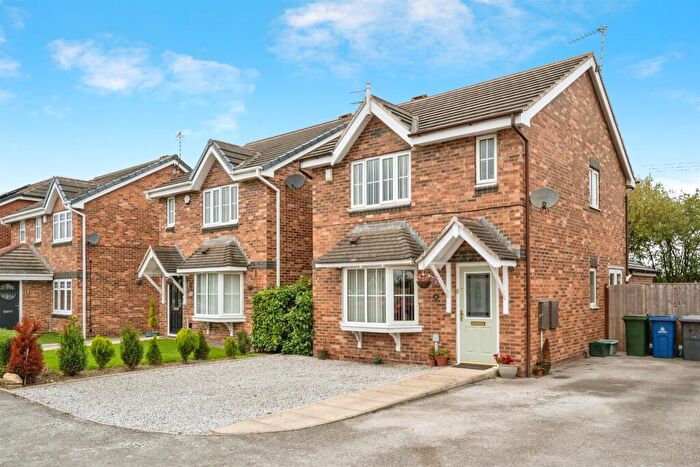
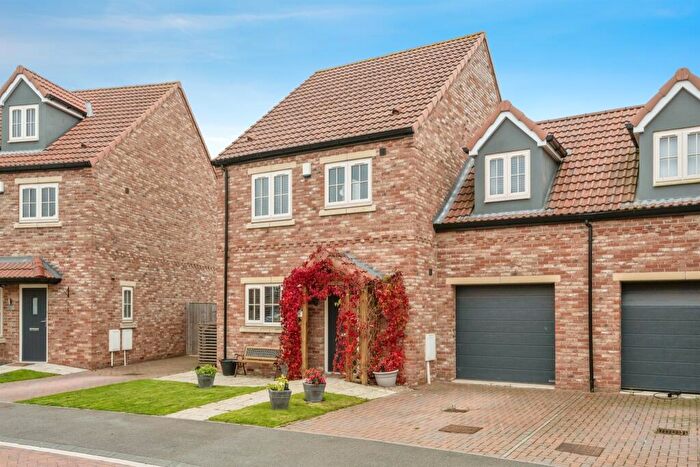
Properties for sale in Thorne & Moorends
Roads and Postcodes in Thorne & Moorends
Navigate through our locations to find the location of your next house in Thorne & Moorends, Doncaster for sale or to rent.
| Streets | Postcodes |
|---|---|
| Almond Court | DN8 4FJ |
| Alpha Court | DN8 5TZ |
| Anchor Close | DN8 5UR |
| Bankside | DN8 4JP |
| Bell View Mews | DN8 5DB |
| Bloom Hill Grove | DN8 4BN |
| Bridge Street | DN8 5QH |
| Browns Lane | DN8 5AF |
| Cambridge Drive | DN8 4FD |
| Cassons Road | DN8 4JA |
| Cedar Road | DN8 4ES |
| Chapel Lane | DN8 5AZ |
| Church Street | DN8 5BB |
| Church View Gardens | DN8 4DX |
| Clay Bank Road | DN8 5SG |
| Coulman Road | DN8 5EU DN8 5EY |
| Coulman Road Industrial Estate | DN8 5JU |
| Coulman Street | DN8 5JT |
| Danum Close | DN8 5JF |
| Darley Road | DN8 4FF |
| Darlington Grove | DN8 4TW |
| Darlington Walk | DN8 4TH DN8 4TQ |
| Delves Court | DN8 5UG |
| Dikes Marsh Lane | DN8 4DT |
| Double Bridges Road | DN8 5SA |
| Eastgate | DN8 4TE DN8 4TG |
| Eastgate Walk | DN8 4TF |
| Fieldside | DN8 4AB DN8 4AE DN8 4BE DN8 4HZ |
| Finkle Court | DN8 5TW |
| Finkle Street | DN8 5GA |
| Foundry Lane | DN8 5AJ |
| Garratt Way | DN8 5EW |
| Glebe Road | DN8 5HL |
| Hawthorne Avenue | DN8 4HD |
| Hawthorne Grove | DN8 4HA |
| Hawthorne Road | DN8 4EZ |
| Haynes Road | DN8 5HX DN8 5JY |
| Holly Road | DN8 4EN |
| Island Drive | DN8 5UE |
| King Edward Road | DN8 4BU DN8 4EA |
| Lock Lane | DN8 5ER |
| Lockwood Close | DN8 5XB |
| Lyndhurst Close | DN8 4JF |
| Maple Road | DN8 4FA |
| Market Place | DN8 5DG DN8 5DH DN8 5DP DN8 5DW |
| Moor Lane | DN8 4SD |
| Moorings Drive | DN8 5FA DN8 5FB |
| Moorside Court | DN8 4BP |
| Mount Pleasant Residential Park | DN8 4ST |
| Mount Pleasant Road | DN8 4SR DN8 4HF |
| North Common Road | DN8 4JS |
| North Eastern Road | DN8 4AU |
| Northfield Drive | DN8 4FG |
| Northgate | DN8 4NW |
| Oak Road | DN8 4HL |
| Oldfield Road | DN8 5PT |
| Omega Boulevard | DN8 5TX |
| Orchard Street | DN8 5AS DN8 5EQ |
| Oxford Street | DN8 4FB DN8 4FE |
| Paddock Lane | DN8 4HT |
| Palm Grove Court | DN8 4EB DN8 4ED |
| Peatland Mews | DN8 4FL |
| Quayside | DN8 4JH |
| Queen Elizabeth Court | DN8 5AL |
| Queen Street | DN8 5FD |
| Queens Court | DN8 5EG |
| Silver Street | DN8 5DT |
| Snake Lane | DN8 5RL |
| South Parade | DN8 5DX |
| Spinney Walk | DN8 5XE |
| St Nicholas Mews | DN8 5DD |
| St Nicholas Road | DN8 5BG |
| Stanley Villas | DN8 4BT |
| The Green | DN8 5AR DN8 5AT |
| Tudworth Road | DN8 5RB |
| Unity Way | DN8 5FJ |
| Waverley Court | DN8 4DS |
| Wharf Crescent | DN8 5FE |
| Wheatfields | DN8 5AN |
| White Lane | DN8 5UJ |
| Willow Avenue | DN8 4ER |
| Willow Crescent | DN8 4EU |
| Willow Grove | DN8 4EP |
| DN8 5WU |
Transport near Thorne & Moorends
- FAQ
- Price Paid By Year
- Property Type Price
Frequently asked questions about Thorne & Moorends
What is the average price for a property for sale in Thorne & Moorends?
The average price for a property for sale in Thorne & Moorends is £158,555. This amount is 10% lower than the average price in Doncaster. There are 1,244 property listings for sale in Thorne & Moorends.
What streets have the most expensive properties for sale in Thorne & Moorends?
The streets with the most expensive properties for sale in Thorne & Moorends are Northfield Drive at an average of £298,500, Wharf Crescent at an average of £189,333 and Moorings Drive at an average of £184,005.
What streets have the most affordable properties for sale in Thorne & Moorends?
The streets with the most affordable properties for sale in Thorne & Moorends are Church Street at an average of £88,083, Stanley Villas at an average of £88,333 and Cedar Road at an average of £89,000.
Which train stations are available in or near Thorne & Moorends?
Some of the train stations available in or near Thorne & Moorends are Thorne North, Thorne South and Hatfield and Stainforth.
Property Price Paid in Thorne & Moorends by Year
The average sold property price by year was:
| Year | Average Sold Price | Price Change |
Sold Properties
|
|---|---|---|---|
| 2025 | £177,136 | 5% |
11 Properties |
| 2024 | £168,243 | 25% |
31 Properties |
| 2023 | £126,996 | -33% |
26 Properties |
| 2022 | £168,741 | 6% |
31 Properties |
| 2021 | £157,850 | -2% |
20 Properties |
| 2020 | £160,297 | 1% |
49 Properties |
| 2019 | £158,136 | 17% |
82 Properties |
| 2018 | £130,995 | -9% |
67 Properties |
| 2017 | £142,421 | 2% |
19 Properties |
| 2016 | £140,141 | 33% |
7 Properties |
| 2015 | £93,500 | -55% |
2 Properties |
| 2013 | £145,000 | -3% |
1 Property |
| 2011 | £150,000 | 33% |
1 Property |
| 2008 | £100,650 | 35% |
1 Property |
| 2002 | £65,000 | -54% |
1 Property |
| 2000 | £100,000 | 74% |
1 Property |
| 1996 | £26,000 | - |
1 Property |
Property Price per Property Type in Thorne & Moorends
Here you can find historic sold price data in order to help with your property search.
The average Property Paid Price for specific property types in the last three years are:
| Property Type | Average Sold Price | Sold Properties |
|---|---|---|
| Semi Detached House | £167,075.00 | 40 Semi Detached Houses |
| Detached House | £256,176.00 | 13 Detached Houses |
| Terraced House | £149,875.00 | 16 Terraced Houses |
| Flat | £109,521.00 | 30 Flats |

