
Houses for sale & to rent in Town, Doncaster
House Prices in Town
Properties in Town have an average house price of £153k and had 164 Property Transactions within the last 3 years¹.
Town is an area in Doncaster, Doncaster with 1,080 households², where the most expensive property was sold for £450k.
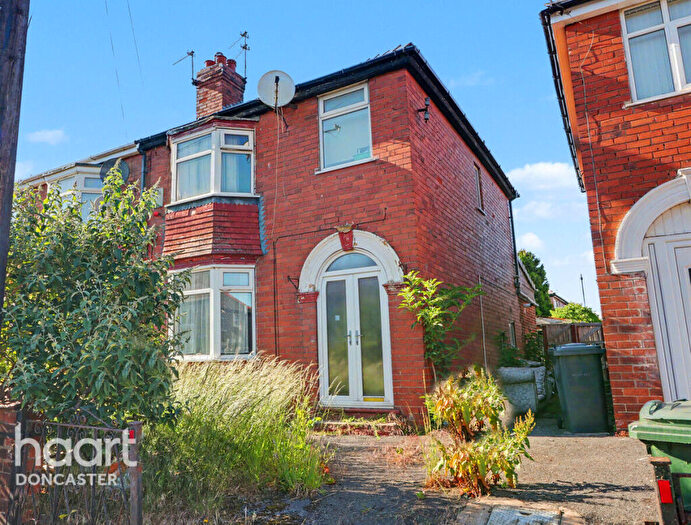
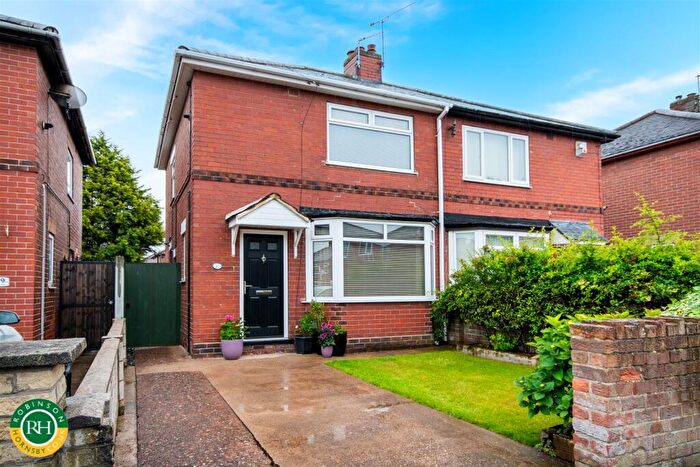
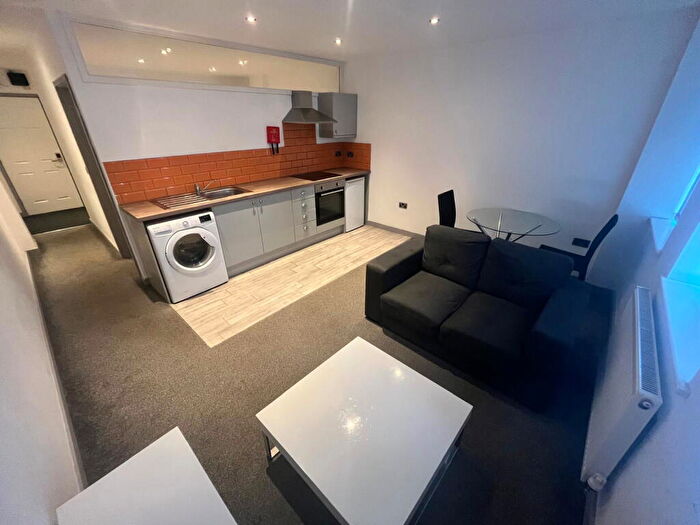
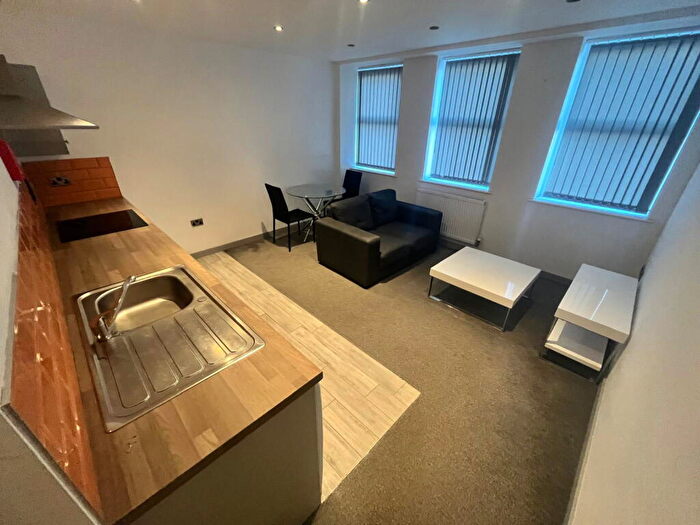
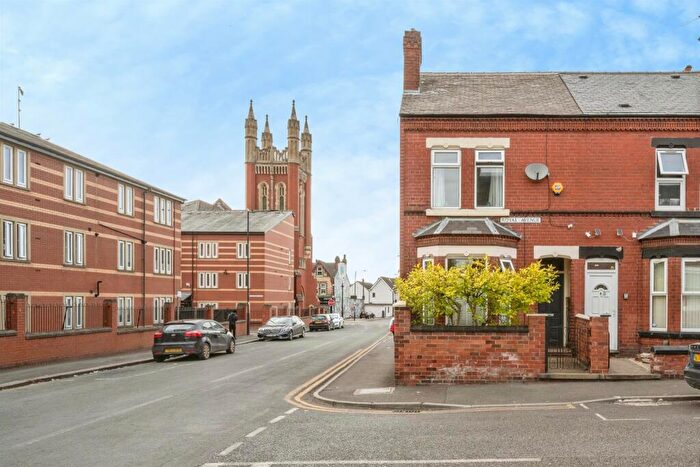
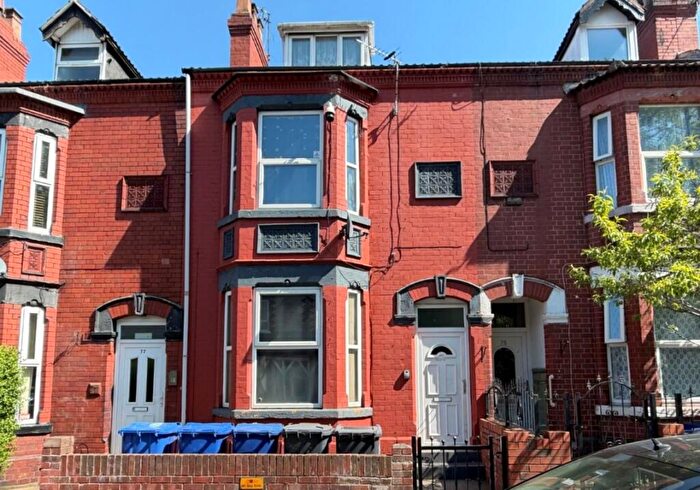
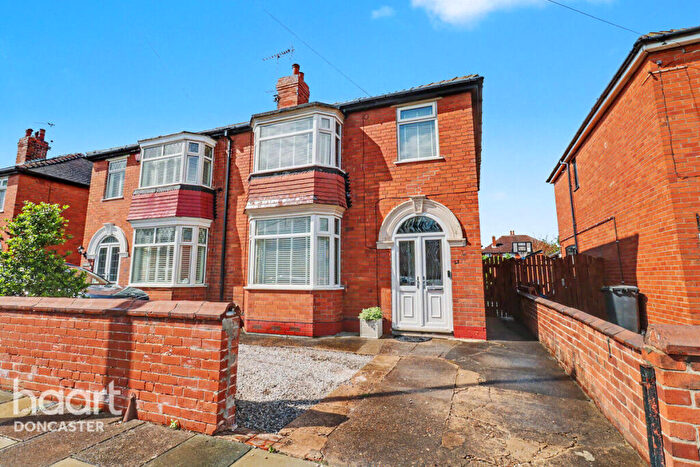
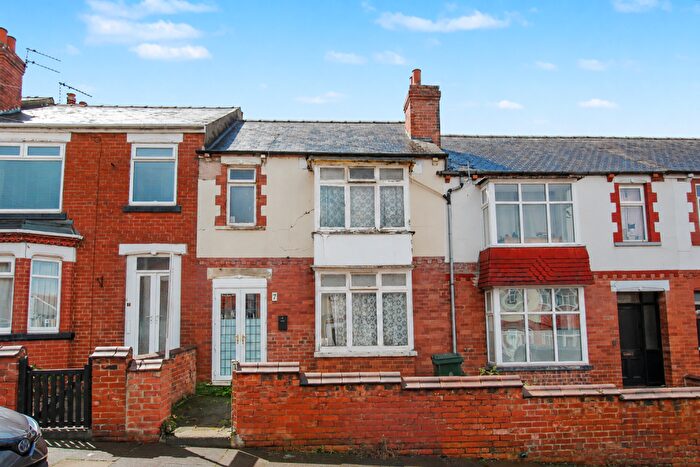
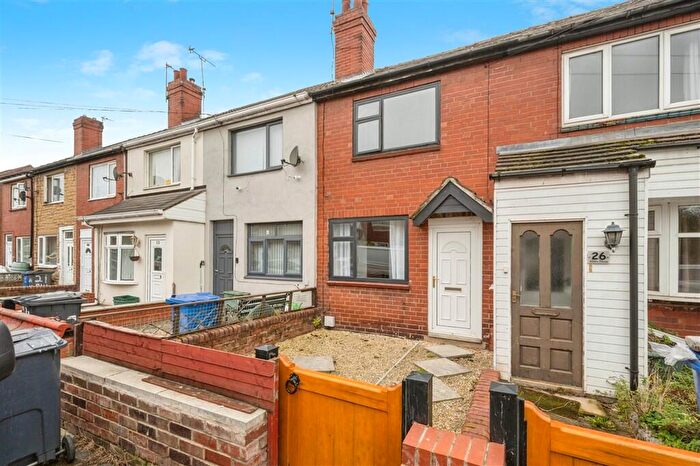
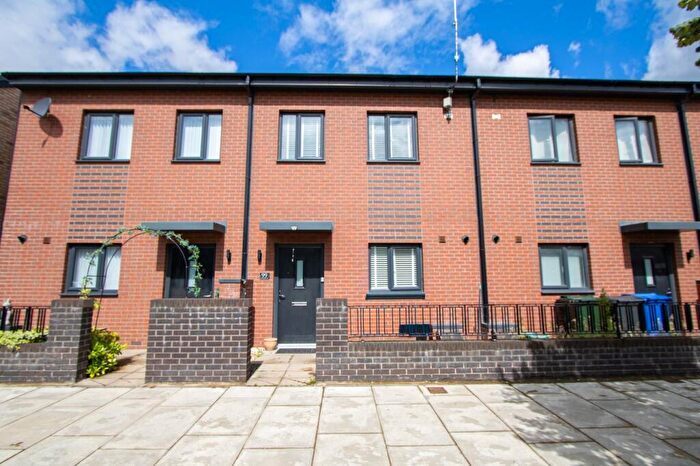
Properties for sale in Town
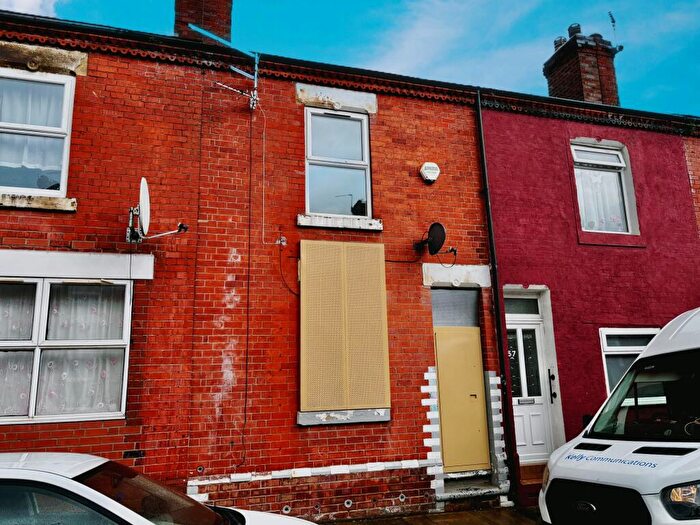
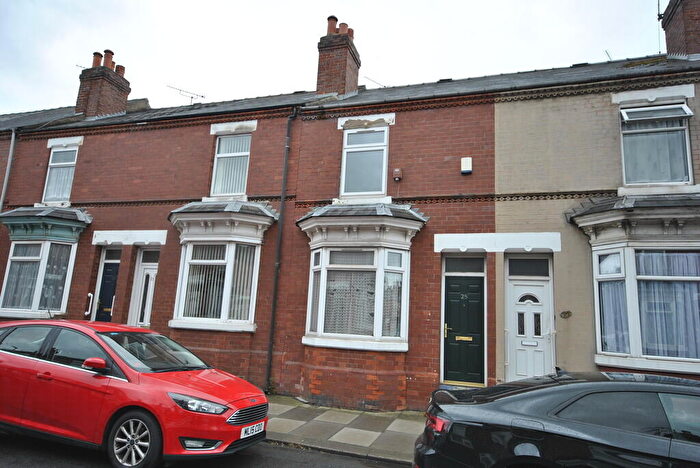
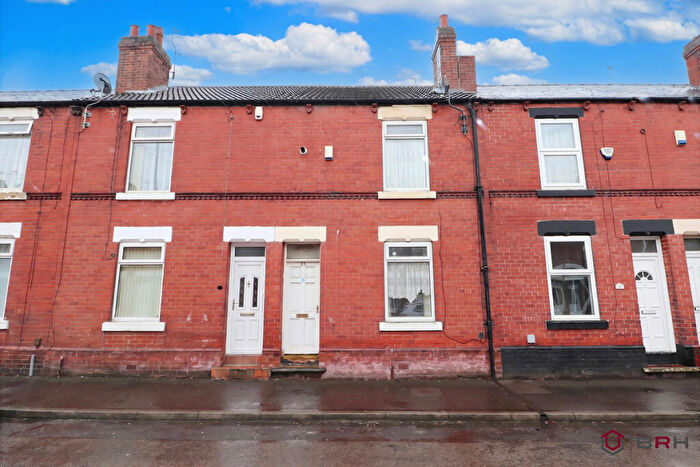
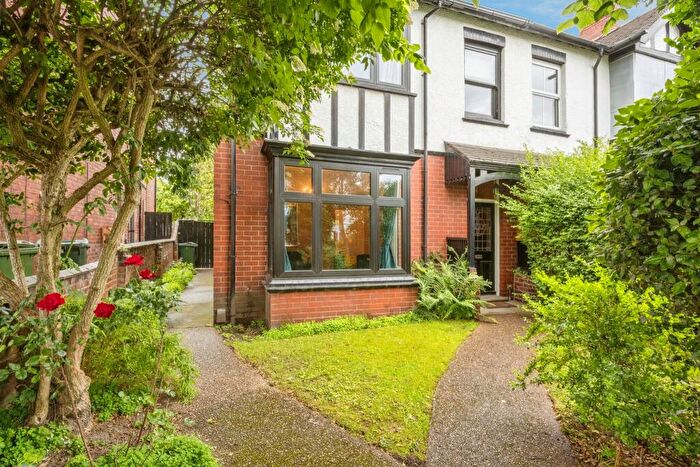
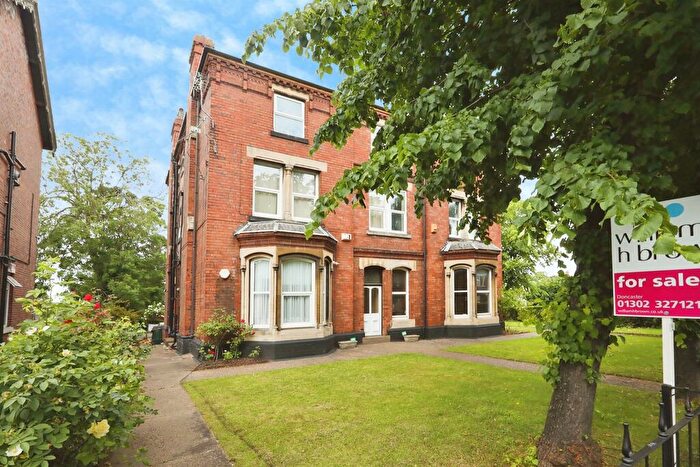
![]()
If you are looking to sell your house, let it out, or receive a property valuation, an expert can help you.
Click the button below to get started.
Roads and Postcodes in Town
Navigate through our locations to find the location of your next house in Town, Doncaster for sale or to rent.
Transport near Town
-
 Doncaster Station
 -
Bentley (S. Yorks) Station
-
Kirk Sandall Station
-
Adwick Station
-
Conisbrough Station
- FAQ
- Price Paid By Year
- Property Type Price
Frequently asked questions about Town
What is the average price for a property for sale in Town?
The average price for a property for sale in Town is £152,897. This amount is 15% lower than the average price in Doncaster. There are 3,452 property listings for sale in Town.
What streets have the most expensive properties for sale in Town?
The streets with the most expensive properties for sale in Town are Rovers Way at an average of £340,000, Lake View at an average of £272,000 and Town End Drive at an average of £224,285.
What streets have the most affordable properties for sale in Town?
The streets with the most affordable properties for sale in Town are Princes Street at an average of £61,000, ST SEPULCHRE GATE at an average of £91,500 and Cleveland Street at an average of £92,100.
Which train stations are available in or near Town?
Some of the train stations available in or near Town are Doncaster, Bentley (S. Yorks) and Kirk Sandall.
Property Price Paid in Town by Year
The average sold property price by year was:
| Year | Average Sold Price | Price Change |
Sold Properties
|
|---|---|---|---|
| 2026 | £156,000 | -7% |
1 Property |
| 2025 | £166,648 | 15% |
33 Properties |
| 2024 | £141,832 | -9% |
53 Properties |
| 2023 | £154,581 | 3% |
77 Properties |
| 2022 | £150,158 | -30% |
49 Properties |
| 2021 | £194,861 | 3% |
97 Properties |
| 2020 | £188,384 | 29% |
64 Properties |
| 2019 | £133,137 | -10% |
107 Properties |
| 2018 | £146,631 | -19% |
123 Properties |
| 2017 | £174,686 | 28% |
71 Properties |
| 2016 | £126,200 | 16% |
33 Properties |
| 2015 | £105,581 | -7% |
17 Properties |
| 2014 | £112,755 | -43% |
9 Properties |
| 2013 | £161,333 | -149% |
3 Properties |
| 2010 | £402,500 | 44% |
3 Properties |
| 2009 | £225,000 | -9% |
1 Property |
| 2008 | £244,685 | 1% |
6 Properties |
| 2007 | £242,500 | 0,3% |
2 Properties |
| 2006 | £241,666 | -5% |
3 Properties |
| 2005 | £253,000 | 42% |
2 Properties |
| 2004 | £147,650 | 24% |
3 Properties |
| 2003 | £112,600 | 62% |
5 Properties |
| 2002 | £43,333 | -250% |
3 Properties |
| 2001 | £151,840 | 71% |
5 Properties |
| 2000 | £44,000 | -97% |
4 Properties |
| 1999 | £86,500 | -81% |
2 Properties |
| 1998 | £156,666 | 30% |
3 Properties |
| 1996 | £110,000 | 91% |
2 Properties |
| 1995 | £10,000 | - |
1 Property |
Property Price per Property Type in Town
Here you can find historic sold price data in order to help with your property search.
The average Property Paid Price for specific property types in the last three years are:
| Property Type | Average Sold Price | Sold Properties |
|---|---|---|
| Flat | £132,791.00 | 112 Flats |
| Semi Detached House | £198,796.00 | 29 Semi Detached Houses |
| Detached House | £279,175.00 | 6 Detached Houses |
| Terraced House | £162,500.00 | 17 Terraced Houses |