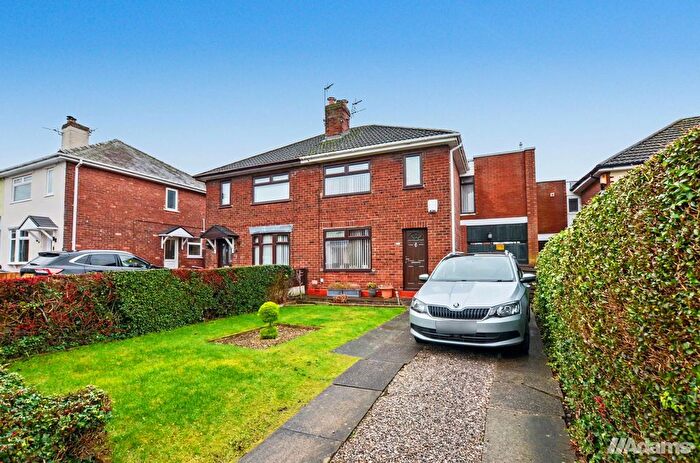
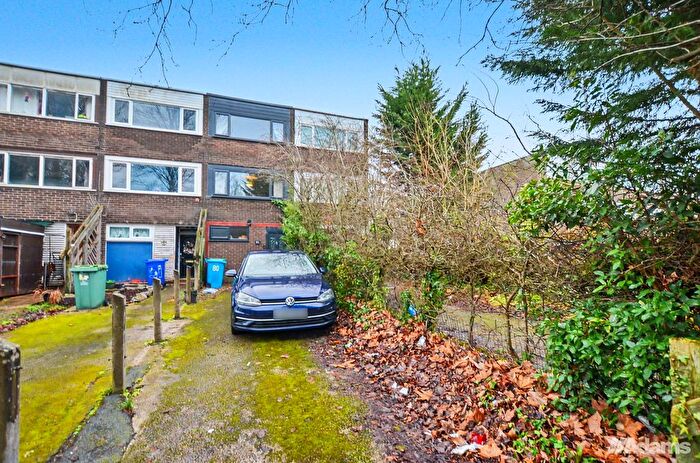
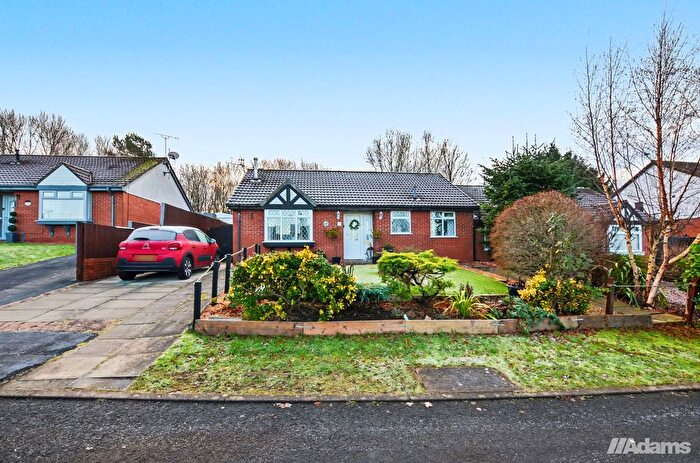
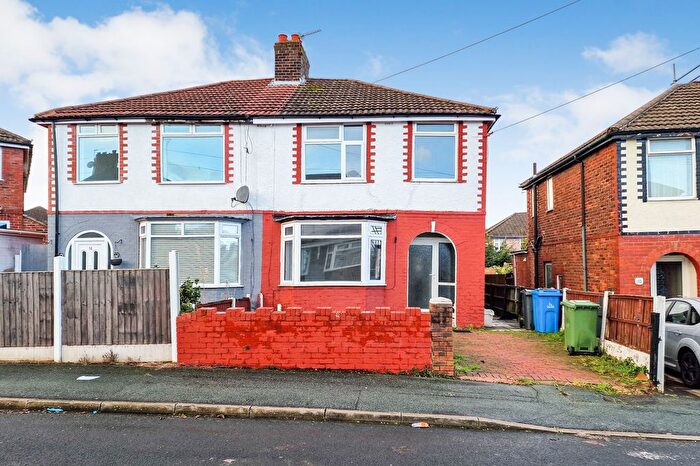
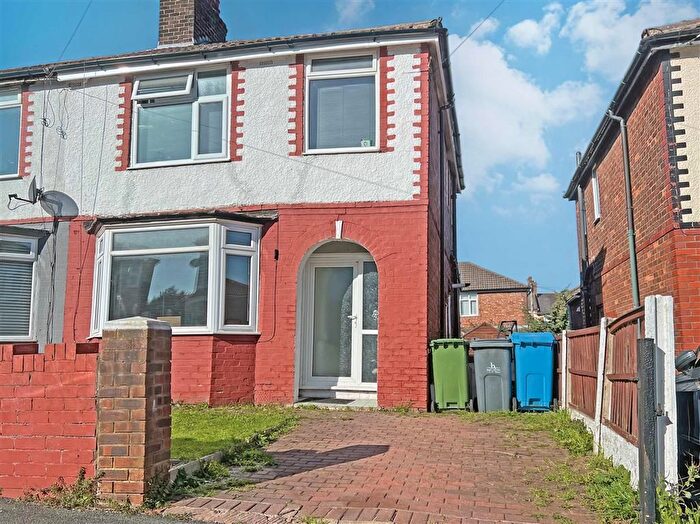
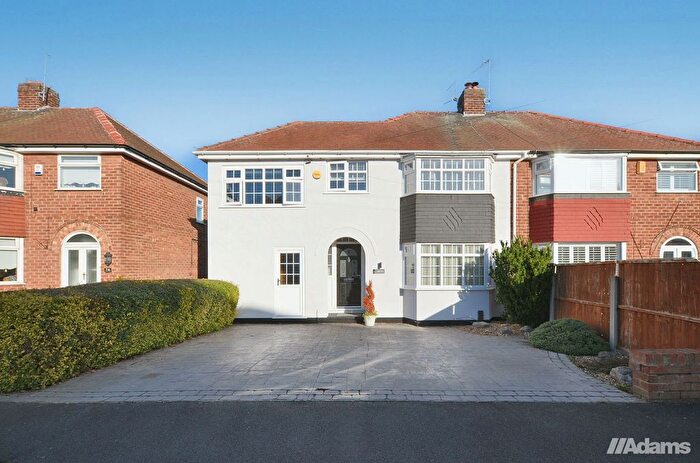
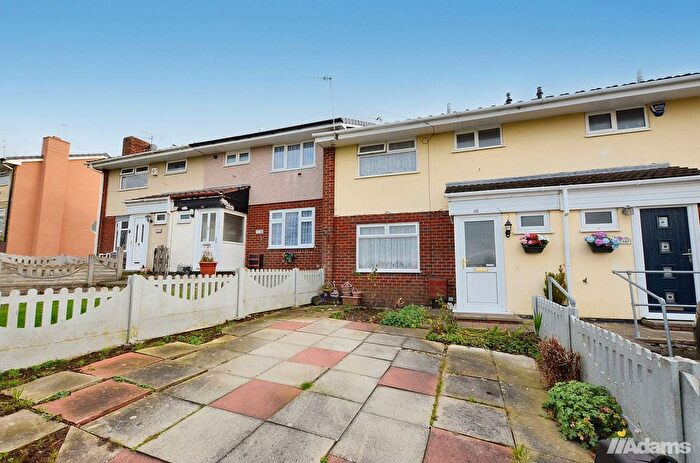
Houses for sale & to rent in Grange, Runcorn
House Prices in Grange
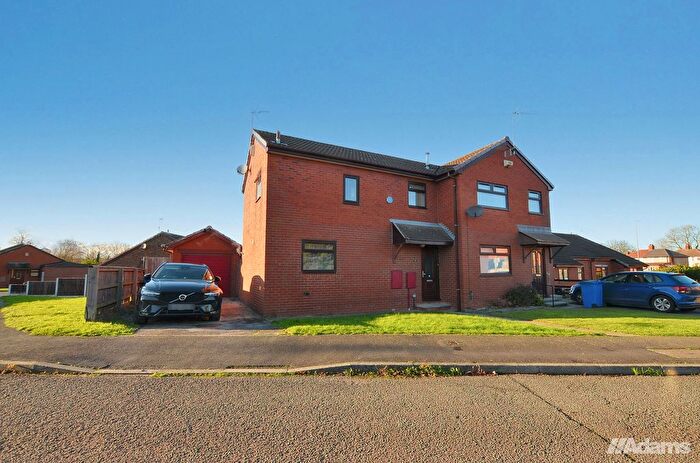
Properties in Grange have an average house price of £156,616.00 and had 182 Property Transactions within the last 3 years¹.
Grange is an area in Runcorn, Halton with 2,939 households², where the most expensive property was sold for £400,000.00.
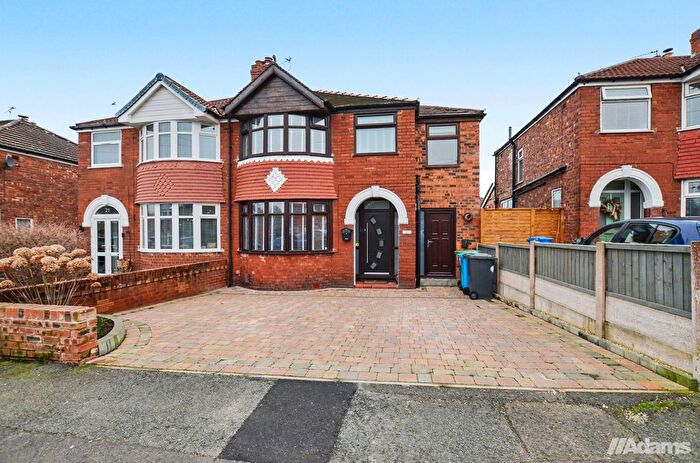
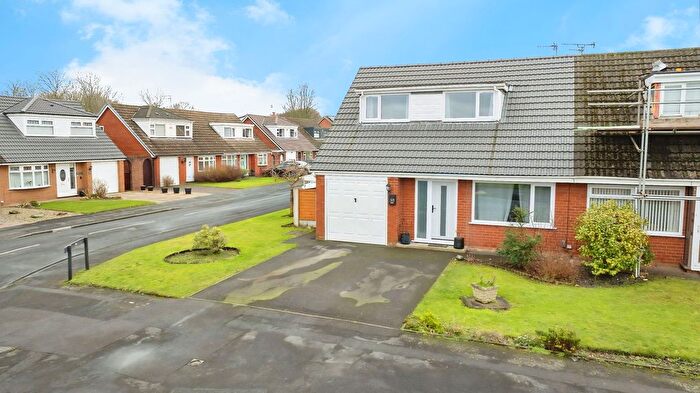
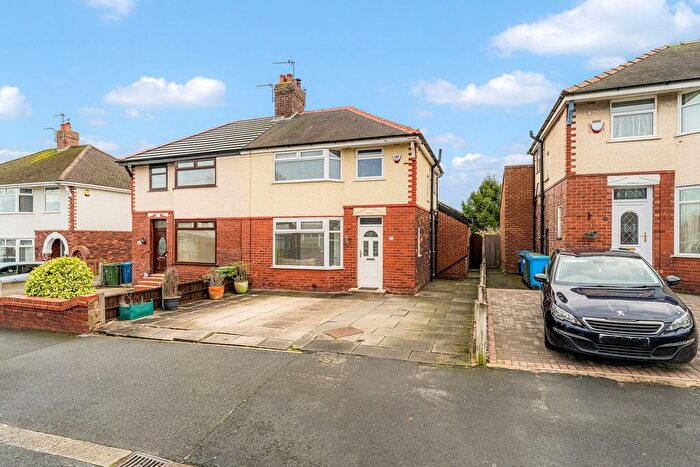
Properties for sale in Grange
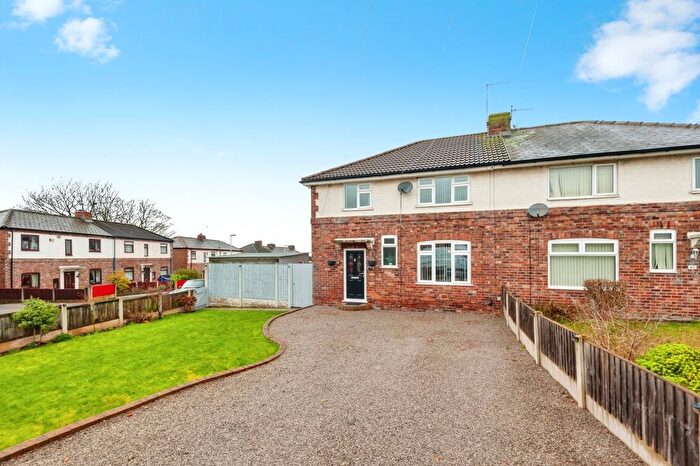
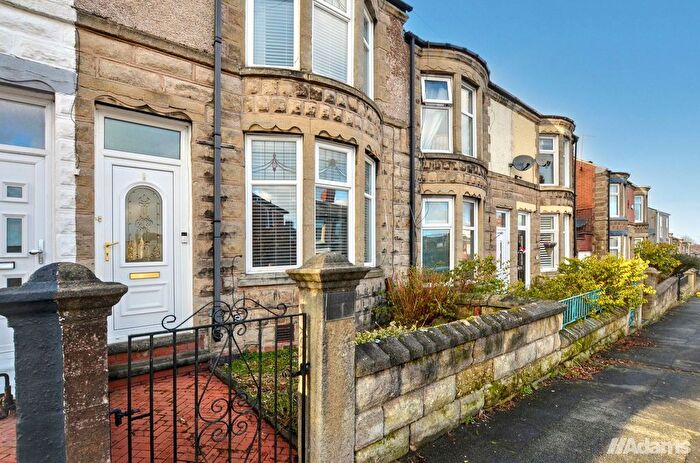
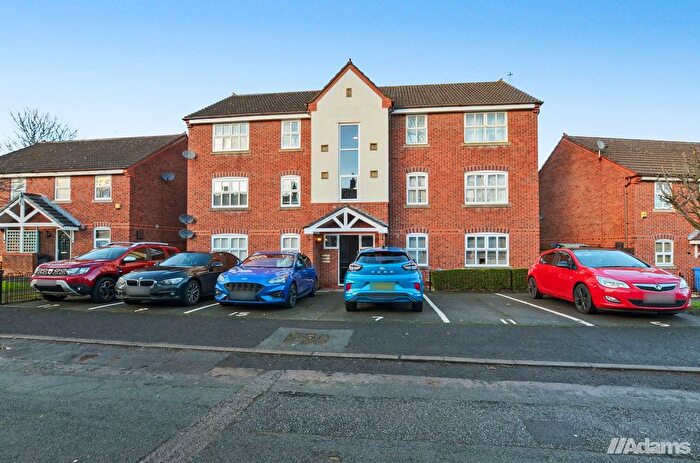
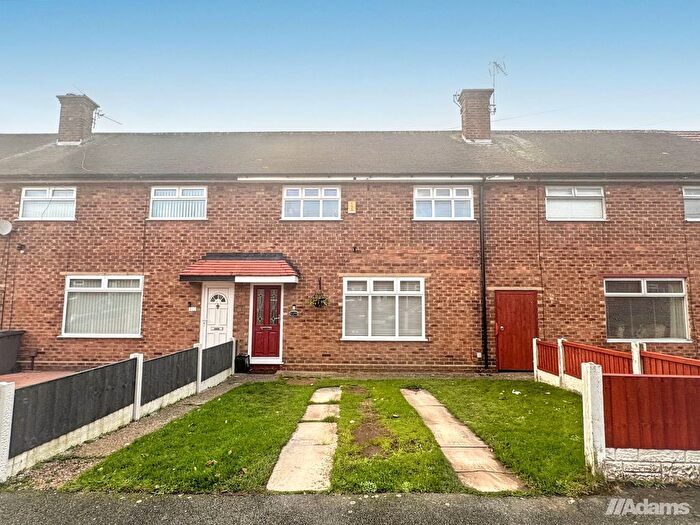
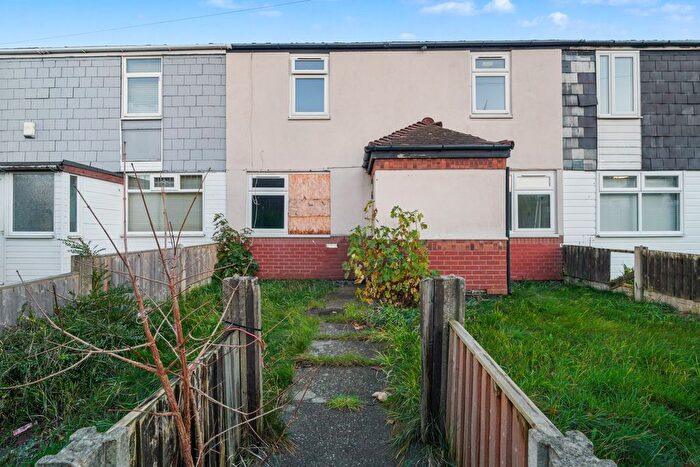
Previously listed properties in Grange
Roads and Postcodes in Grange
Navigate through our locations to find the location of your next house in Grange, Runcorn for sale or to rent.
| Streets | Postcodes |
|---|---|
| Acacia Grove | WA7 5LW |
| Almond Avenue | WA7 5JY |
| Ash Grove | WA7 5LR |
| Bamford Close | WA7 5NT |
| Beech Road | WA7 5FQ WA7 5LL WA7 5LN |
| Birch Crescent | WA7 5QR |
| Birch Road | WA7 5JL WA7 5JH WA7 5JN WA7 5JW |
| Birstall Court | WA7 5FB |
| Boston Avenue | WA7 5JQ |
| Camrose Close | WA7 5NS |
| Cawley Street | WA7 5PG |
| Cedar Avenue | WA7 5HD WA7 5HS |
| Cherry Tree Avenue | WA7 5JJ |
| Coronation Road | WA7 5QA WA7 5QD WA7 5QF WA7 5QH |
| Cotton Lane | WA7 5JB WA7 5NB WA7 5ND WA7 5NE |
| Cypress Grove | WA7 5HX |
| Dale Street | WA7 5PF |
| Davenport Row | WA7 5NA |
| Downs Road | WA7 5PX |
| Elm Road | WA7 5LA |
| Festival Way | WA7 5FN WA7 5JP WA7 5JR WA7 5JS WA7 5JT WA7 5JU WA7 5PD |
| Fieldhouse Row | WA7 5JD |
| Goodier Court | WA7 5GF |
| Grangemoor | WA7 5YA WA7 5YB WA7 5YD WA7 5YE |
| Grangeway | WA7 5EH WA7 5HA WA7 5HZ WA7 5JA WA7 5LY WA7 5BF WA7 5EQ WA7 5LQ WA7 5LS WA7 5LT WA7 5LU WA7 5LX WA7 5YH |
| Grangeway Court | WA7 5FA |
| Halton Lodge Avenue | WA7 5YQ |
| Harrop Road | WA7 5QE |
| Hawthorn Avenue | WA7 5NX |
| Heath Road | WA7 5TA WA7 5TF WA7 5TG WA7 5TB WA7 5TD WA7 5TJ WA7 5TN |
| Hemlock Close | WA7 5AB WA7 5AD |
| Hinton Road | WA7 5PH WA7 5PN WA7 5PZ |
| Ivy Street | WA7 5NU WA7 5NY WA7 5NZ WA7 5PA WA7 5PB |
| Kingsley Crescent | WA7 5PJ |
| Kingsley Road | WA7 5PL |
| Laburnum Grove | WA7 5EL WA7 5EX WA7 5EZ |
| Langdale Road | WA7 5PR WA7 5PT WA7 5PU WA7 5PY WA7 5QG |
| Larch Close | WA7 5JF |
| Larch Road | WA7 5HR WA7 5HY |
| Lilac Crescent | WA7 5JX |
| Lime Grove | WA7 5JZ |
| Linkway | WA7 5EJ |
| Local Centre | WA7 5YS |
| Lyndale | WA7 5FP |
| Lyndon Grove | WA7 5PP |
| Maple Avenue | WA7 5LB WA7 5LJ |
| Norleane Crescent | WA7 5ER WA7 5ES WA7 5ET WA7 5EU |
| Norman Road | WA7 5PE WA7 5PQ WA7 5PW |
| Oak Drive | WA7 5HE |
| Pear Tree Avenue | WA7 5HW WA7 5HP |
| Pine Road | WA7 5HH |
| Pool Hollow | WA7 5TE |
| Poolside Road | WA7 5QQ |
| Poplar Avenue | WA7 5HB WA7 5HT WA7 5HU |
| Poplar Close | WA7 5JE |
| Rowan Close | WA7 5YG |
| Rydal Grove | WA7 5EW |
| Swain Close | WA7 5AA |
| Sycamore Road | WA7 5LD WA7 5LE WA7 5LF WA7 5LG WA7 5LH |
| Thorn Close | WA7 5HG |
| Thorn Road | WA7 5HJ WA7 5HL WA7 5HN WA7 5JG WA7 5HF WA7 5HQ |
| Whitby Road | WA7 5PS |
| Willow Close | WA7 5EY |
| Windsor Grove | WA7 5EN WA7 5EP |
| Woodall Drive | WA7 5QB |
| WA7 5YF |
Transport near Grange
- FAQ
- Price Paid By Year
- Property Type Price
Frequently asked questions about Grange
What is the average price for a property for sale in Grange?
The average price for a property for sale in Grange is £156,616. This amount is 10% lower than the average price in Runcorn. There are 196 property listings for sale in Grange.
What streets have the most expensive properties for sale in Grange?
The streets with the most expensive properties for sale in Grange are Woodall Drive at an average of £255,237, Windsor Grove at an average of £235,375 and Rydal Grove at an average of £229,250.
What streets have the most affordable properties for sale in Grange?
The streets with the most affordable properties for sale in Grange are Oak Drive at an average of £82,000, Pear Tree Avenue at an average of £93,750 and Cotton Lane at an average of £105,125.
Which train stations are available in or near Grange?
Some of the train stations available in or near Grange are Runcorn, Runcorn East and Frodsham.
Property Price Paid in Grange by Year
The average sold property price by year was:
| Year | Average Sold Price | Price Change |
Sold Properties
|
|---|---|---|---|
| 2025 | £151,625 | -8% |
53 Properties |
| 2024 | £164,223 | 7% |
66 Properties |
| 2023 | £152,846 | -1% |
63 Properties |
| 2022 | £154,457 | 17% |
108 Properties |
| 2021 | £127,690 | 9% |
84 Properties |
| 2020 | £116,112 | 4% |
48 Properties |
| 2019 | £111,314 | 8% |
69 Properties |
| 2018 | £102,620 | 4% |
78 Properties |
| 2017 | £98,925 | -1% |
61 Properties |
| 2016 | £99,829 | -6% |
74 Properties |
| 2015 | £105,618 | 10% |
69 Properties |
| 2014 | £95,220 | -6% |
72 Properties |
| 2013 | £100,602 | 10% |
54 Properties |
| 2012 | £90,182 | -5% |
37 Properties |
| 2011 | £94,666 | 3% |
36 Properties |
| 2010 | £92,186 | 13% |
49 Properties |
| 2009 | £80,443 | -38% |
31 Properties |
| 2008 | £111,191 | 8% |
46 Properties |
| 2007 | £102,329 | -1% |
93 Properties |
| 2006 | £103,405 | 2% |
119 Properties |
| 2005 | £100,996 | 12% |
113 Properties |
| 2004 | £88,822 | 23% |
95 Properties |
| 2003 | £68,210 | 23% |
92 Properties |
| 2002 | £52,297 | 6% |
103 Properties |
| 2001 | £49,341 | 10% |
73 Properties |
| 2000 | £44,168 | 10% |
83 Properties |
| 1999 | £39,727 | 1% |
66 Properties |
| 1998 | £39,169 | -1% |
55 Properties |
| 1997 | £39,683 | 2% |
51 Properties |
| 1996 | £38,788 | -14% |
59 Properties |
| 1995 | £44,286 | - |
33 Properties |
Property Price per Property Type in Grange
Here you can find historic sold price data in order to help with your property search.
The average Property Paid Price for specific property types in the last three years are:
| Property Type | Average Sold Price | Sold Properties |
|---|---|---|
| Semi Detached House | £184,356.00 | 83 Semi Detached Houses |
| Detached House | £290,990.00 | 5 Detached Houses |
| Terraced House | £127,293.00 | 91 Terraced Houses |
| Flat | £54,666.00 | 3 Flats |

