
Houses for sale & to rent in Marlborough, Harrow
House Prices in Marlborough
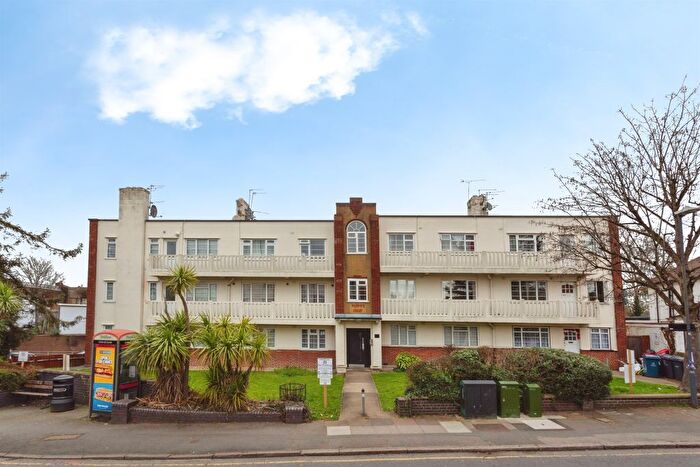
Properties in this part of Marlborough within Harrow have an average house price of £440k and had 274 Property Transactions within the last 3 years¹. This area has 4,307 households² , where the most expensive property was sold for £1.85M.
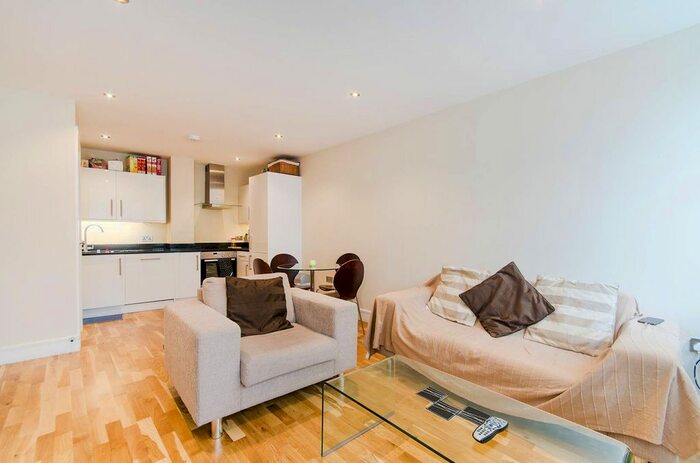
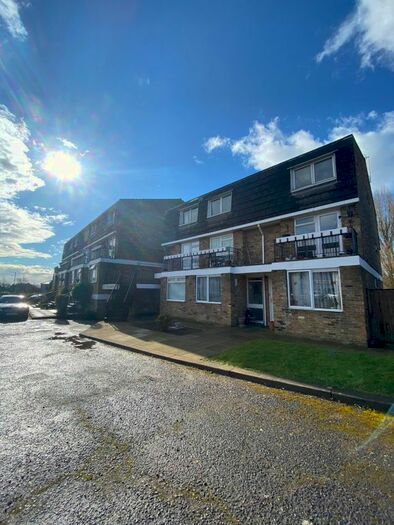
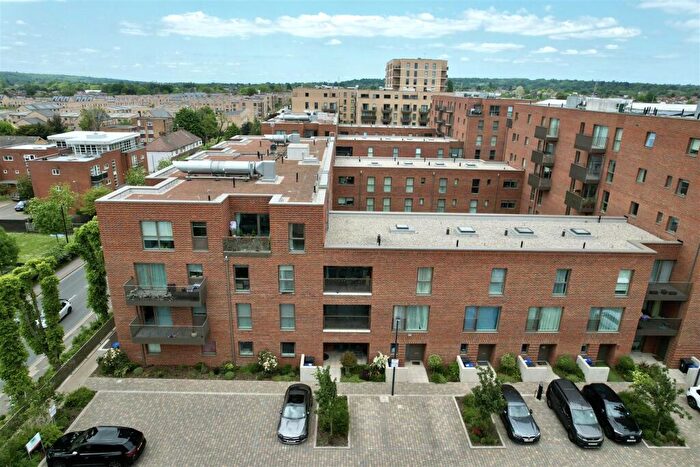
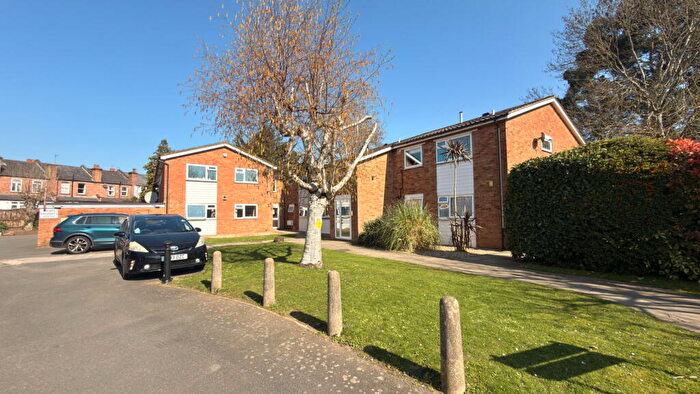
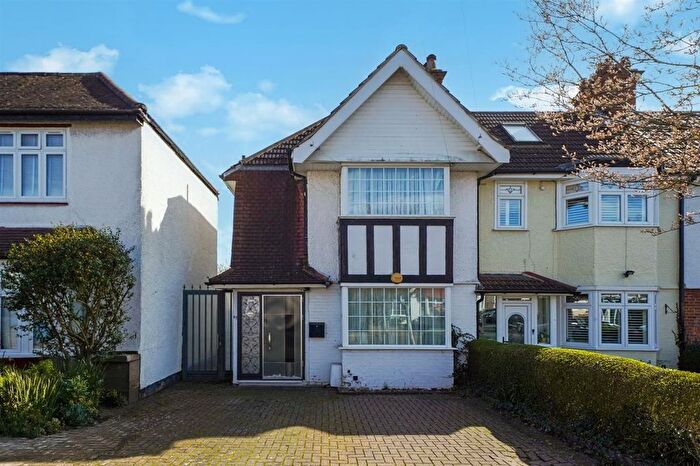
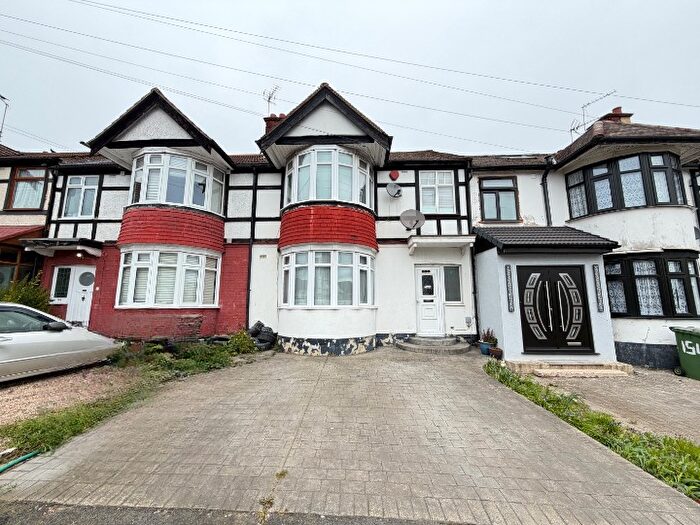
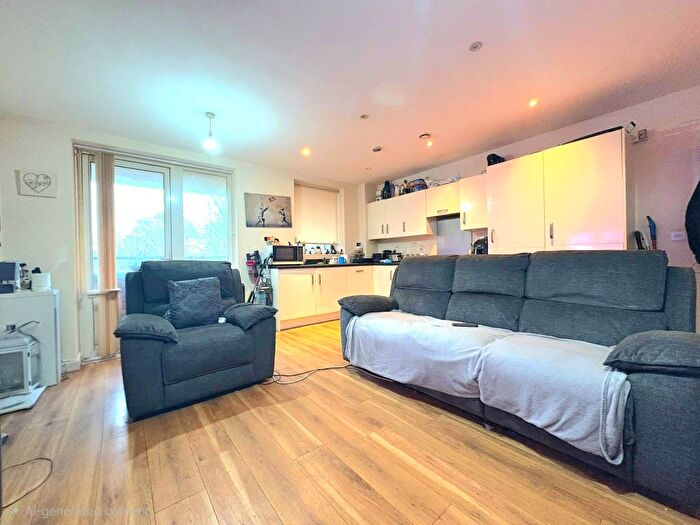
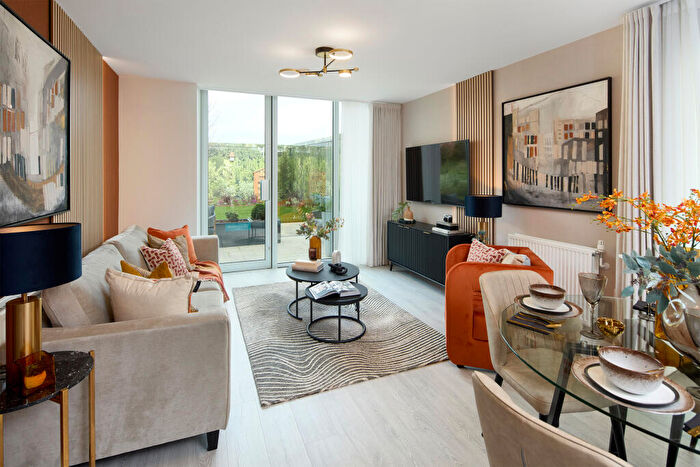
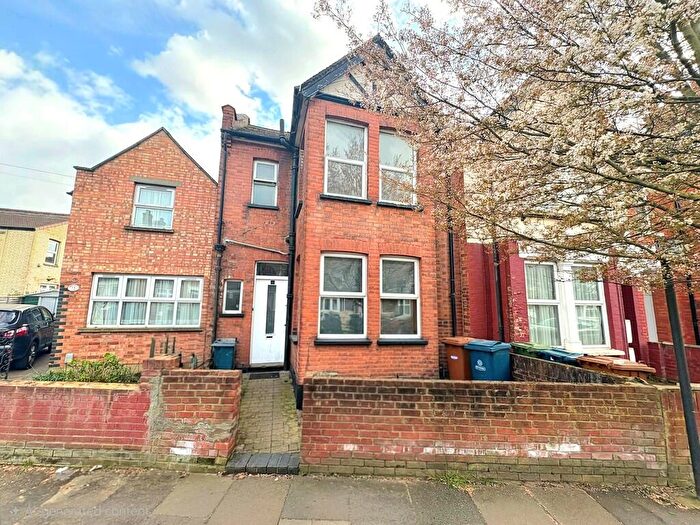
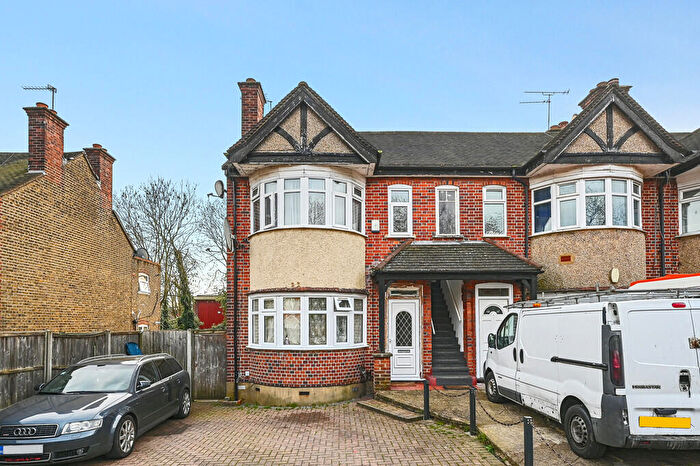
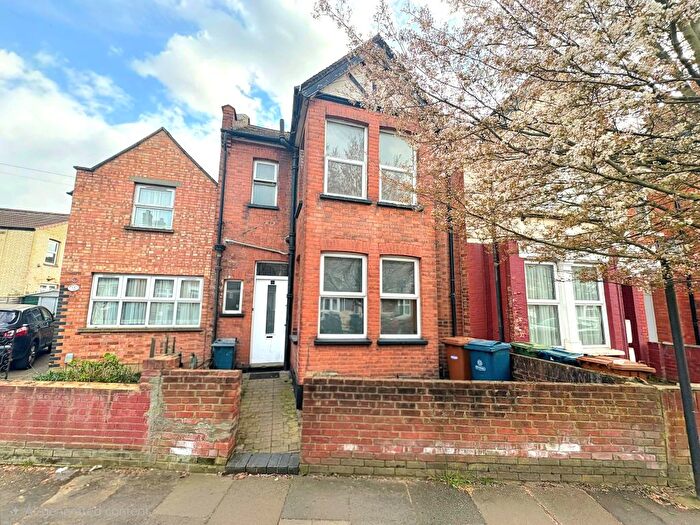
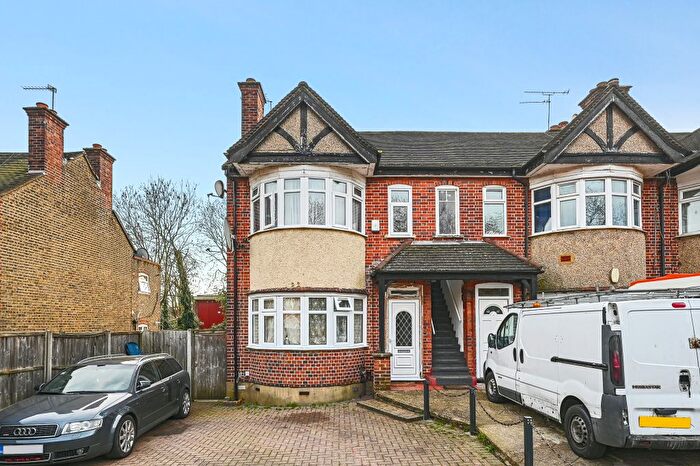
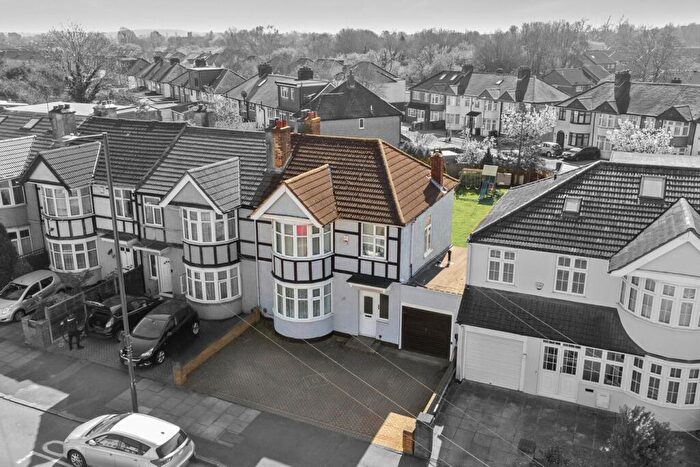
Properties for sale in Marlborough
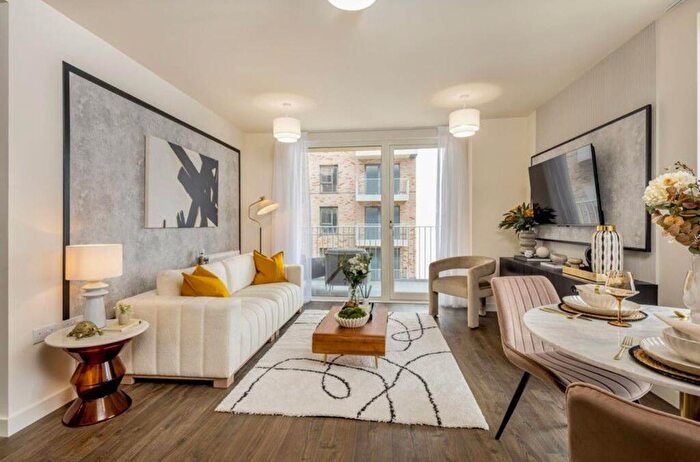
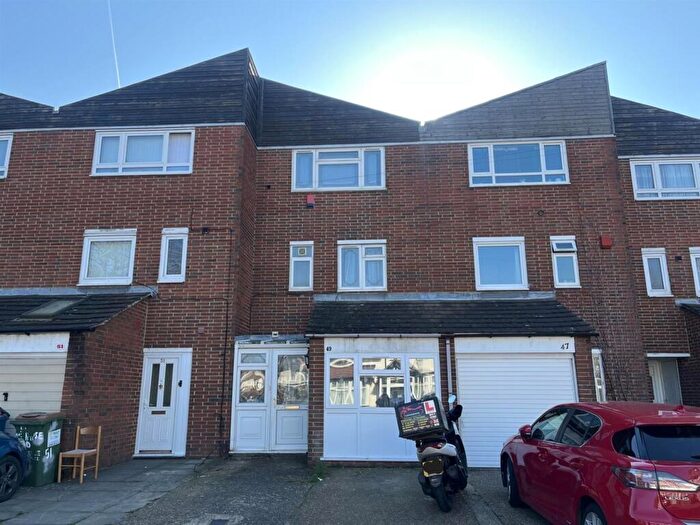
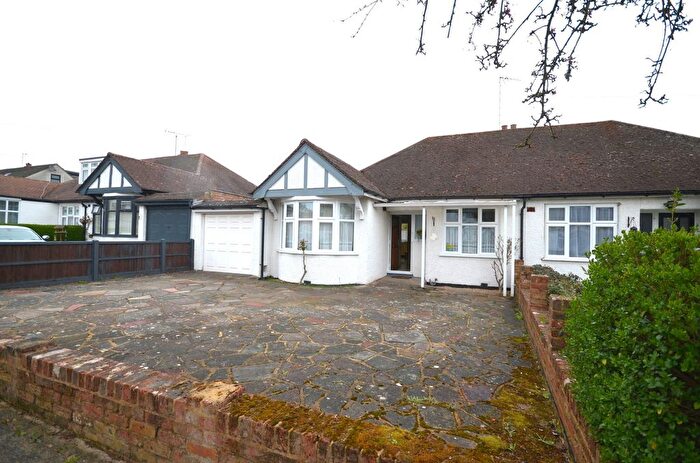

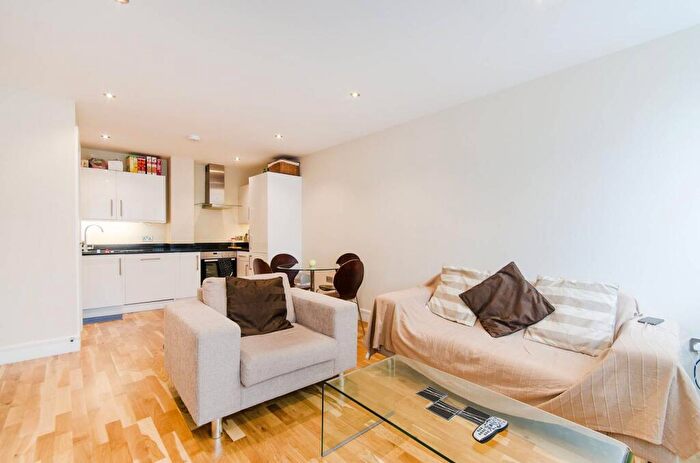
![]()
If you are looking to sell your house, let it out, or receive a property valuation, an expert can help you.
Click the button below to get started.

Roads and Postcodes in Marlborough
Navigate through our locations to find the location of your next house in Marlborough, Harrow for sale or to rent.
Transport near Marlborough
-


 Harrow and Wealdstone Station
 -
Harrow-on-the-Hill Station
-
Kenton Station
-
Headstone Lane Station
-
Northwick Park Station
-
West Harrow Station
-
North Harrow Station
-
South Kenton Station
-
Hatch End Station
-
Rayners Lane Station
- FAQ
- Price Paid By Year
- Property Type Price
Frequently asked questions about Marlborough
What is the average price for a property for sale in Marlborough?
The average price for a property for sale in Marlborough is £440,197. This amount is 10% lower than the average price in Harrow. There are 5,024 property listings for sale in Marlborough.
What streets have the most expensive properties for sale in Marlborough?
The streets with the most expensive properties for sale in Marlborough are Oxford Road at an average of £1,845,000, Kings Way at an average of £747,333 and Grasmere Gardens at an average of £677,000.
What streets have the most affordable properties for sale in Marlborough?
The streets with the most affordable properties for sale in Marlborough are Archery Close at an average of £266,000, Canning Road at an average of £270,928 and Palmerston Road at an average of £272,666.
Which train stations are available in or near Marlborough?
Some of the train stations available in or near Marlborough are Harrow and Wealdstone, Harrow-on-the-Hill and Kenton.
Which tube stations are available in or near Marlborough?
Some of the tube stations available in or near Marlborough are Harrow and Wealdstone, Harrow-on-the-Hill and Kenton.
Property Price Paid in Marlborough by Year
The average sold property price by year was:
| Year | Average Sold Price | Price Change |
Sold Properties
|
|---|---|---|---|
| 2026 | £520,000 | 16% |
1 Property |
| 2025 | £434,715 | -1% |
89 Properties |
| 2024 | £437,760 | -2% |
96 Properties |
| 2023 | £447,492 | -2% |
88 Properties |
| 2022 | £456,990 | 4% |
114 Properties |
| 2021 | £439,681 | 5% |
154 Properties |
| 2020 | £416,259 | 5% |
180 Properties |
| 2019 | £396,952 | 1% |
120 Properties |
| 2018 | £394,825 | -3% |
98 Properties |
| 2017 | £407,204 | 5% |
99 Properties |
| 2016 | £384,925 | 11% |
102 Properties |
| 2015 | £344,412 | 16% |
159 Properties |
| 2014 | £289,361 | 4% |
173 Properties |
| 2013 | £277,464 | 7% |
114 Properties |
| 2012 | £258,202 | 4% |
92 Properties |
| 2011 | £246,826 | 8% |
89 Properties |
| 2010 | £226,623 | -9% |
137 Properties |
| 2009 | £247,163 | -2% |
72 Properties |
| 2008 | £252,181 | 2% |
117 Properties |
| 2007 | £246,228 | 7% |
235 Properties |
| 2006 | £228,660 | 2% |
273 Properties |
| 2005 | £222,949 | 5% |
171 Properties |
| 2004 | £211,193 | 10% |
203 Properties |
| 2003 | £189,553 | 10% |
262 Properties |
| 2002 | £169,681 | 18% |
270 Properties |
| 2001 | £139,260 | 10% |
261 Properties |
| 2000 | £125,503 | 15% |
232 Properties |
| 1999 | £107,280 | 16% |
259 Properties |
| 1998 | £90,466 | 13% |
209 Properties |
| 1997 | £79,146 | 16% |
232 Properties |
| 1996 | £66,223 | 1% |
210 Properties |
| 1995 | £65,284 | - |
174 Properties |
Property Price per Property Type in Marlborough
Here you can find historic sold price data in order to help with your property search.
The average Property Paid Price for specific property types in the last three years are:
| Property Type | Average Sold Price | Sold Properties |
|---|---|---|
| Flat | £318,468.00 | 121 Flats |
| Semi Detached House | £556,208.00 | 67 Semi Detached Houses |
| Detached House | £711,000.00 | 7 Detached Houses |
| Terraced House | £504,257.00 | 79 Terraced Houses |