
Houses for sale in Hartlepool, Hartlepool
House Prices in Hartlepool
Properties in Hartlepool have an average house price of £130k and had 4,729 Property Transactions within the last 3 years.¹
Hartlepool is an area in Hartlepool with 40,606 households², where the most expensive property was sold for £960k.
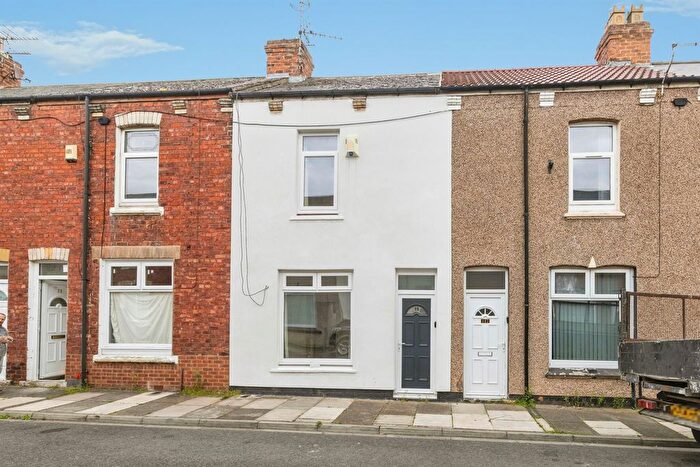
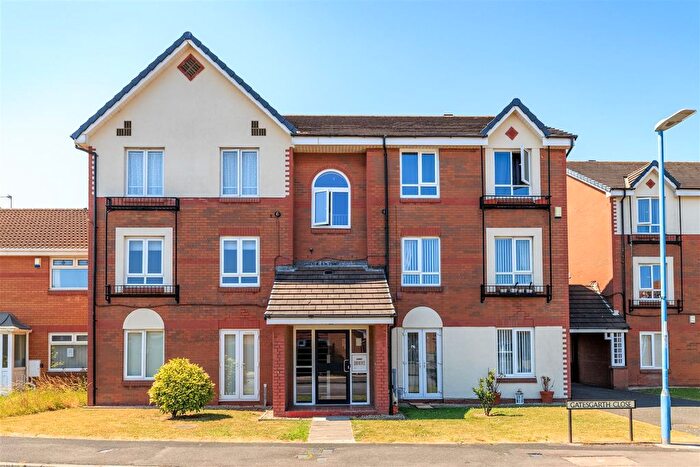
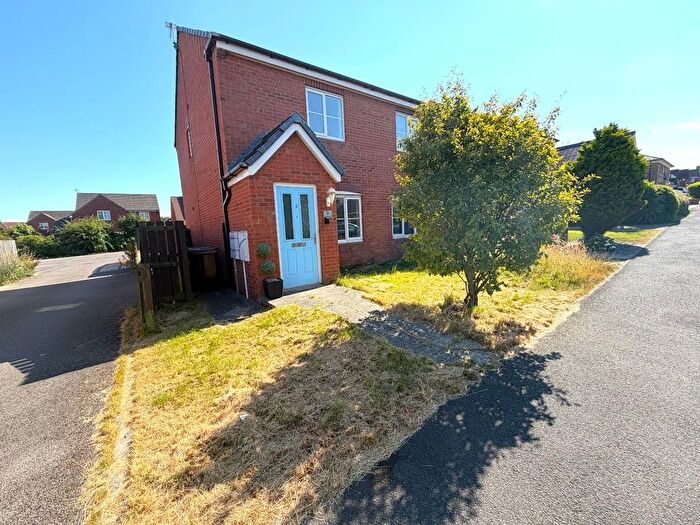
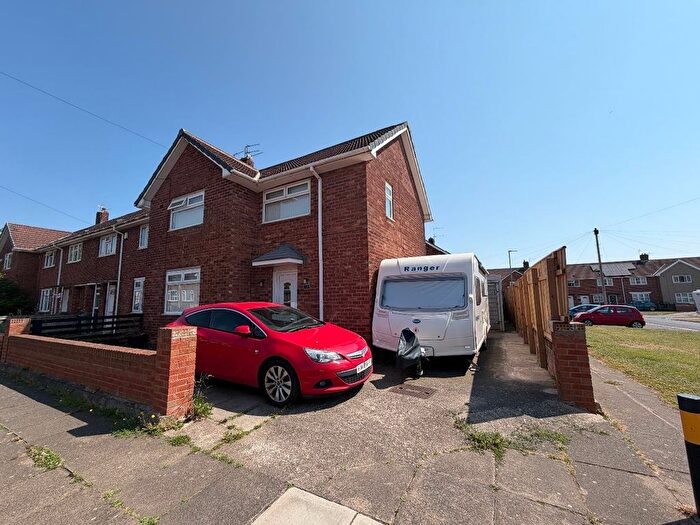
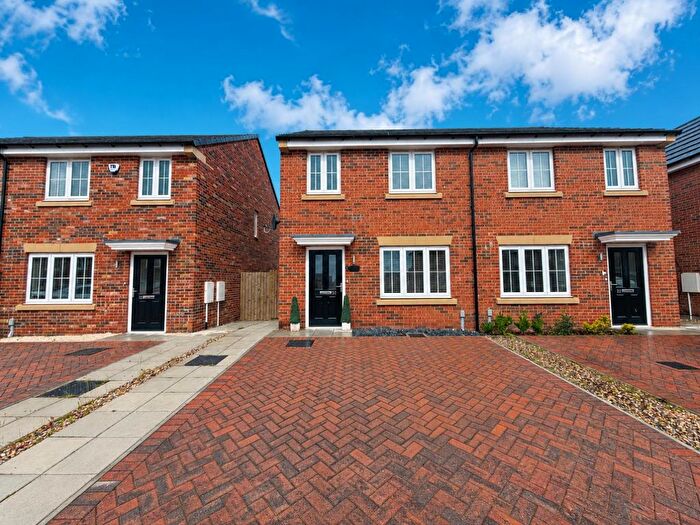
Properties for sale in Hartlepool
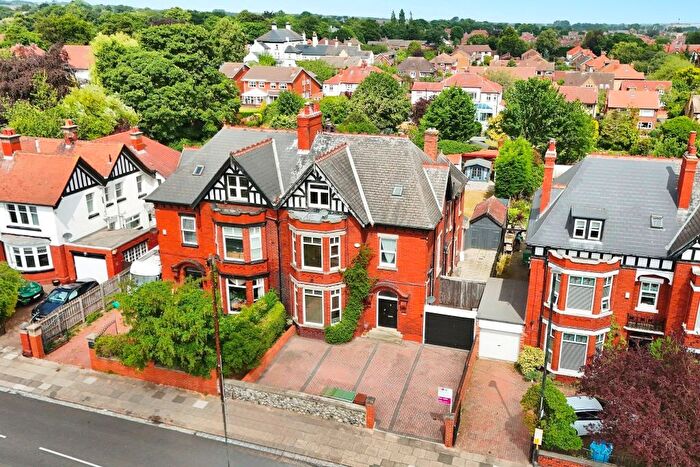
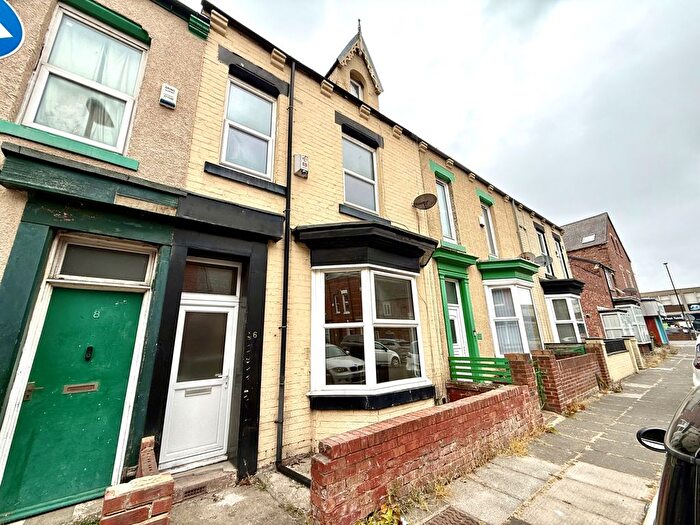
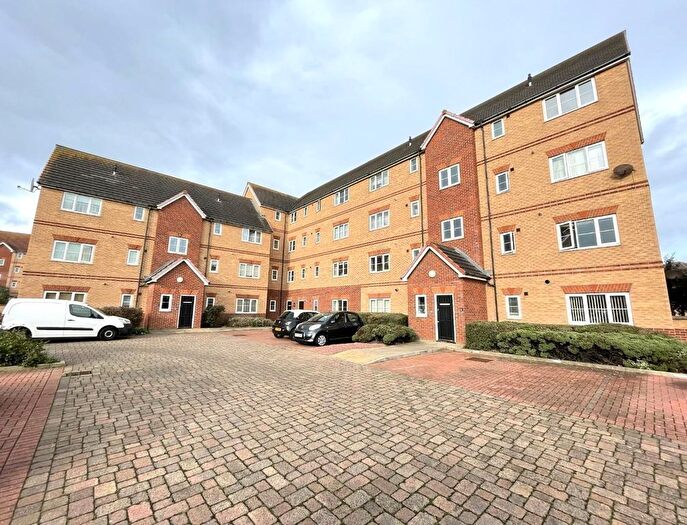
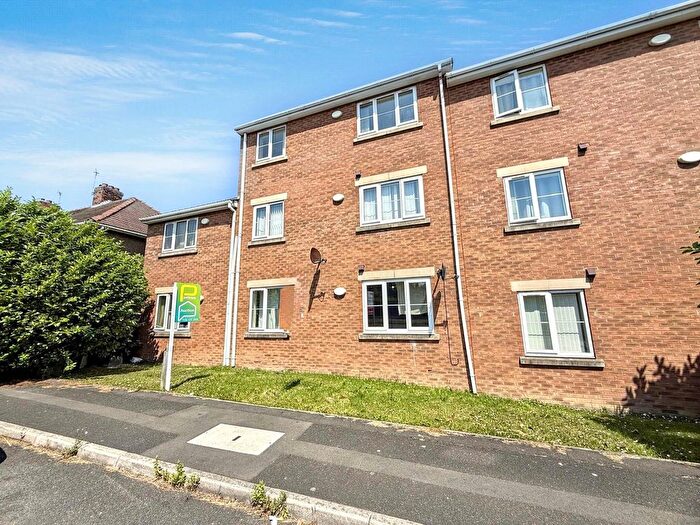
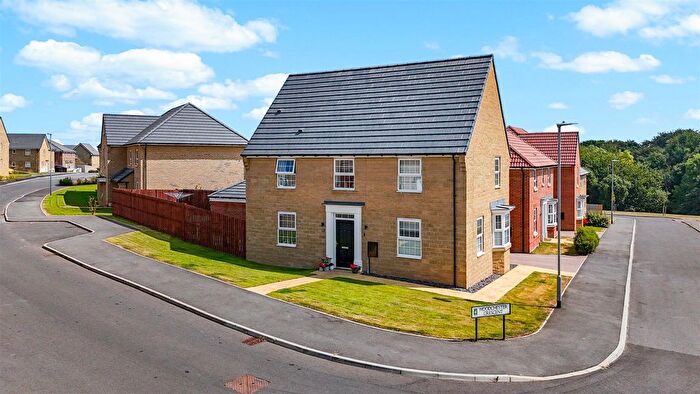
![]()
If you are looking to sell your house, let it out, or receive a property valuation, an expert can help you.
Click the button below to get started.
Neighbourhoods in Hartlepool
Navigate through our locations to find the location of your next house in Hartlepool, Hartlepool for sale or to rent.
Property price trends in Hartlepool
According to the latest Land Registry data, the average home in Hartlepool sold for £140,409 in 2026. That figure comes from a substantial record of 48,390 sales logged over the past 31 years.
Prices have continued to climb over the last three years. Compared with 2023, when the typical sale came in around £128,527, that's a rise of roughly 9.2%.
Looking back five years, average prices are up about 9% since 2021, a gain of around £11,645 in cash terms.
Zoom out to the past decade for the fuller picture. Back in 2016, homes here averaged £118,210, so the typical sold price has climbed about 18.8% since then, roughly 1.7% a year. Stretch the view to fifteen years and that annual pace eases back to about 1.1%.
Frequently asked questions about Hartlepool
What is the average price for a property for sale in Hartlepool?
The average price for a property for sale in Hartlepool is £130,101. This amount is 5% lower than the average price in Hartlepool. There are 7,079 property listings for sale in Hartlepool.
What locations have the most expensive properties for sale in Hartlepool?
The locations with the most expensive properties for sale in Hartlepool are Rural West at an average of £306,781, Fens & Greatham at an average of £198,625 and Hart at an average of £196,850.
What locations have the most affordable properties for sale in Hartlepool?
The locations with the most affordable properties for sale in Hartlepool are Victoria at an average of £78,152, Manor House at an average of £85,250 and Burn Valley at an average of £94,617.
Which train stations are available in or near Hartlepool?
Some of the train stations available in or near Hartlepool are Hartlepool, Seaton Carew and Billingham.
Property Price Paid in Hartlepool by Year
The average sold property price by year was:
| Year | Average Sold Price | Price Change |
Sold Properties
|
|---|---|---|---|
| 2026 | £140,409 | 3% |
108 Properties |
| 2025 | £136,423 | 8% |
1,475 Properties |
| 2024 | £125,215 | -3% |
1,657 Properties |
| 2023 | £128,527 | -3% |
1,489 Properties |
| 2022 | £132,255 | 3% |
1,737 Properties |
| 2021 | £128,764 | 3% |
2,026 Properties |
| 2020 | £125,458 | 2% |
1,490 Properties |
| 2019 | £123,278 | -6% |
1,499 Properties |
| 2018 | £130,339 | 4% |
1,495 Properties |
| 2017 | £124,475 | 5% |
1,449 Properties |
Property Price per Property Type in Hartlepool
Here you can find historic sold price data in order to help with your property search.
The average Property Paid Price for specific property types in the last three years are:
| Property Type | Average Sold Price | Sold Properties |
|---|---|---|
| Semi Detached House | £147,953.00 | 1,275 Semi Detached Houses |
| Terraced House | £77,993.00 | 2,436 Terraced Houses |
| Detached House | £273,057.00 | 784 Detached Houses |
| Flat | £96,321.00 | 234 Flats |
Transport in Hartlepool
Please see below transportation links in this area:
