
Houses for sale & to rent in Sawbridgeworth, Bishops Stortford
House Prices in Sawbridgeworth
Properties in Sawbridgeworth have an average house price of £581,722.00 and had 9 Property Transactions within the last 3 years¹.
Sawbridgeworth is an area in Bishops Stortford, Hertfordshire with 69 households², where the most expensive property was sold for £1,185,000.00.
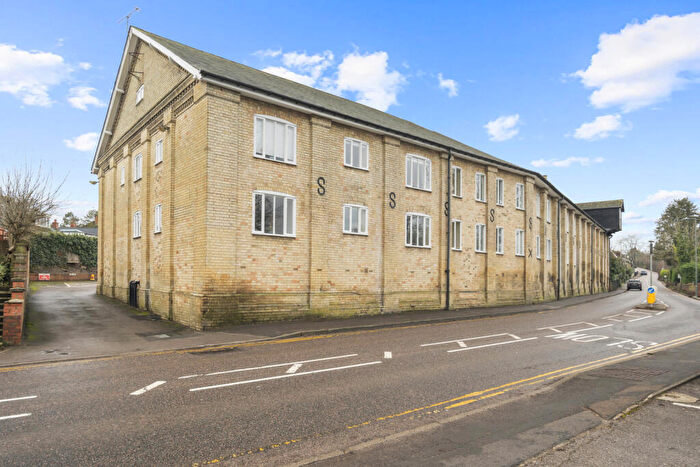
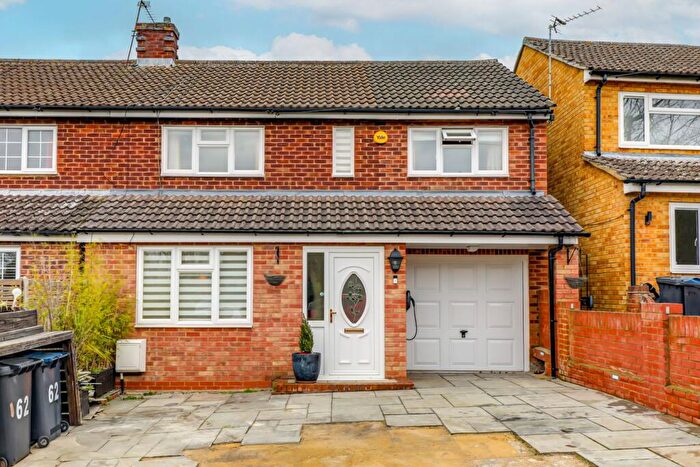
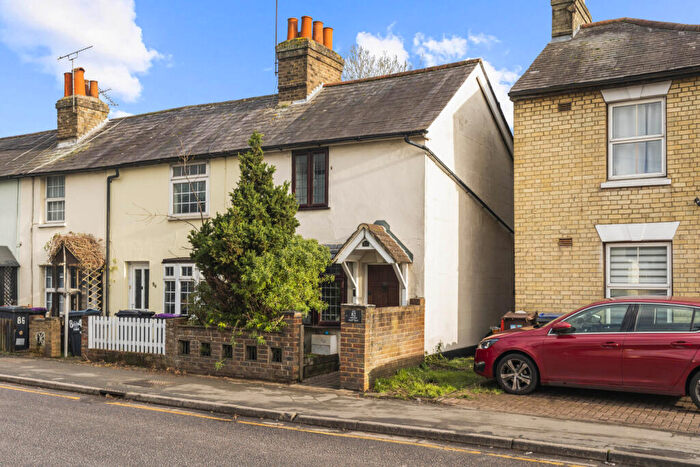
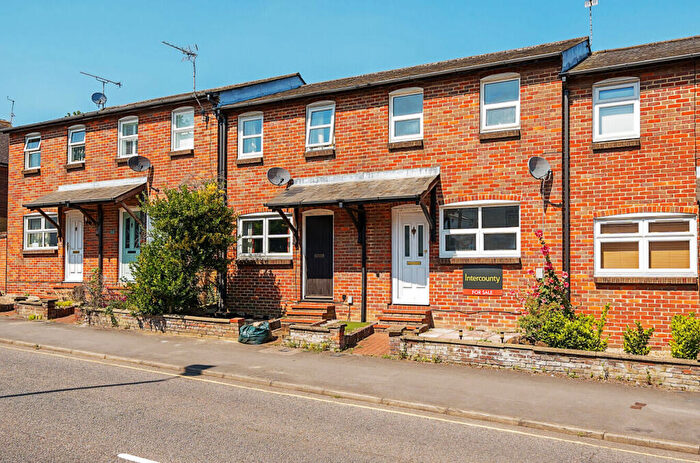
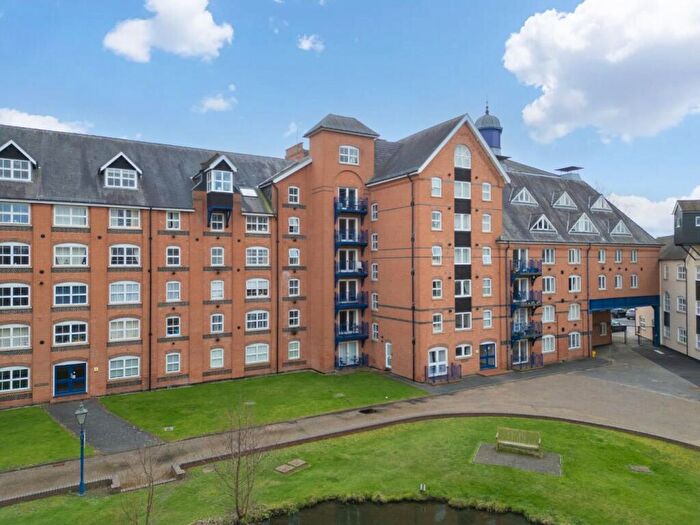
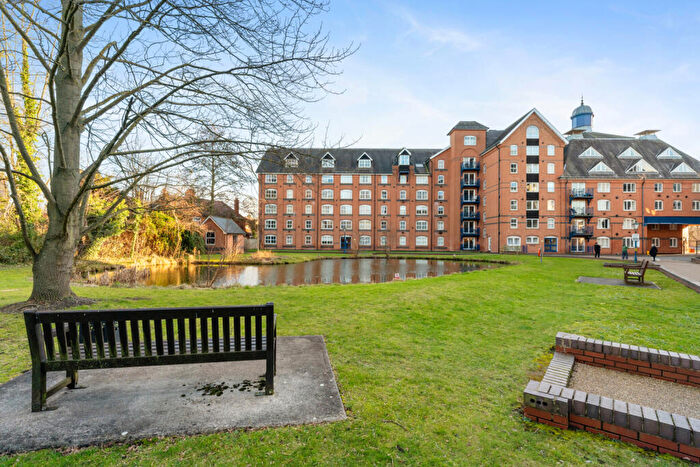
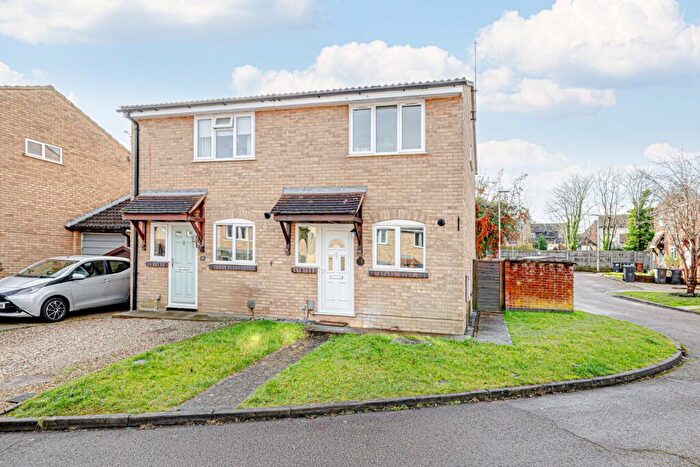
Properties for sale in Sawbridgeworth
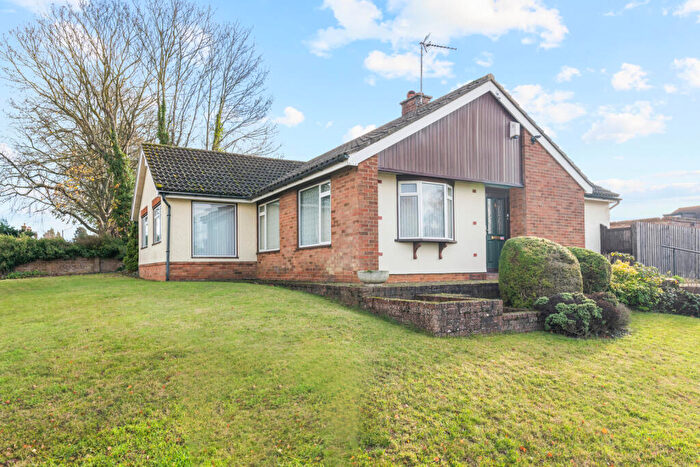
![]()
If you are looking to sell your house, let it out, or receive a property valuation, an expert can help you.
Click the button below to get started.

Roads and Postcodes in Sawbridgeworth
Navigate through our locations to find the location of your next house in Sawbridgeworth, Bishops Stortford for sale or to rent.
| Streets | Postcodes |
|---|---|
| Cambridge Road | CM20 2HE |
| Harvest Close | CM23 4RE |
| London Road | CM23 4AU CM23 4AX CM23 4BA |
| Oram Court | CM23 4RB |
| Spellbrook Lane East | CM22 7SE |
| Spellbrook Lane West | CM23 4AY CM23 4BU |
| St James Way | CM23 4RD |
| Tednambury | CM23 4BB CM23 4BD |
Transport near Sawbridgeworth

- FAQ
- Price Paid By Year
- Property Type Price
Frequently asked questions about Sawbridgeworth
What is the average price for a property for sale in Sawbridgeworth?
The average price for a property for sale in Sawbridgeworth is £581,722. This amount is 21% higher than the average price in Bishops Stortford. There are 703 property listings for sale in Sawbridgeworth.
What streets have the most expensive properties for sale in Sawbridgeworth?
The street with the most expensive properties for sale in Sawbridgeworth is London Road at an average of £705,500.
What streets have the most affordable properties for sale in Sawbridgeworth?
The street with the most affordable properties for sale in Sawbridgeworth is Tednambury at an average of £687,500.
Which train stations are available in or near Sawbridgeworth?
Some of the train stations available in or near Sawbridgeworth are Sawbridgeworth, Bishops Stortford and Harlow Mill.
Property Price Paid in Sawbridgeworth by Year
The average sold property price by year was:
| Year | Average Sold Price | Price Change |
Sold Properties
|
|---|---|---|---|
| 2025 | £1,000,000 | 53% |
1 Property |
| 2024 | £470,666 | -20% |
3 Properties |
| 2023 | £564,700 | -62% |
5 Properties |
| 2022 | £913,333 | 32% |
6 Properties |
| 2021 | £622,500 | -7% |
3 Properties |
| 2020 | £665,625 | -4% |
4 Properties |
| 2019 | £694,500 | 43% |
6 Properties |
| 2018 | £393,500 | 7% |
2 Properties |
| 2017 | £367,500 | -16% |
4 Properties |
| 2016 | £425,000 | 41% |
1 Property |
| 2015 | £250,000 | -86% |
1 Property |
| 2014 | £465,750 | 6% |
4 Properties |
| 2013 | £437,500 | 51% |
2 Properties |
| 2012 | £213,500 | -79% |
2 Properties |
| 2011 | £382,500 | 20% |
4 Properties |
| 2010 | £306,000 | 40% |
2 Properties |
| 2009 | £185,000 | -88% |
1 Property |
| 2008 | £347,500 | -23% |
1 Property |
| 2007 | £425,899 | 19% |
5 Properties |
| 2006 | £343,721 | 14% |
2 Properties |
| 2005 | £295,666 | 7% |
3 Properties |
| 2004 | £276,400 | 3% |
5 Properties |
| 2003 | £267,500 | 21% |
2 Properties |
| 2002 | £210,142 | -6% |
7 Properties |
| 2001 | £222,500 | -22% |
3 Properties |
| 2000 | £271,200 | 34% |
5 Properties |
| 1999 | £177,750 | 48% |
4 Properties |
| 1998 | £92,650 | -47% |
3 Properties |
| 1997 | £136,400 | - |
5 Properties |
| 1996 | £136,390 | 42% |
5 Properties |
| 1995 | £79,498 | - |
4 Properties |
Property Price per Property Type in Sawbridgeworth
Here you can find historic sold price data in order to help with your property search.
The average Property Paid Price for specific property types in the last three years are:
| Property Type | Average Sold Price | Sold Properties |
|---|---|---|
| Semi Detached House | £417,100.00 | 5 Semi Detached Houses |
| Detached House | £787,500.00 | 4 Detached Houses |