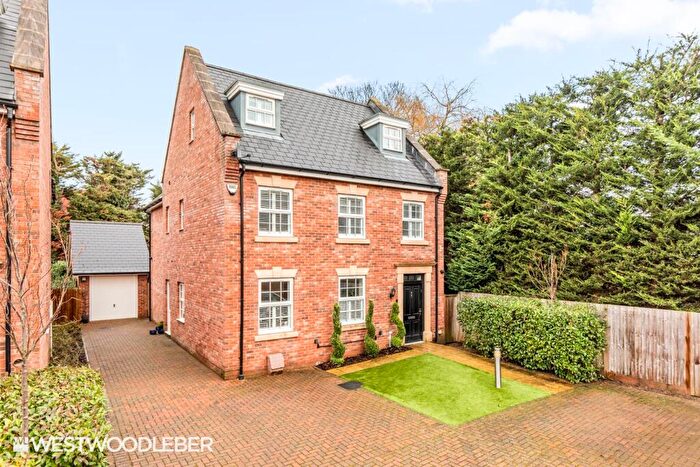
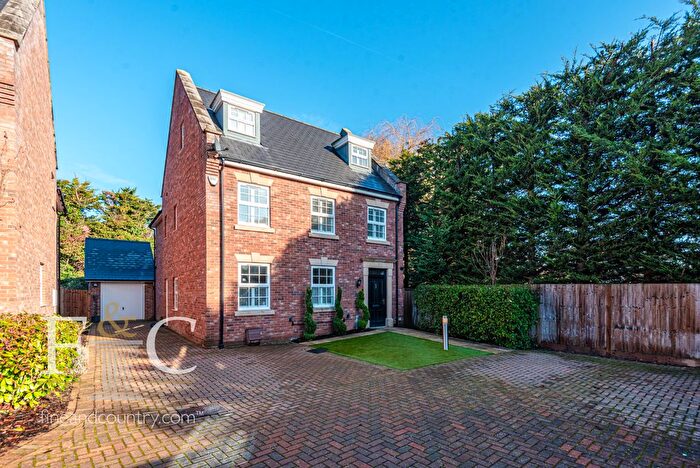
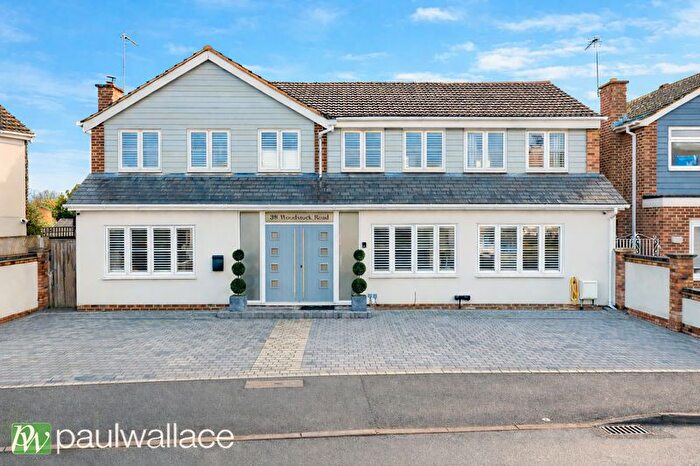
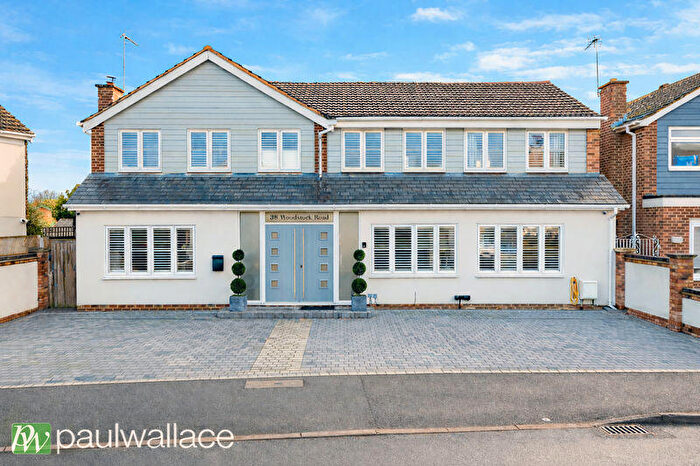
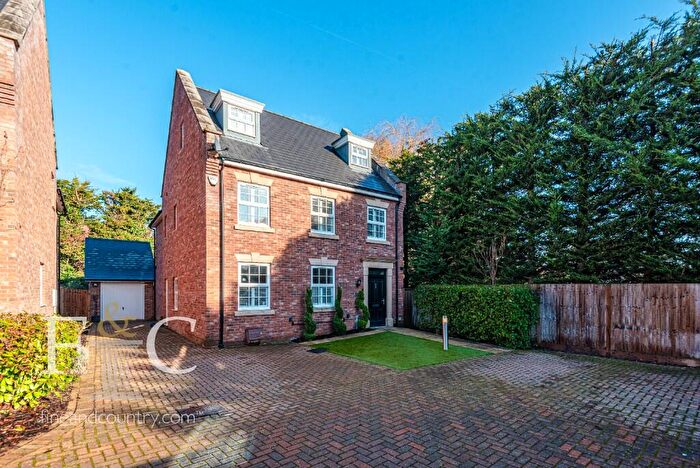
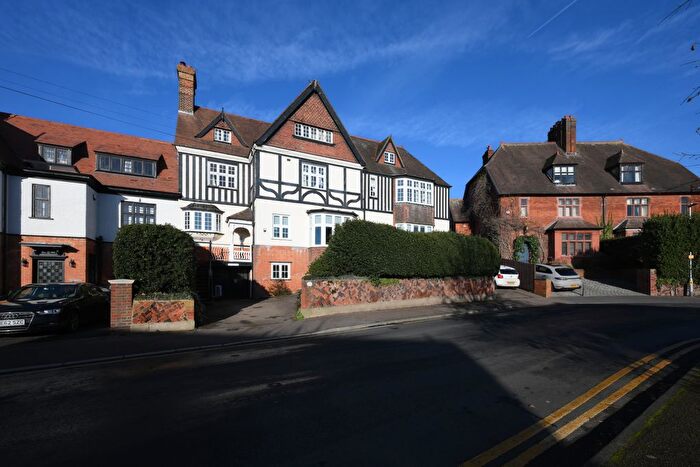
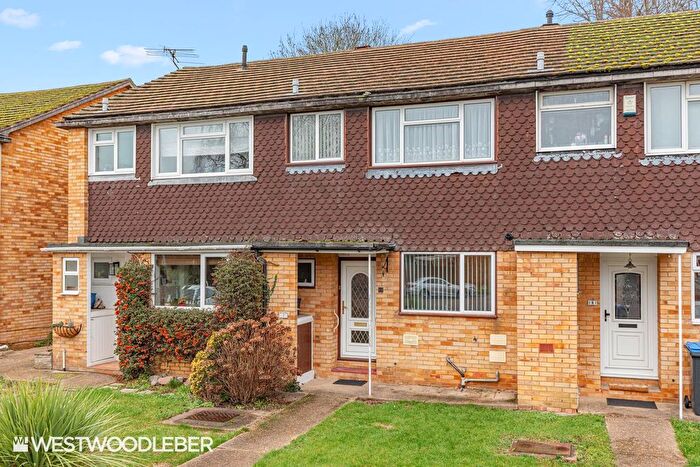
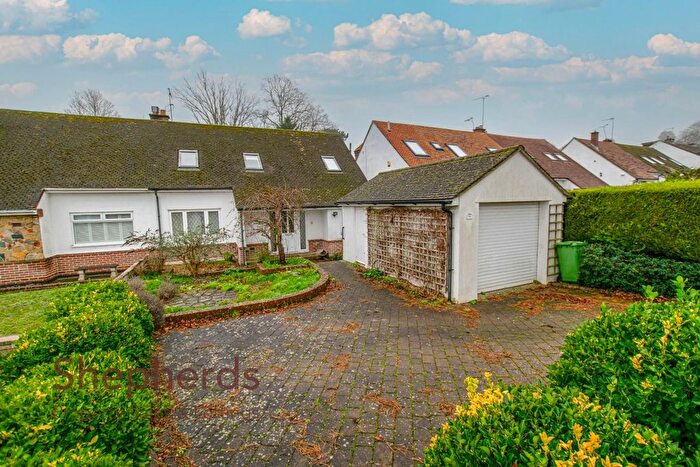
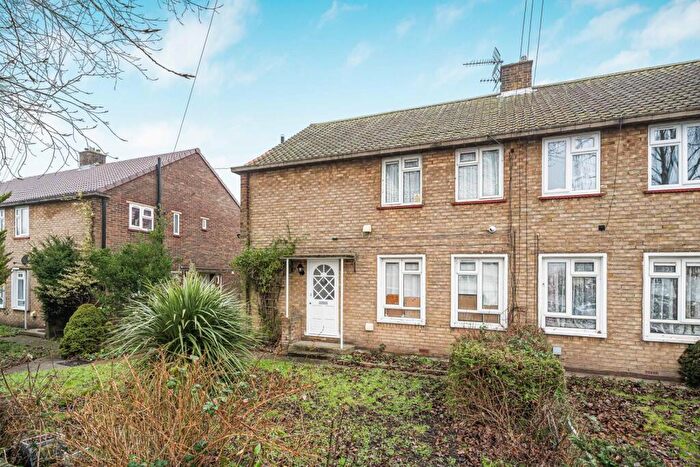
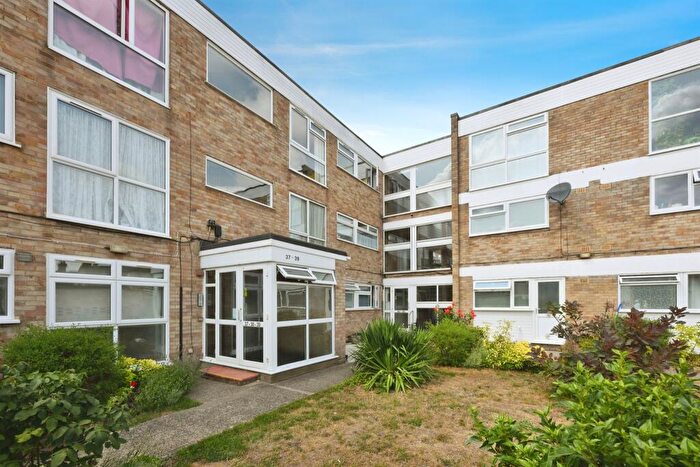
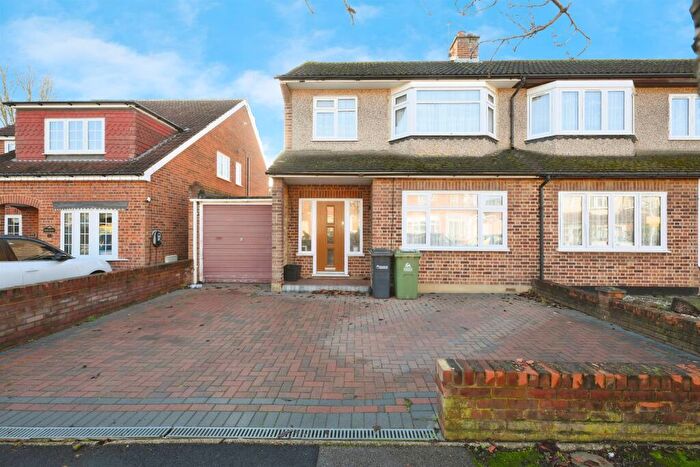
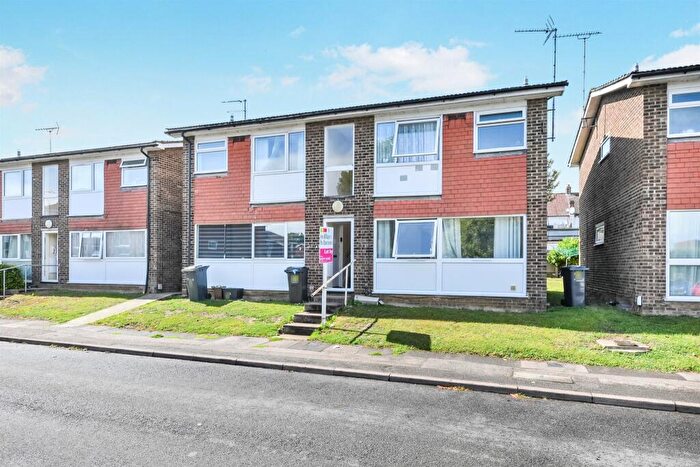
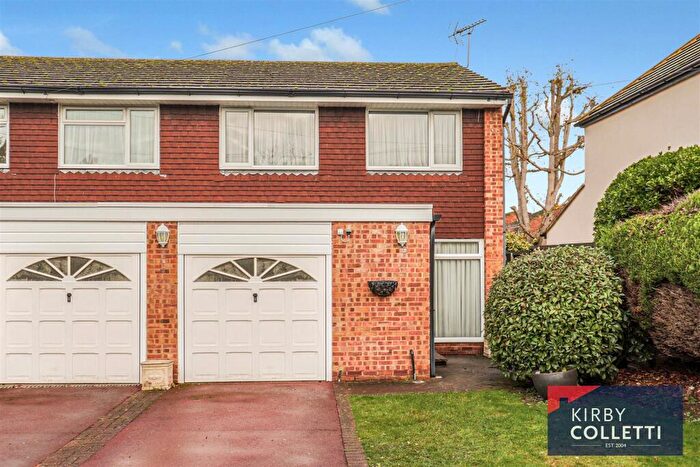
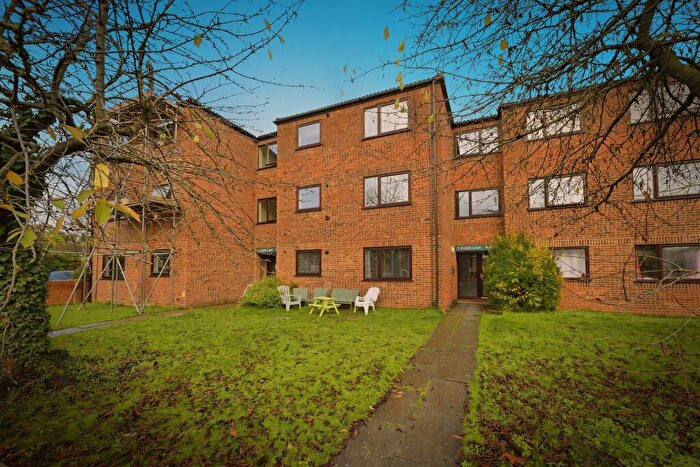
Houses for sale & to rent in Broxbourne And Hoddesdon South, Broxbourne
House Prices in Broxbourne And Hoddesdon South
Properties in Broxbourne And Hoddesdon South have an average house price of £662,224.00 and had 288 Property Transactions within the last 3 years¹.
Broxbourne And Hoddesdon South is an area in Broxbourne, Hertfordshire with 2,553 households², where the most expensive property was sold for £3,450,000.00.
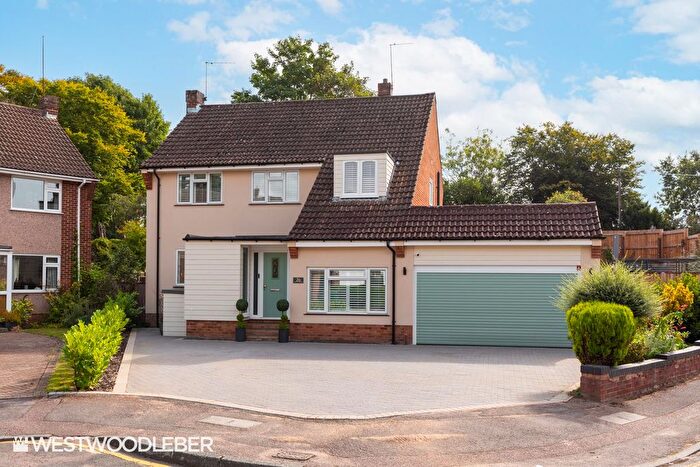
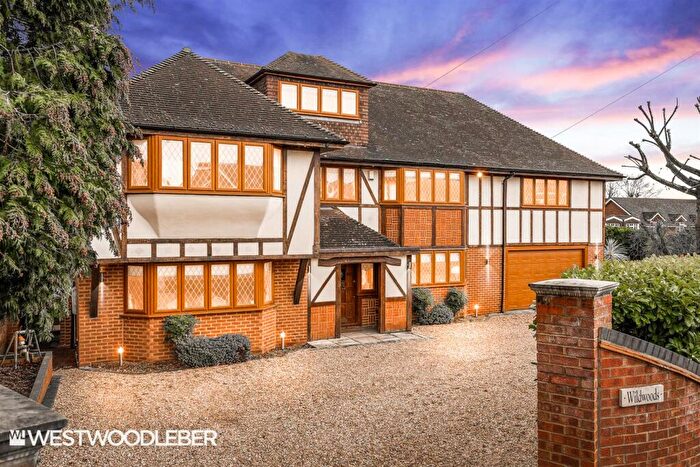
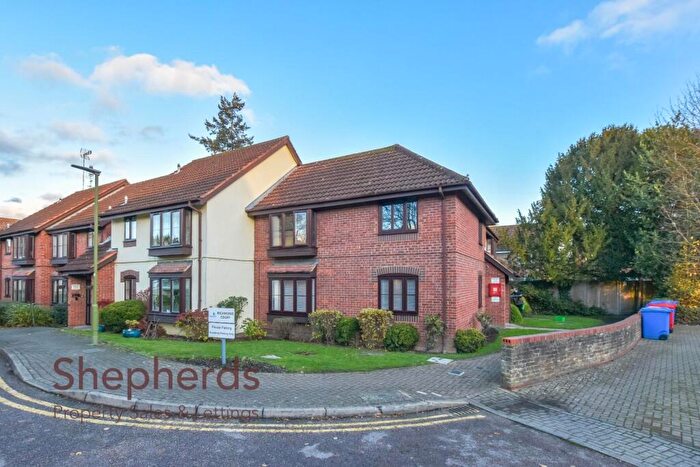
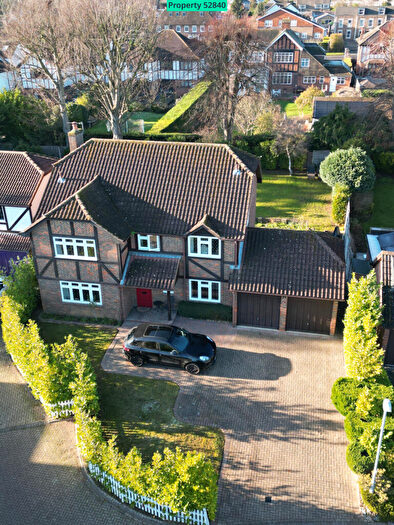
Properties for sale in Broxbourne And Hoddesdon South
Roads and Postcodes in Broxbourne And Hoddesdon South
Navigate through our locations to find the location of your next house in Broxbourne And Hoddesdon South, Broxbourne for sale or to rent.
| Streets | Postcodes |
|---|---|
| Alamein Close | EN10 7TF |
| Alexis Row High Road | EN10 7FJ |
| Allard Way | EN10 7ER |
| Anderson Close | EN10 7FN |
| Ashbourne Road | EN10 7DF EN10 7DG |
| Baas Hill | EN10 7EP EN10 7ES EN10 7ET EN10 7PX |
| Baas Hill Close | EN10 7EU |
| Baas Lane | EN10 7EE EN10 7EH EN10 7EJ EN10 7EL |
| Badgers Walk | EN10 7FU EN10 7FW EN10 7FX |
| Badgerscroft | EN10 7ED |
| Badminton Place | EN10 7PA |
| Bassing Bourne Close | EN10 7PW |
| Bell Lane | EN10 7EX EN10 7HA EN10 7HE EN10 7HG EN10 7HH EN10 7HD |
| Beverley Close | EN10 7HF |
| Boleyn Court | EN10 7HJ |
| Borrell Close | EN10 7RD |
| Bourne Close | EN10 7NE |
| Broxbournebury Mews | EN10 7JA |
| Bucklers Close | EN10 6PQ |
| Caldecot Way | EN10 6PH |
| Carnaby Road | EN10 7EF EN10 7EG EN10 7EQ |
| Cedar House Mews | EN10 7PP |
| Chindit Close | EN10 7TL |
| Christie Close | EN10 7RB |
| Church Court | EN10 7JR |
| Church View | EN10 7AB |
| Churchfields | EN10 7JP EN10 7JS EN10 7JU EN10 7JX |
| Churchfields Lane | EN10 7JW |
| Copthorn Avenue | EN10 7RA |
| Courtfield Close | EN10 7HS |
| Cozens Lane West | EN10 6QG |
| Crabtree Walk | EN10 7NH EN10 7NN |
| Eaton Gardens | EN10 6SA |
| Forest Grove | EN10 7FT |
| Friarscroft | EN10 7JZ |
| Glenwood | EN10 7LP |
| Gold Close | EN10 7TJ |
| Graham Avenue | EN10 7DN EN10 7DP EN10 7DS EN10 7DU |
| Grenville Avenue | EN10 7DH |
| Grosvenor Road | EN10 7JG |
| Harmonds Wood Close | EN10 7FE |
| Hickman Close | EN10 7TD |
| High Road | EN10 7BB EN10 7BL EN10 7BN EN10 7BS EN10 7BT EN10 7BW EN10 7BX EN10 7DE EN10 7DQ EN10 7DZ EN10 7HP EN10 7HU EN10 7HX EN10 7LU EN10 7LY EN10 7ND EN10 7NF EN10 6QW EN10 7DB EN10 7DD |
| Highfield Drive | EN10 7EY |
| Hipkins Place | EN10 7EW |
| Ivybridge | EN10 7LH |
| Kingfisher Close | EN10 7FG |
| Lansdowne Court | EN10 7JE |
| Lanthorn Close | EN10 7NR |
| Long Grove Close | EN10 7NP |
| Mandeville Close | EN10 7PN |
| Mckenzie Road | EN10 7JF EN10 7JH EN10 7JQ |
| Mill Lane | EN10 7AX EN10 7AZ EN10 7AY EN10 7BQ |
| Mill Lane Close | EN10 7BG EN10 7BA |
| Monks Close | EN10 7JY |
| Monson Road | EN10 7DY |
| New Road | EN10 7LN EN10 7LW EN10 7NL |
| Norris Grove | EN10 7PL |
| Old Nazeing Road | EN10 6LX |
| Osborne Road | EN10 7LJ |
| Overlord Close | EN10 7TG |
| Park Lane | EN10 7NG EN10 7NQ EN10 7PG EN10 7PH EN10 7PJ EN10 7PQ EN10 7PS |
| Parkwood Close | EN10 7PF |
| Priest Osiers | EN10 7FD |
| Pulham Avenue | EN10 7TA EN10 7TB |
| Ramsay Close | EN10 7DR |
| Ravenscroft | EN10 7QD |
| Roslyn Close | EN10 7DA |
| Royce Close | EN10 7DW |
| Salwey Crescent | EN10 7NJ |
| Sandbach Close | EN10 7FP |
| Sawells | EN10 7HQ |
| Scholars Avenue | EN10 7FR |
| Sheriden Walk | EN10 7TH |
| Somerby Close | EN10 7AE |
| Springfields | EN10 7LX |
| St Annes Park | EN10 7LA |
| St Augustines Close | EN10 7NB |
| St Augustines Drive | EN10 7LZ EN10 7NA |
| St Catharines Road | EN10 7LQ |
| St Catherines Road | EN10 7LB EN10 7LD EN10 7LE EN10 7LF EN10 7LG EN10 7LL |
| St Davids Drive | EN10 7LS EN10 7LT |
| St Michaels Road | EN10 7JL EN10 7JN |
| Stafford Drive | EN10 7JT EN10 7NW |
| Station Road | EN10 7AA EN10 7AD EN10 7AG EN10 7AH EN10 7AL EN10 7AN EN10 7AS EN10 7AT EN10 7QU EN10 7QW EN10 7QX EN10 7AW |
| Stratfield Drive | EN10 7NU |
| Sutton Close | EN10 7NY |
| Sword Close | EN10 7TE |
| The Lawns Drive | EN10 7BU |
| The Mews | EN10 7GZ |
| The Orchard | EN10 7JJ |
| The Paddock | EN10 7AJ |
| The Precinct | EN10 7HY |
| The Rowans | EN10 7RP |
| The Spinney | EN10 7LR |
| Thunderfield Close | EN10 7FB |
| Trafalgar Avenue | EN10 7DJ EN10 7DL EN10 7DX |
| Tudor Rise | EN10 7HB |
| White Stubbs Lane | EN10 7PZ EN10 7PY |
| Willoughby Close | EN10 7EZ |
| Winford Drive | EN10 6PB EN10 6PJ EN10 6PL EN10 6PN EN10 6PP EN10 6PW |
| Woodstock Road | EN10 7NS EN10 7NT EN10 7NX EN10 7NZ EN10 7PB EN10 7PD EN10 7PE |
| EN10 7AU |
Transport near Broxbourne And Hoddesdon South
- FAQ
- Price Paid By Year
- Property Type Price
Frequently asked questions about Broxbourne And Hoddesdon South
What is the average price for a property for sale in Broxbourne And Hoddesdon South?
The average price for a property for sale in Broxbourne And Hoddesdon South is £662,224. This amount is 37% higher than the average price in Broxbourne. There are 1,363 property listings for sale in Broxbourne And Hoddesdon South.
What streets have the most expensive properties for sale in Broxbourne And Hoddesdon South?
The streets with the most expensive properties for sale in Broxbourne And Hoddesdon South are Carnaby Road at an average of £2,658,225, Baas Lane at an average of £1,357,500 and Bassing Bourne Close at an average of £1,292,500.
What streets have the most affordable properties for sale in Broxbourne And Hoddesdon South?
The streets with the most affordable properties for sale in Broxbourne And Hoddesdon South are The Lawns Drive at an average of £122,437, Ravenscroft at an average of £231,900 and Cedar House Mews at an average of £262,500.
Which train stations are available in or near Broxbourne And Hoddesdon South?
Some of the train stations available in or near Broxbourne And Hoddesdon South are Broxbourne and Rye House.
Property Price Paid in Broxbourne And Hoddesdon South by Year
The average sold property price by year was:
| Year | Average Sold Price | Price Change |
Sold Properties
|
|---|---|---|---|
| 2025 | £692,883 | 16% |
59 Properties |
| 2024 | £579,984 | -19% |
81 Properties |
| 2023 | £692,207 | -1% |
76 Properties |
| 2022 | £697,971 | 11% |
72 Properties |
| 2021 | £623,419 | -0,1% |
120 Properties |
| 2020 | £624,195 | 7% |
88 Properties |
| 2019 | £580,786 | 5% |
88 Properties |
| 2018 | £551,436 | 13% |
90 Properties |
| 2017 | £478,100 | -26% |
111 Properties |
| 2016 | £600,337 | 11% |
105 Properties |
| 2015 | £536,097 | 16% |
106 Properties |
| 2014 | £452,120 | 1% |
123 Properties |
| 2013 | £447,945 | 8% |
102 Properties |
| 2012 | £410,325 | 2% |
101 Properties |
| 2011 | £401,715 | -1% |
95 Properties |
| 2010 | £404,522 | 4% |
122 Properties |
| 2009 | £387,274 | -7% |
120 Properties |
| 2008 | £414,615 | 15% |
95 Properties |
| 2007 | £352,099 | 5% |
121 Properties |
| 2006 | £335,927 | -4% |
144 Properties |
| 2005 | £348,404 | 6% |
129 Properties |
| 2004 | £326,352 | 12% |
119 Properties |
| 2003 | £287,312 | -3% |
111 Properties |
| 2002 | £295,530 | 16% |
159 Properties |
| 2001 | £249,448 | 11% |
221 Properties |
| 2000 | £221,699 | 28% |
118 Properties |
| 1999 | £160,155 | -18% |
155 Properties |
| 1998 | £188,507 | 7% |
139 Properties |
| 1997 | £174,486 | 20% |
211 Properties |
| 1996 | £139,755 | -8% |
162 Properties |
| 1995 | £151,231 | - |
104 Properties |
Property Price per Property Type in Broxbourne And Hoddesdon South
Here you can find historic sold price data in order to help with your property search.
The average Property Paid Price for specific property types in the last three years are:
| Property Type | Average Sold Price | Sold Properties |
|---|---|---|
| Flat | £259,299.00 | 70 Flats |
| Semi Detached House | £658,190.00 | 75 Semi Detached Houses |
| Detached House | £1,010,345.00 | 104 Detached Houses |
| Terraced House | £464,858.00 | 39 Terraced Houses |

