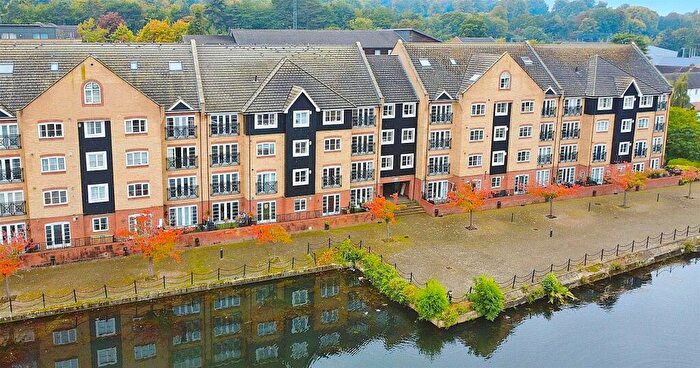
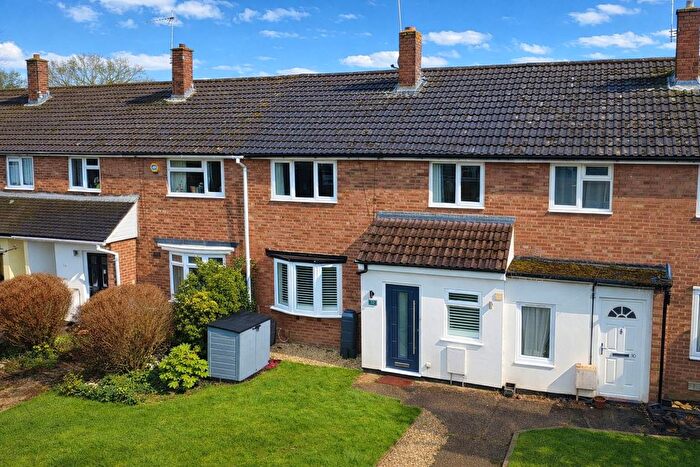
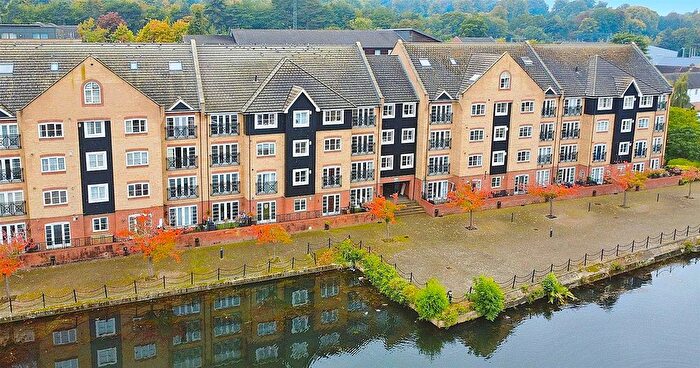
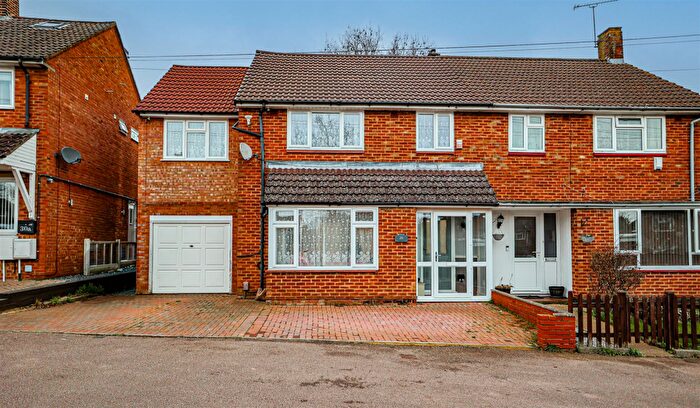
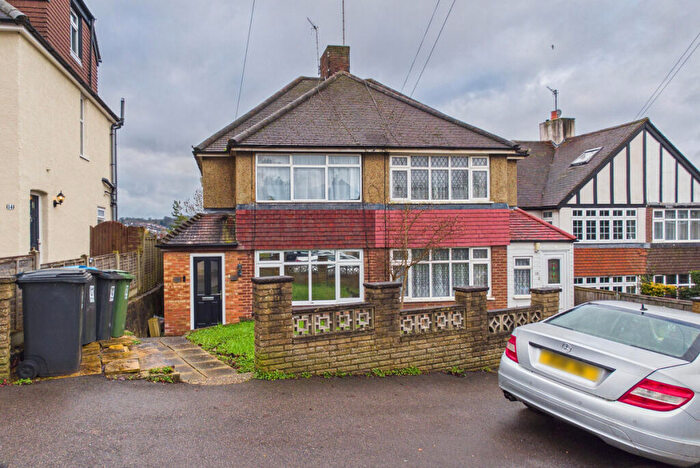
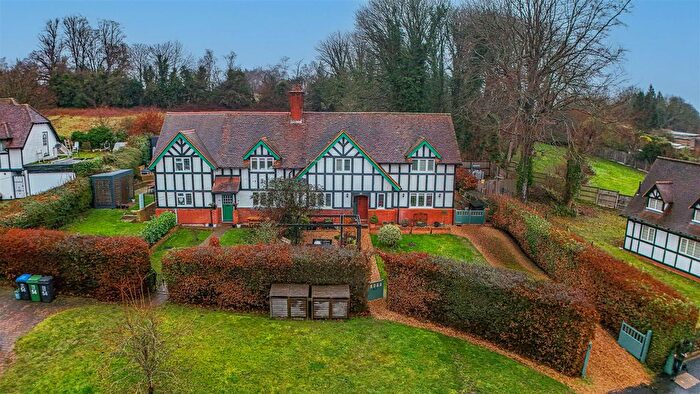
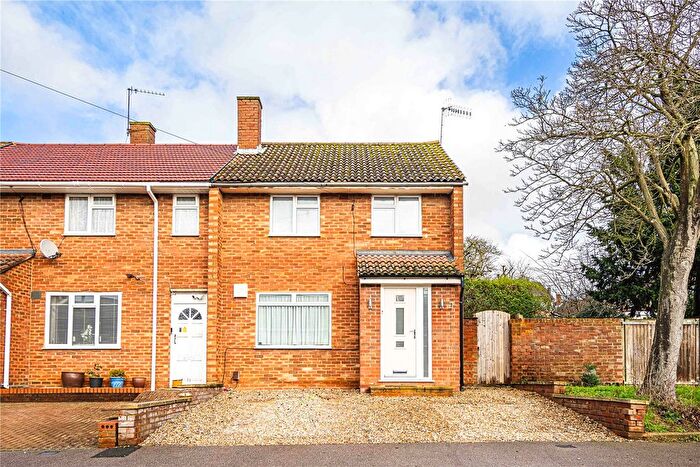
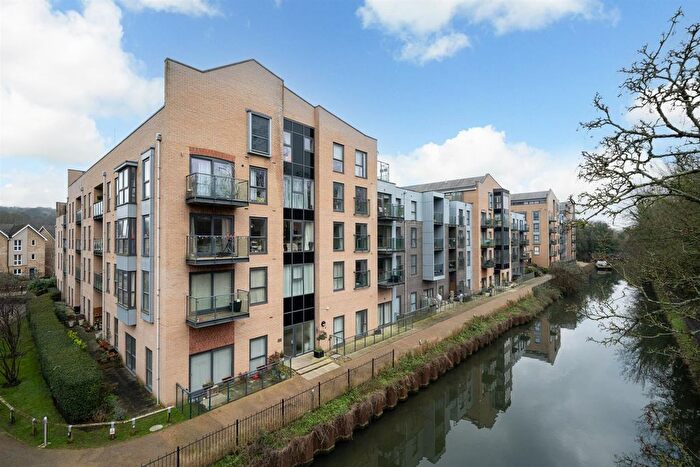
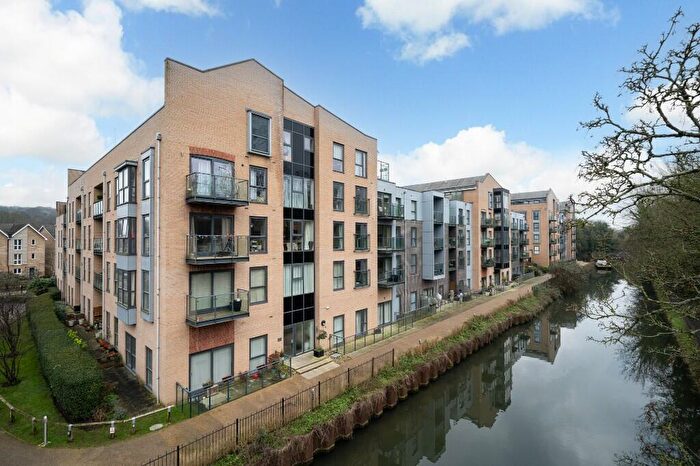
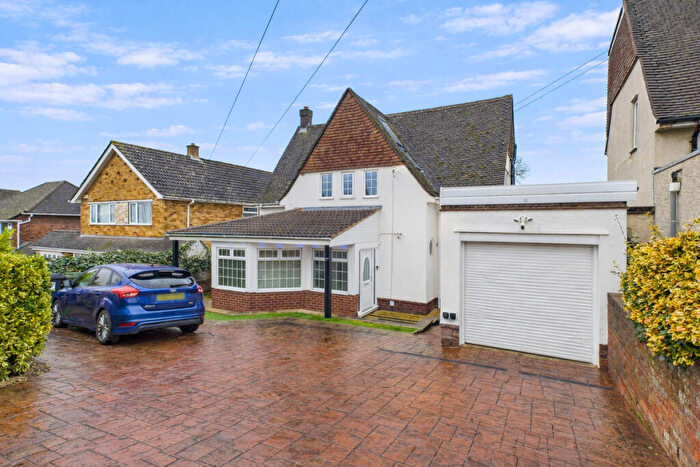
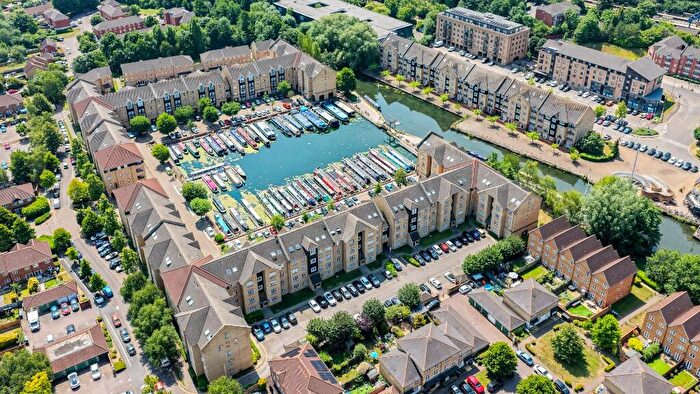
Houses for sale & to rent in Nash Mills, Hemel Hempstead
House Prices in Nash Mills
Properties in Nash Mills have an average house price of £399,256.00 and had 182 Property Transactions within the last 3 years¹.
Nash Mills is an area in Hemel Hempstead, Hertfordshire with 1,150 households², where the most expensive property was sold for £1,325,000.00.
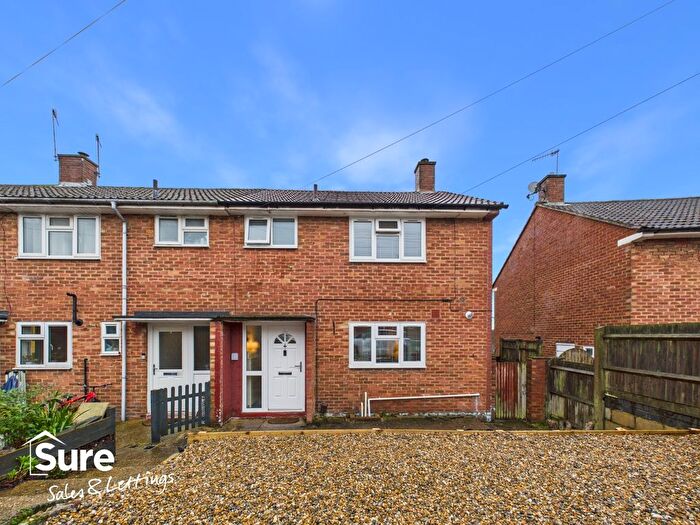
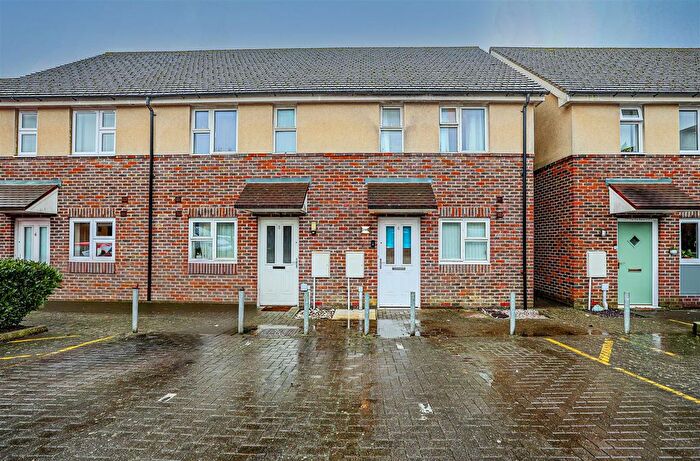
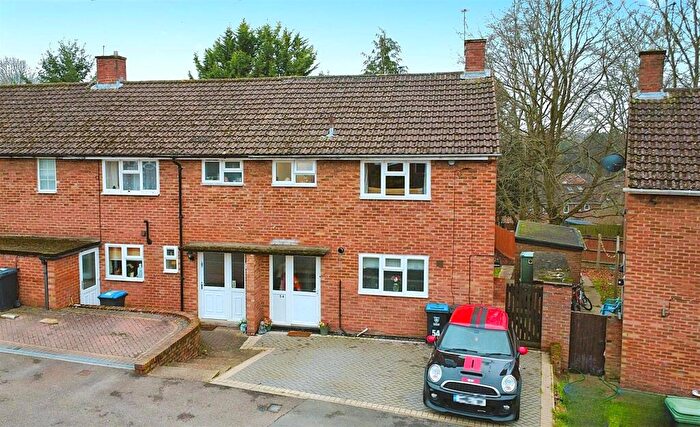
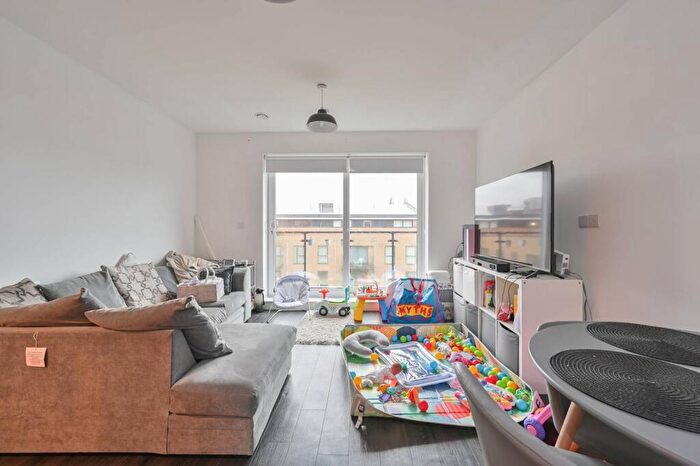
Properties for sale in Nash Mills
Roads and Postcodes in Nash Mills
Navigate through our locations to find the location of your next house in Nash Mills, Hemel Hempstead for sale or to rent.
| Streets | Postcodes |
|---|---|
| Abbots Hill | HP3 8RS |
| Barnacres Road | HP3 8AR HP3 8JP HP3 8JR HP3 8JS HP3 8BW |
| Belswains Lane | HP3 9UZ HP3 9XA HP3 9XB HP3 9XE |
| Bittern Close | HP3 9FF HP3 9FG HP3 9FQ |
| Bond Close | HP3 9XU |
| Bunkers Farm Cottages | HP3 8SW |
| Bunkers Lane | HP3 8AX HP3 8RP HP3 8RW HP3 8SP |
| Butterfly Crescent | HP3 9GS |
| Chaffinches Green | HP3 8JW |
| Chambersbury Lane | HP3 8AY HP3 8AZ HP3 8BB HP3 8BD HP3 8BE HP3 8BH HP3 8BQ |
| Croxley Road | HP3 9GU HP3 9GX HP3 9GY |
| Dickinson Square | HP3 9GT |
| East Green | HP3 8AB |
| Frances Mews | HP3 9GR |
| Georgewood Road | HP3 8AL HP3 8AN |
| Great Elms Road | HP3 9TJ |
| Heron Close | HP3 9SU |
| Highbarns | HP3 8AF HP3 8AG HP3 8AQ |
| Highclere Drive | HP3 8BT HP3 8BY |
| Hill Common | HP3 8JJ |
| Kingfisher Drive | HP3 9DD |
| Linsey Close | HP3 8DA |
| Longdean Park | HP3 8BS HP3 8BZ |
| Market Oak Lane | HP3 8JL HP3 8JN |
| Meadow Road | HP3 8AH HP3 8AJ |
| Mill Close | HP3 8AD |
| Nash Green | HP3 8AA HP3 8AE |
| Osprey Close | HP3 9SS |
| Pinecroft | HP3 8AW |
| Pond Road | HP3 8BA |
| Rose Lane | HP3 9BP HP3 9GB HP3 9GJ HP3 9GL |
| Silverthorn Drive | HP3 8BU HP3 8BX |
| Swan Mead | HP3 9DG HP3 9DQ |
| Teal Way | HP3 9FE |
| The Barns | HP3 8DB |
| The Denes | HP3 8AP |
| The Embankment | HP3 9DR HP3 9DH HP3 9FX HP3 9FY HP3 9GA HP3 9GD HP3 9GH |
| The Leas | HP3 8BP |
| The Mallards | HP3 9DP |
| Woodfield Drive | HP3 8LN |
| Woodfield Gardens | HP3 8LZ |
Transport near Nash Mills
- FAQ
- Price Paid By Year
- Property Type Price
Frequently asked questions about Nash Mills
What is the average price for a property for sale in Nash Mills?
The average price for a property for sale in Nash Mills is £399,256. This amount is 8% lower than the average price in Hemel Hempstead. There are 1,250 property listings for sale in Nash Mills.
What streets have the most expensive properties for sale in Nash Mills?
The streets with the most expensive properties for sale in Nash Mills are Longdean Park at an average of £1,262,500, Silverthorn Drive at an average of £1,151,250 and Woodfield Drive at an average of £862,500.
What streets have the most affordable properties for sale in Nash Mills?
The streets with the most affordable properties for sale in Nash Mills are Croxley Road at an average of £192,500, Rose Lane at an average of £264,184 and The Embankment at an average of £291,418.
Which train stations are available in or near Nash Mills?
Some of the train stations available in or near Nash Mills are Apsley, Hemel Hempstead and King's Langley.
Property Price Paid in Nash Mills by Year
The average sold property price by year was:
| Year | Average Sold Price | Price Change |
Sold Properties
|
|---|---|---|---|
| 2025 | £381,676 | -5% |
51 Properties |
| 2024 | £399,939 | -3% |
73 Properties |
| 2023 | £413,853 | -6% |
58 Properties |
| 2022 | £440,268 | -7% |
55 Properties |
| 2021 | £469,020 | 16% |
90 Properties |
| 2020 | £393,211 | 9% |
60 Properties |
| 2019 | £359,240 | -4% |
79 Properties |
| 2018 | £374,428 | 2% |
63 Properties |
| 2017 | £366,404 | 12% |
100 Properties |
| 2016 | £321,461 | 7% |
175 Properties |
| 2015 | £299,318 | 0,4% |
132 Properties |
| 2014 | £298,127 | 0,3% |
106 Properties |
| 2013 | £297,184 | -12% |
72 Properties |
| 2012 | £333,935 | 6% |
71 Properties |
| 2011 | £313,309 | 8% |
58 Properties |
| 2010 | £287,895 | -1% |
34 Properties |
| 2009 | £291,124 | 6% |
25 Properties |
| 2008 | £272,243 | -18% |
37 Properties |
| 2007 | £321,879 | 21% |
69 Properties |
| 2006 | £253,192 | -8% |
57 Properties |
| 2005 | £272,584 | 20% |
50 Properties |
| 2004 | £219,371 | -15% |
45 Properties |
| 2003 | £251,692 | 20% |
41 Properties |
| 2002 | £200,431 | 8% |
56 Properties |
| 2001 | £185,256 | 9% |
71 Properties |
| 2000 | £168,375 | 11% |
55 Properties |
| 1999 | £149,104 | 15% |
52 Properties |
| 1998 | £126,255 | 3% |
44 Properties |
| 1997 | £122,206 | 22% |
113 Properties |
| 1996 | £95,845 | -21% |
58 Properties |
| 1995 | £116,384 | - |
31 Properties |
Property Price per Property Type in Nash Mills
Here you can find historic sold price data in order to help with your property search.
The average Property Paid Price for specific property types in the last three years are:
| Property Type | Average Sold Price | Sold Properties |
|---|---|---|
| Semi Detached House | £477,725.00 | 16 Semi Detached Houses |
| Detached House | £750,875.00 | 28 Detached Houses |
| Terraced House | £393,760.00 | 46 Terraced Houses |
| Flat | £281,342.00 | 92 Flats |

