
Houses for sale & to rent in Potters Bar Oakmere, Potters Bar
House Prices in Potters Bar Oakmere
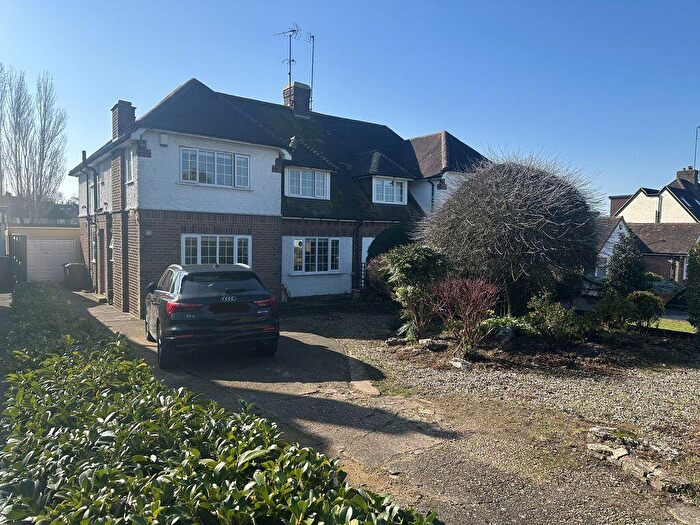
Properties in Potters Bar Oakmere have an average house price of £484k and had 249 Property Transactions within the last 3 years¹.
Potters Bar Oakmere is an area in Potters Bar, Hertfordshire with 2,990 households², where the most expensive property was sold for £1.4M.
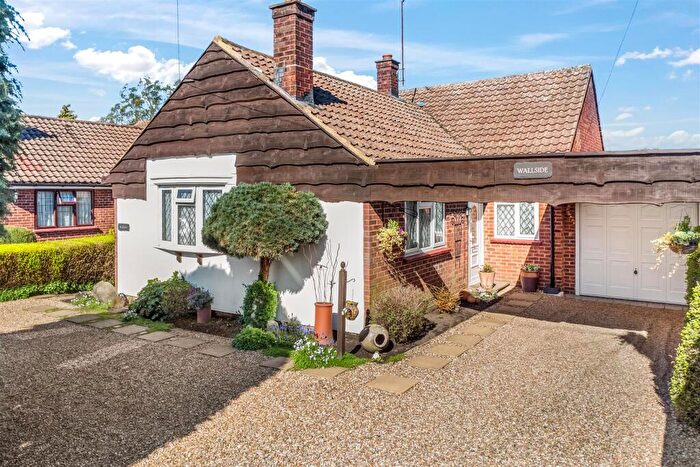
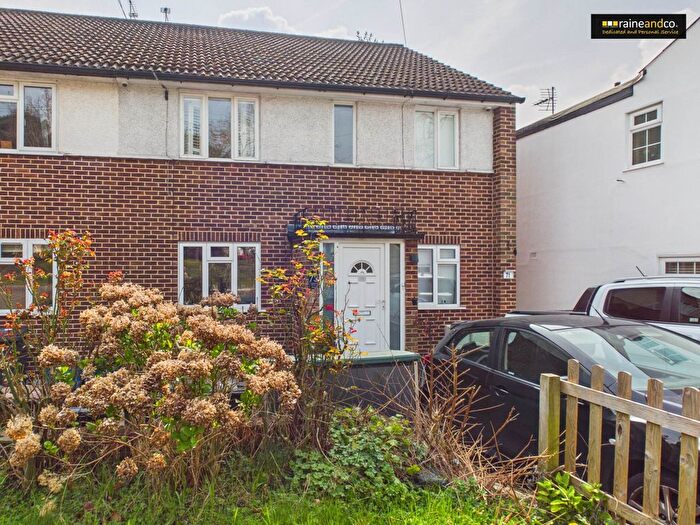
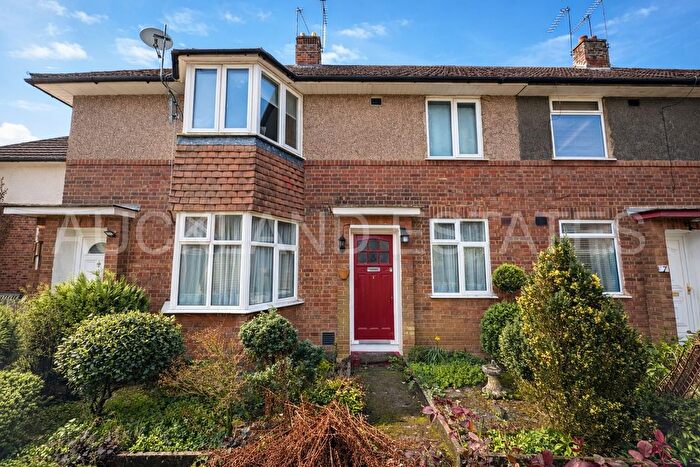
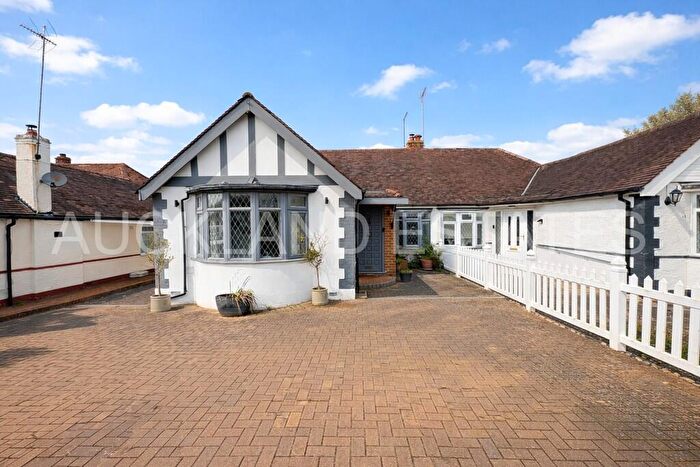
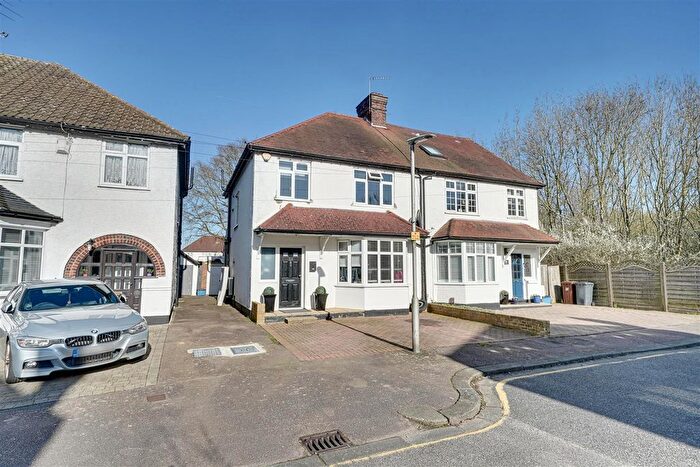
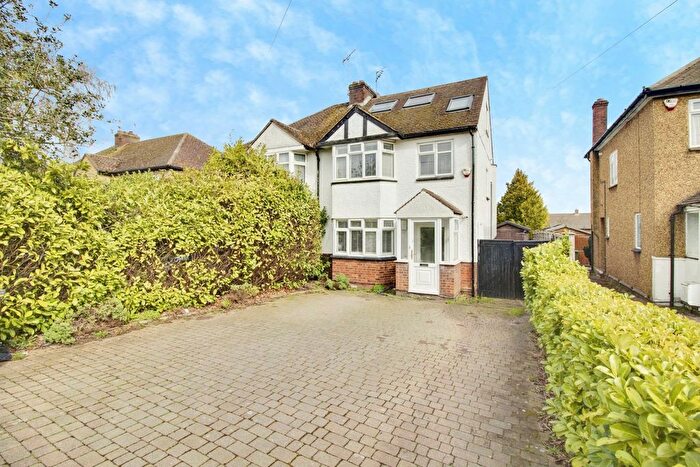
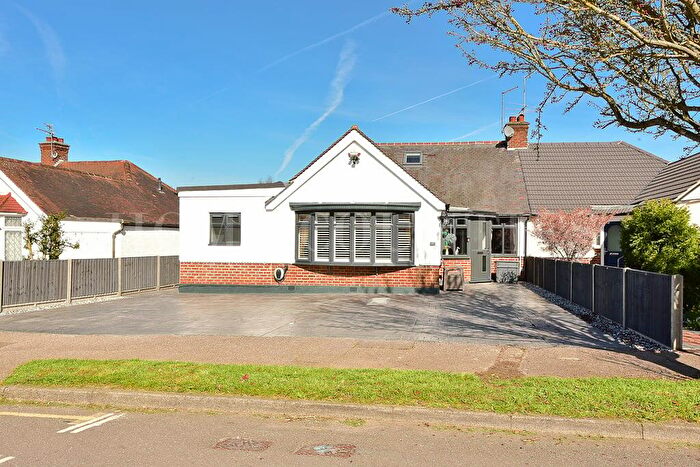
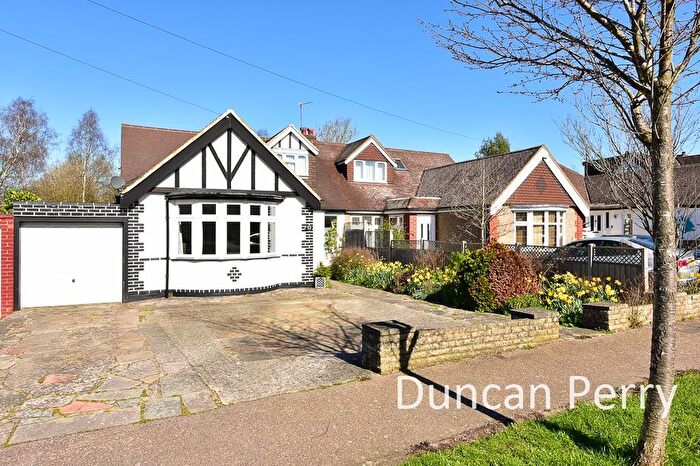
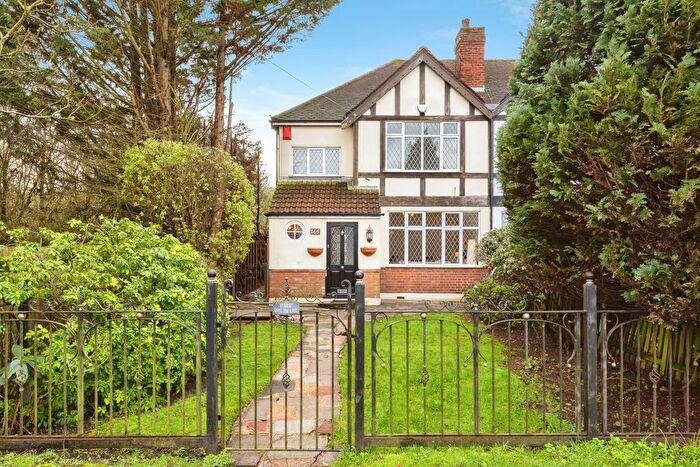
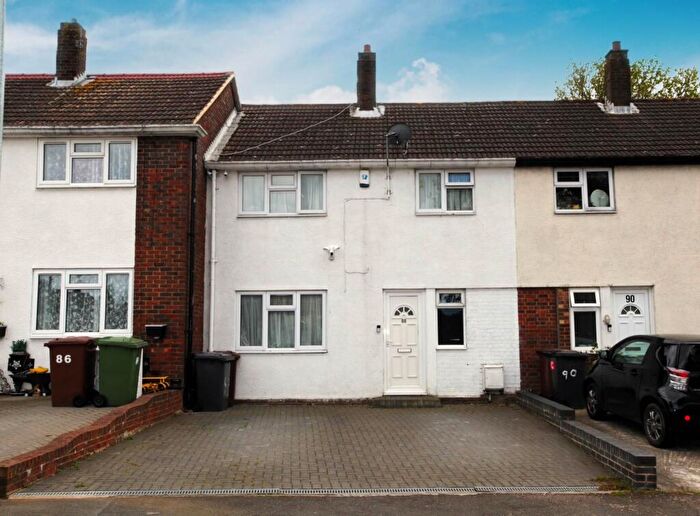
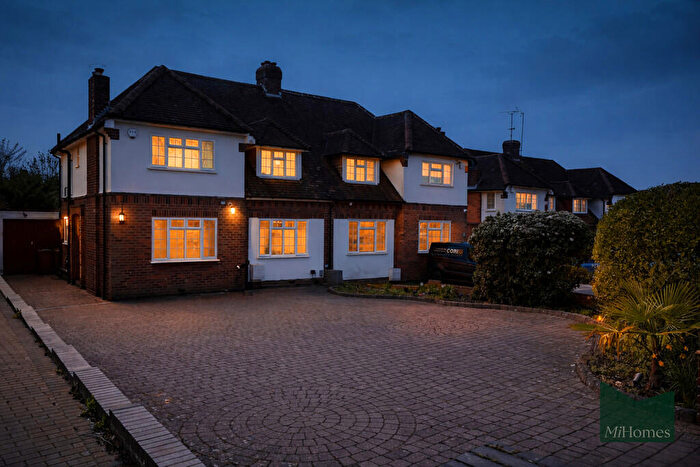
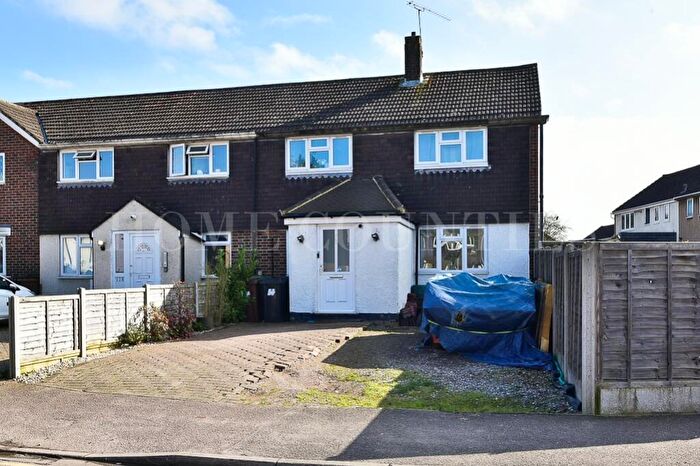
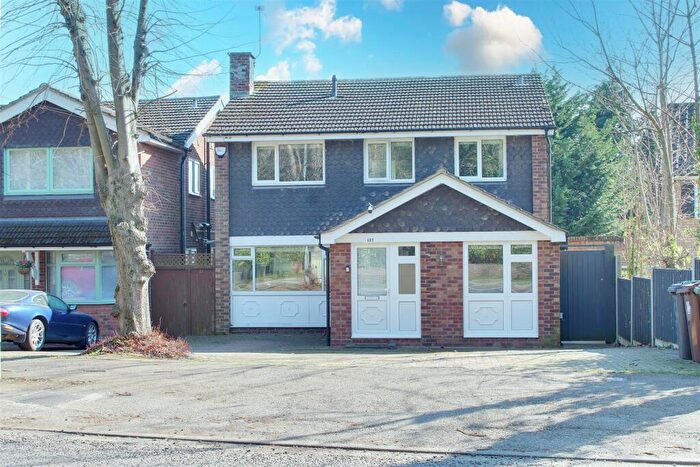
Properties for sale in Potters Bar Oakmere
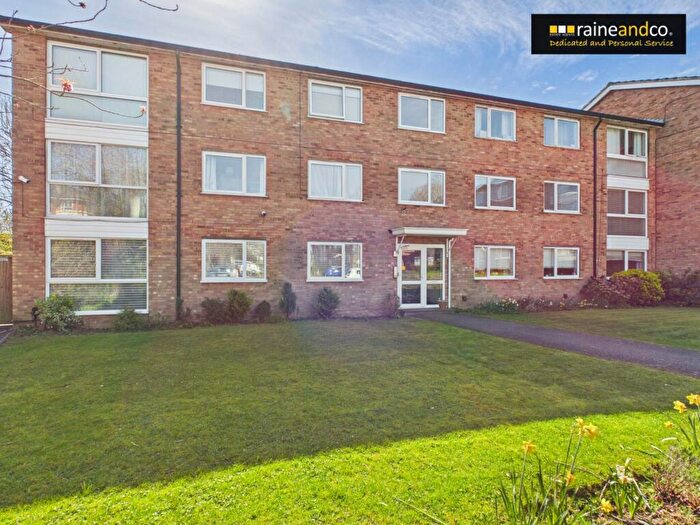
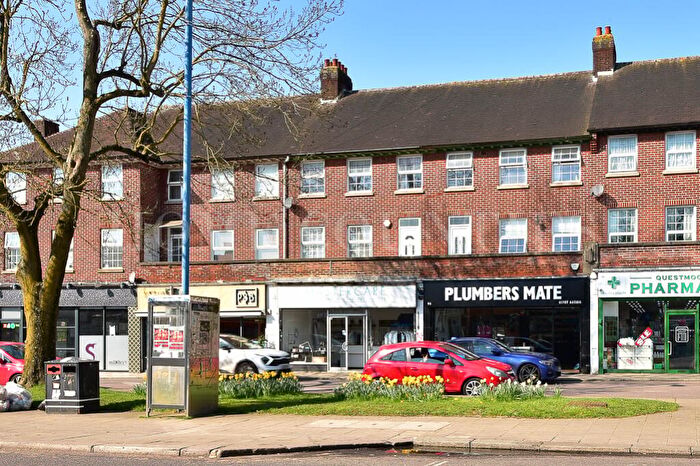
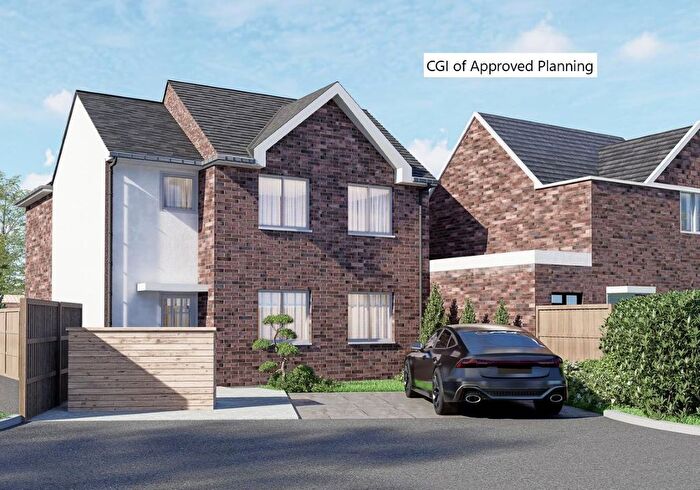
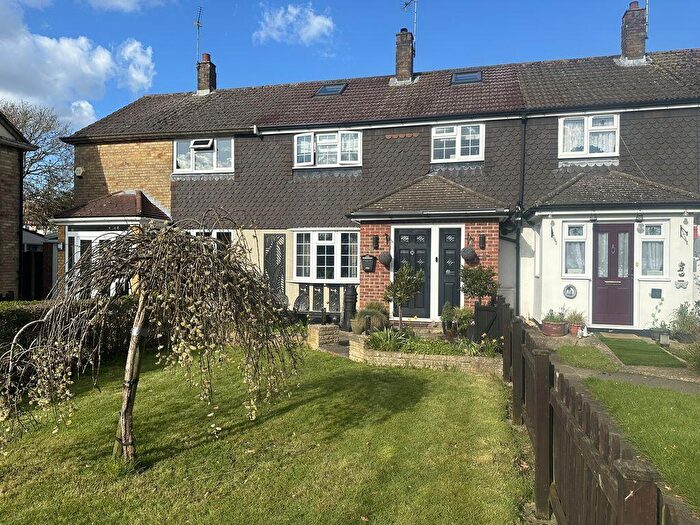
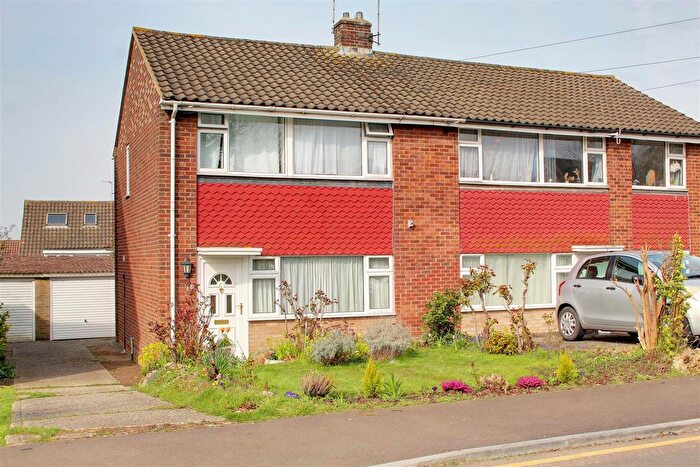
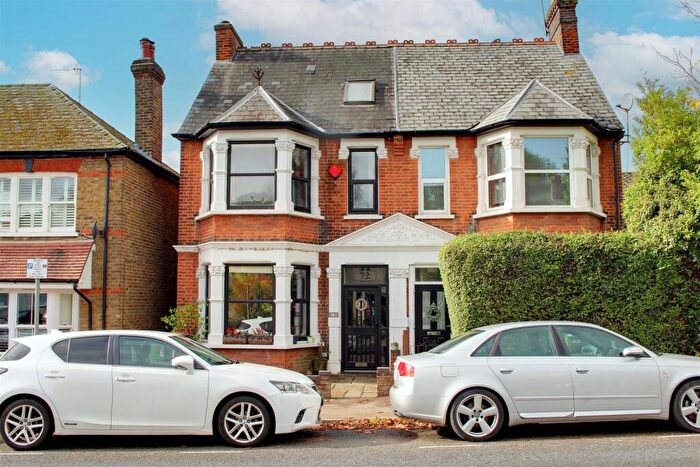
![]()
If you are looking to sell your house, let it out, or receive a property valuation, an expert can help you.
Click the button below to get started.


Roads and Postcodes in Potters Bar Oakmere
Navigate through our locations to find the location of your next house in Potters Bar Oakmere, Potters Bar for sale or to rent.
Transport near Potters Bar Oakmere

- FAQ
- Price Paid By Year
- Property Type Price
Frequently asked questions about Potters Bar Oakmere
What is the average price for a property for sale in Potters Bar Oakmere?
The average price for a property for sale in Potters Bar Oakmere is £483,987. This amount is 24% lower than the average price in Potters Bar. There are 1,341 property listings for sale in Potters Bar Oakmere.
What streets have the most expensive properties for sale in Potters Bar Oakmere?
The streets with the most expensive properties for sale in Potters Bar Oakmere are Oakmere Lane at an average of £798,750, Hill Crest at an average of £695,000 and Oakmere Close at an average of £666,485.
What streets have the most affordable properties for sale in Potters Bar Oakmere?
The streets with the most affordable properties for sale in Potters Bar Oakmere are Wayside at an average of £172,125, Highview Close at an average of £212,500 and The Grove at an average of £219,833.
Which train stations are available in or near Potters Bar Oakmere?
Some of the train stations available in or near Potters Bar Oakmere are Potters Bar, Hadley Wood and Brookman's Park.
Property Price Paid in Potters Bar Oakmere by Year
The average sold property price by year was:
| Year | Average Sold Price | Price Change |
Sold Properties
|
|---|---|---|---|
| 2026 | £678,316 | 32% |
3 Properties |
| 2025 | £461,540 | -4% |
104 Properties |
| 2024 | £482,084 | -6% |
75 Properties |
| 2023 | £512,261 | 2% |
67 Properties |
| 2022 | £502,426 | -4% |
94 Properties |
| 2021 | £523,393 | 16% |
124 Properties |
| 2020 | £438,420 | -1% |
86 Properties |
| 2019 | £441,524 | 0,1% |
70 Properties |
| 2018 | £440,941 | 3% |
80 Properties |
| 2017 | £427,243 | 9% |
93 Properties |
| 2016 | £390,288 | 3% |
112 Properties |
| 2015 | £379,736 | 12% |
133 Properties |
| 2014 | £334,415 | 14% |
123 Properties |
| 2013 | £288,590 | 3% |
83 Properties |
| 2012 | £280,889 | 8% |
75 Properties |
| 2011 | £259,259 | -7% |
59 Properties |
| 2010 | £277,164 | 22% |
89 Properties |
| 2009 | £216,670 | -19% |
65 Properties |
| 2008 | £257,336 | -7% |
55 Properties |
| 2007 | £274,476 | 11% |
180 Properties |
| 2006 | £244,502 | 14% |
139 Properties |
| 2005 | £210,557 | -9% |
97 Properties |
| 2004 | £229,435 | 6% |
124 Properties |
| 2003 | £215,830 | 6% |
118 Properties |
| 2002 | £203,199 | 21% |
139 Properties |
| 2001 | £161,456 | 11% |
133 Properties |
| 2000 | £143,258 | 6% |
136 Properties |
| 1999 | £134,159 | 21% |
136 Properties |
| 1998 | £106,607 | 17% |
126 Properties |
| 1997 | £88,491 | 9% |
113 Properties |
| 1996 | £80,788 | 0,3% |
129 Properties |
| 1995 | £80,529 | - |
106 Properties |
Property Price per Property Type in Potters Bar Oakmere
Here you can find historic sold price data in order to help with your property search.
The average Property Paid Price for specific property types in the last three years are:
| Property Type | Average Sold Price | Sold Properties |
|---|---|---|
| Flat | £268,485.00 | 49 Flats |
| Semi Detached House | £562,874.00 | 103 Semi Detached Houses |
| Detached House | £764,887.00 | 20 Detached Houses |
| Terraced House | £442,641.00 | 77 Terraced Houses |