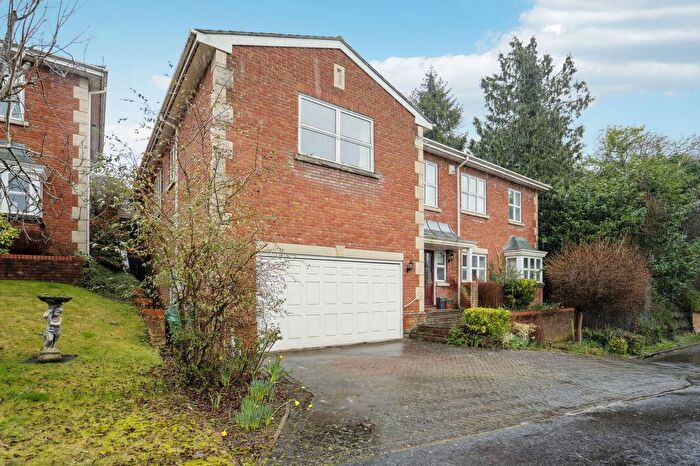
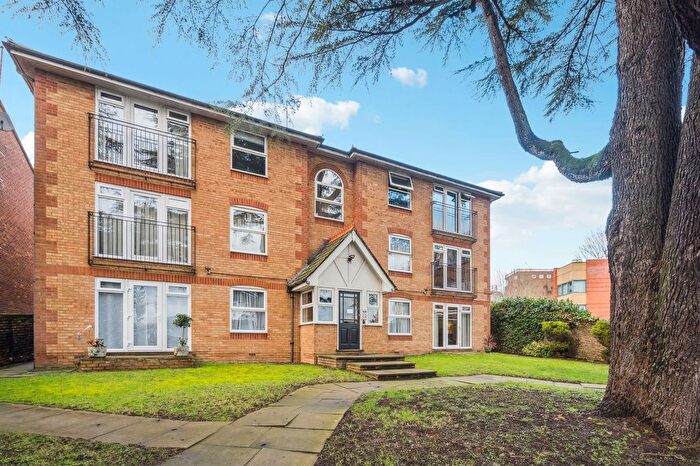
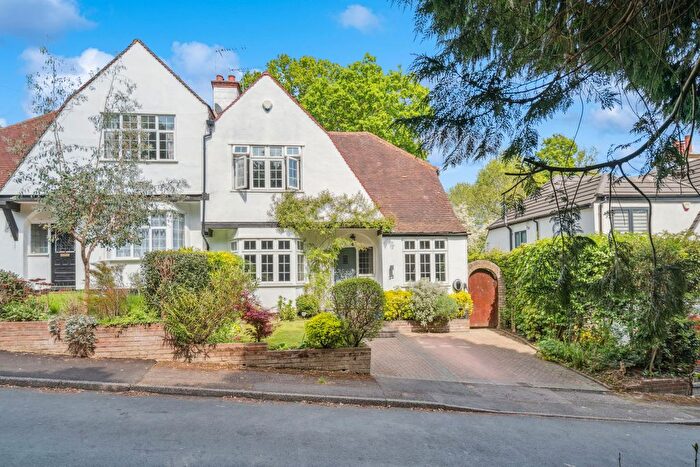
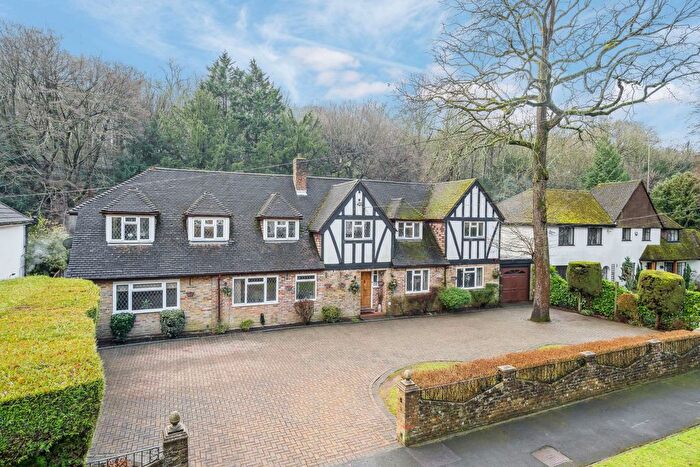
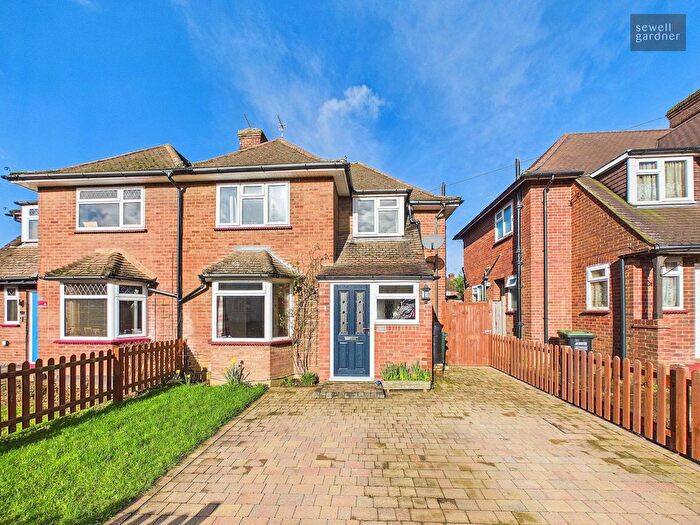
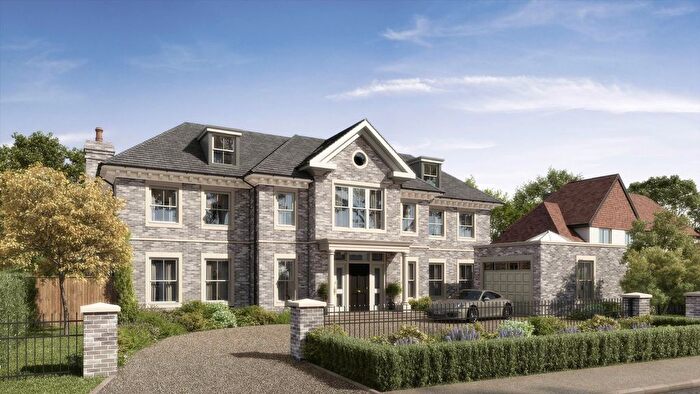
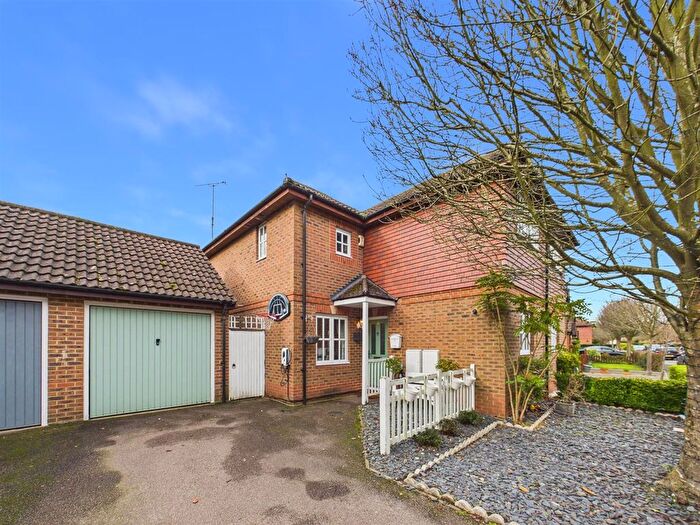
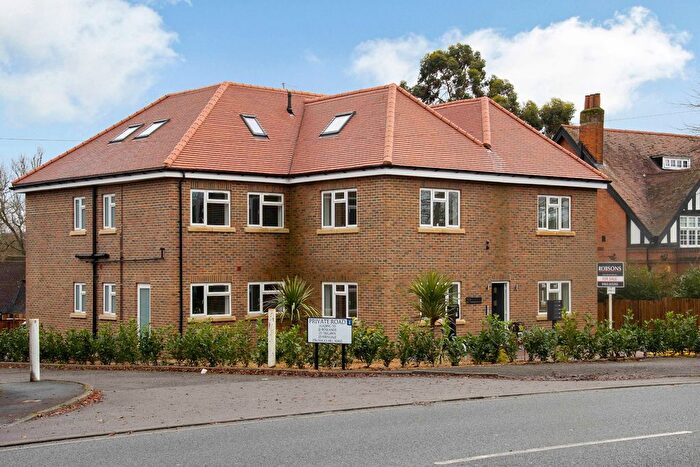
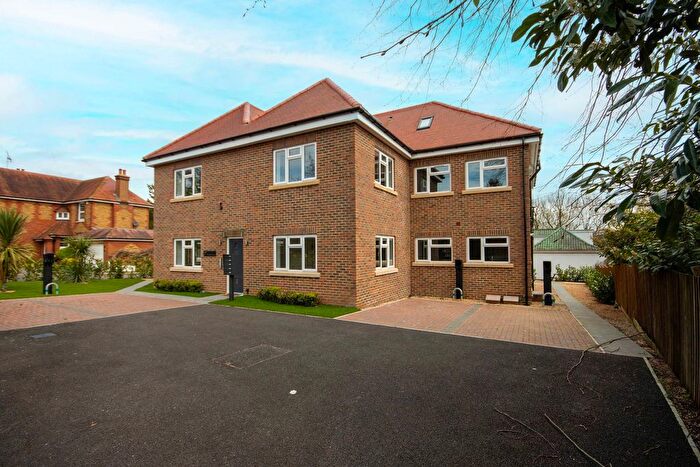
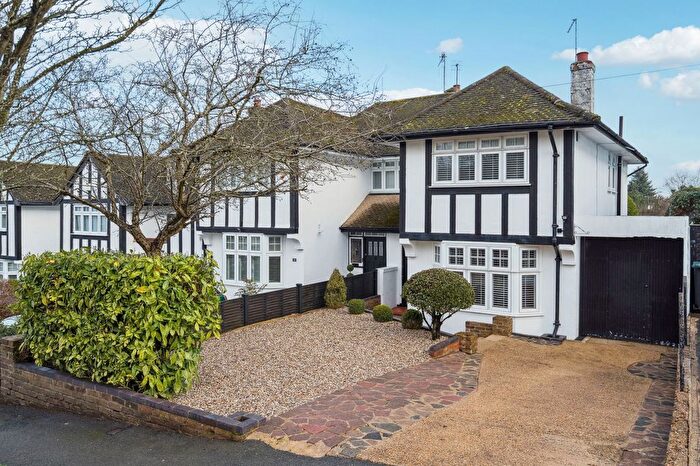
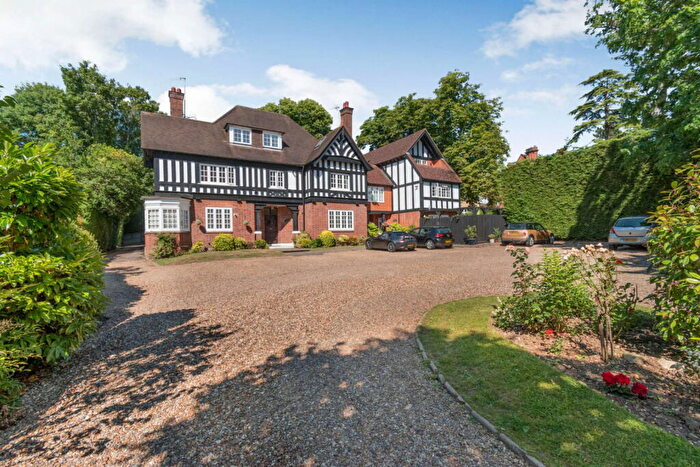
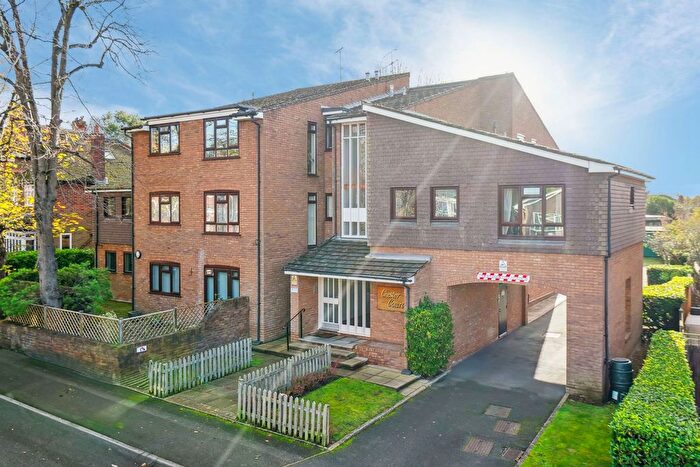
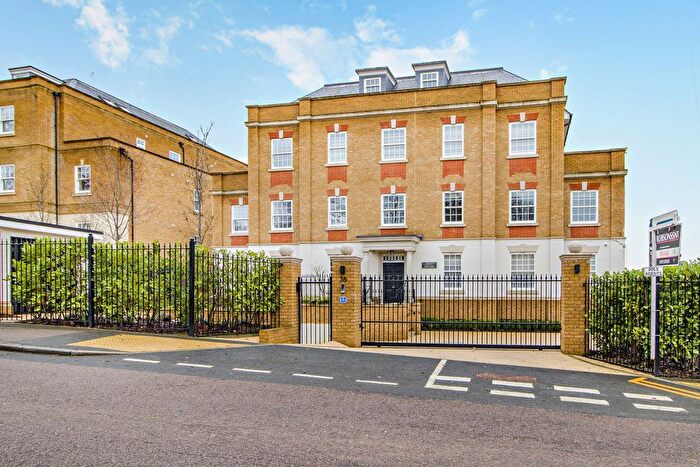
Houses for sale & to rent in Rickmansworth, Hertfordshire
House Prices in Rickmansworth
Properties in Rickmansworth have an average house price of £724,324.00 and had 1,454 Property Transactions within the last 3 years.¹
Rickmansworth is an area in Hertfordshire with 16,236 households², where the most expensive property was sold for £4,600,000.00.
Properties for sale in Rickmansworth
Neighbourhoods in Rickmansworth
Navigate through our locations to find the location of your next house in Rickmansworth, Hertfordshire for sale or to rent.
Transport in Rickmansworth
Please see below transportation links in this area:
- FAQ
- Price Paid By Year
- Property Type Price
Frequently asked questions about Rickmansworth
What is the average price for a property for sale in Rickmansworth?
The average price for a property for sale in Rickmansworth is £724,324. This amount is 36% higher than the average price in Hertfordshire. There are more than 10,000 property listings for sale in Rickmansworth.
What locations have the most expensive properties for sale in Rickmansworth?
The locations with the most expensive properties for sale in Rickmansworth are Moor Park And Eastbury at an average of £1,682,500, Chorleywood North And Sarratt at an average of £1,084,248 and Chorleywood South And Maple Cross at an average of £821,696.
What locations have the most affordable properties for sale in Rickmansworth?
The locations with the most affordable properties for sale in Rickmansworth are Chorleywood South & Maple Cross at an average of £519,250, Penn And Mill End at an average of £528,880 and Rickmansworth Town at an average of £633,004.
Which train stations are available in or near Rickmansworth?
Some of the train stations available in or near Rickmansworth are Rickmansworth and Chorleywood.
Which tube stations are available in or near Rickmansworth?
Some of the tube stations available in or near Rickmansworth are Rickmansworth, Chorleywood and Croxley.
Property Price Paid in Rickmansworth by Year
The average sold property price by year was:
| Year | Average Sold Price | Price Change |
Sold Properties
|
|---|---|---|---|
| 2025 | £693,466 | -6% |
456 Properties |
| 2024 | £736,597 | -1% |
536 Properties |
| 2023 | £740,542 | -5% |
462 Properties |
| 2022 | £780,730 | 10% |
586 Properties |
| 2021 | £700,123 | 1% |
766 Properties |
| 2020 | £693,017 | 13% |
514 Properties |
| 2019 | £602,540 | -9% |
654 Properties |
| 2018 | £657,379 | 2% |
555 Properties |
| 2017 | £646,219 | 11% |
583 Properties |
| 2016 | £573,898 | 2% |
671 Properties |
| 2015 | £564,216 | 7% |
715 Properties |
| 2014 | £523,707 | 9% |
715 Properties |
| 2013 | £478,258 | 4% |
723 Properties |
| 2012 | £458,091 | 9% |
674 Properties |
| 2011 | £417,564 | -5% |
654 Properties |
| 2010 | £438,555 | 9% |
612 Properties |
| 2009 | £399,946 | -8% |
569 Properties |
| 2008 | £430,247 | 4% |
452 Properties |
| 2007 | £412,515 | 11% |
1,014 Properties |
| 2006 | £367,283 | -2% |
1,018 Properties |
| 2005 | £373,092 | 8% |
731 Properties |
| 2004 | £343,222 | 10% |
816 Properties |
| 2003 | £308,085 | 10% |
786 Properties |
| 2002 | £277,143 | 14% |
1,022 Properties |
| 2001 | £239,381 | 5% |
961 Properties |
| 2000 | £227,763 | 21% |
823 Properties |
| 1999 | £178,988 | 4% |
1,020 Properties |
| 1998 | £171,632 | 16% |
841 Properties |
| 1997 | £144,575 | 12% |
1,033 Properties |
| 1996 | £126,927 | 3% |
931 Properties |
| 1995 | £122,965 | - |
678 Properties |
Property Price per Property Type in Rickmansworth
Here you can find historic sold price data in order to help with your property search.
The average Property Paid Price for specific property types in the last three years are:
| Property Type | Average Sold Price | Sold Properties |
|---|---|---|
| Semi Detached House | £675,938.00 | 503 Semi Detached Houses |
| Terraced House | £537,012.00 | 259 Terraced Houses |
| Detached House | £1,209,797.00 | 392 Detached Houses |
| Flat | £332,812.00 | 300 Flats |

