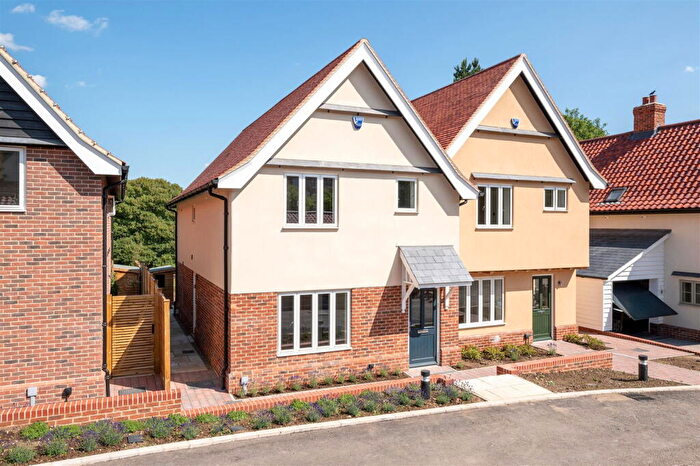
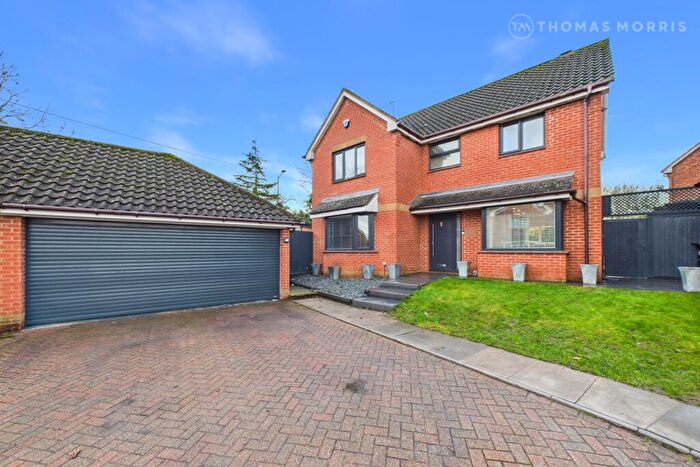
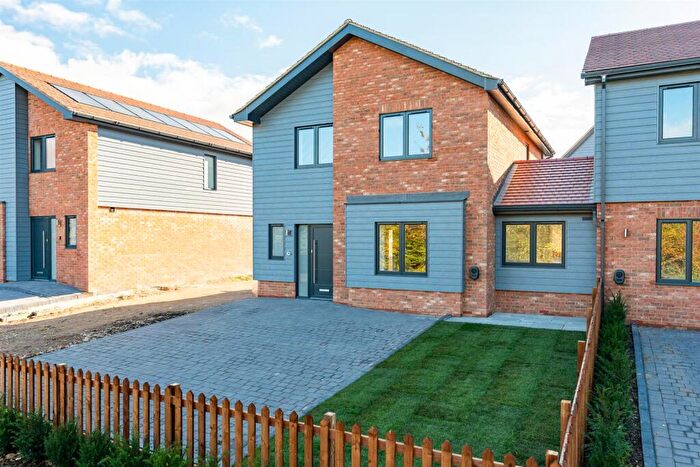
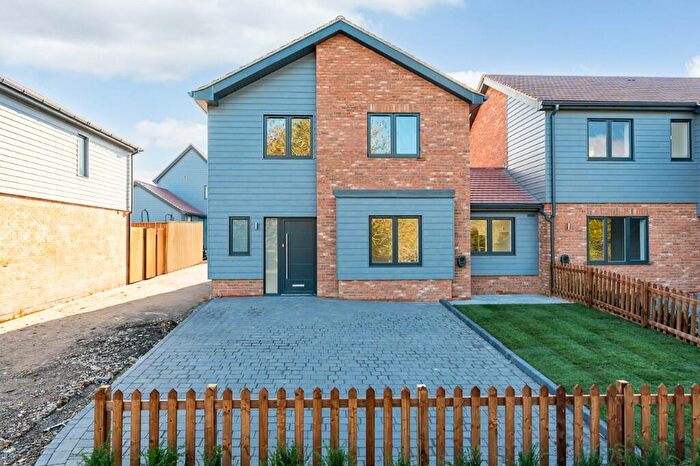
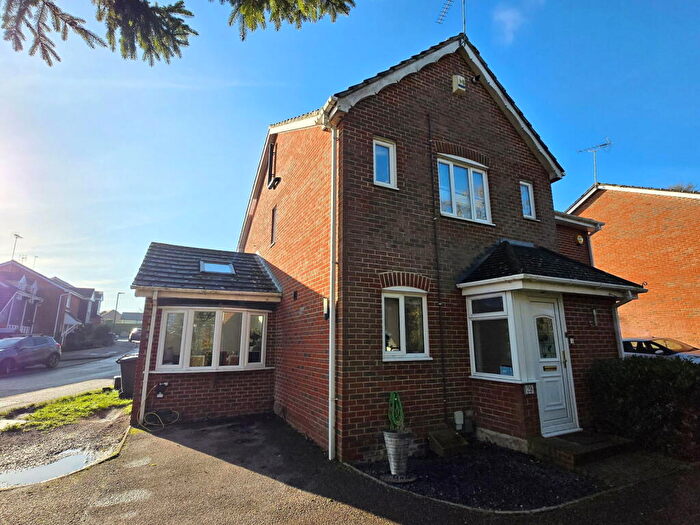
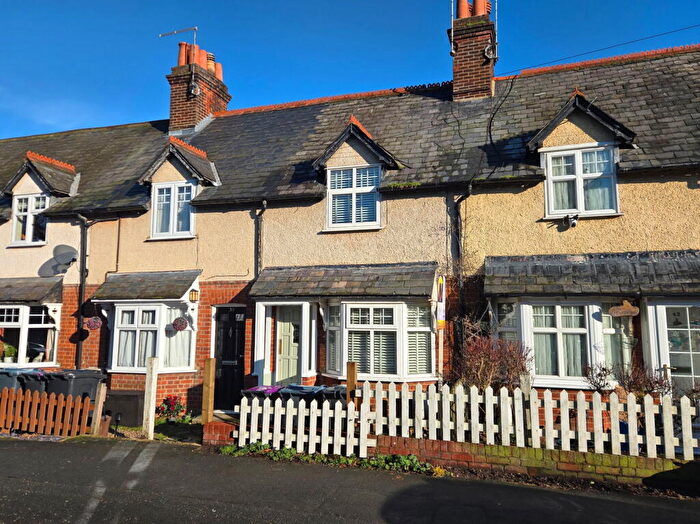
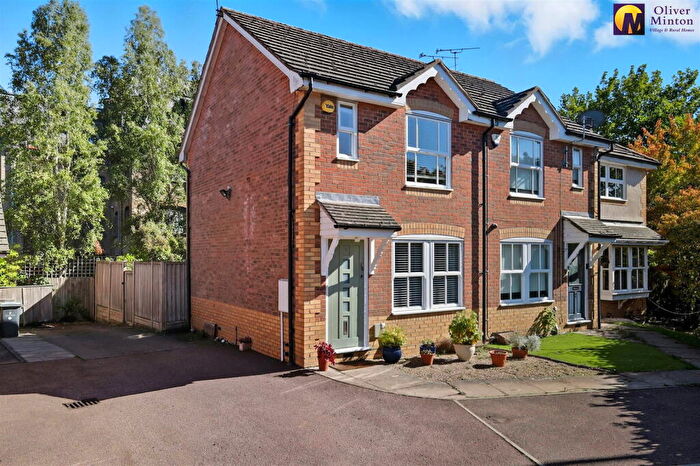
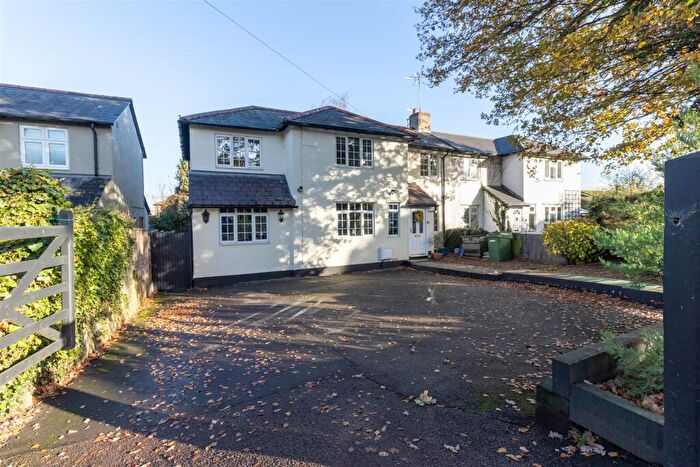
Houses for sale & to rent in Braughing, Ware
House Prices in Braughing
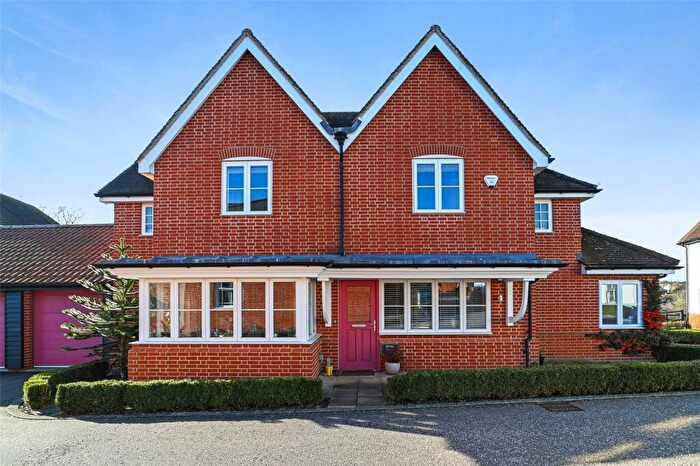
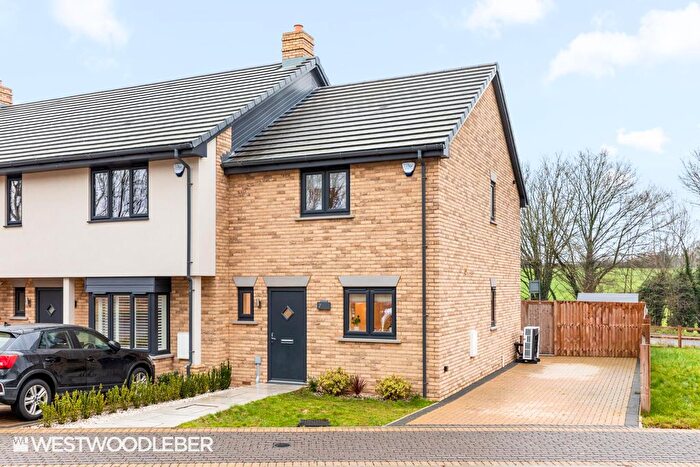
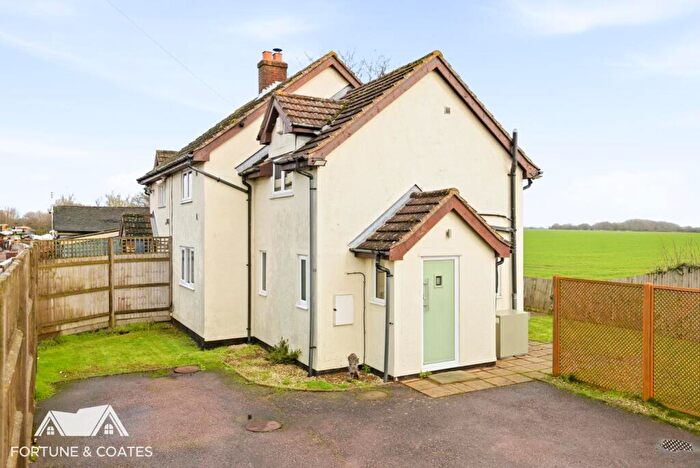
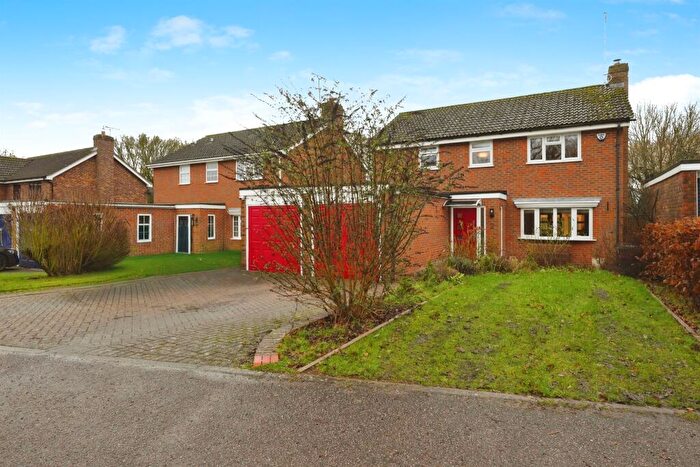
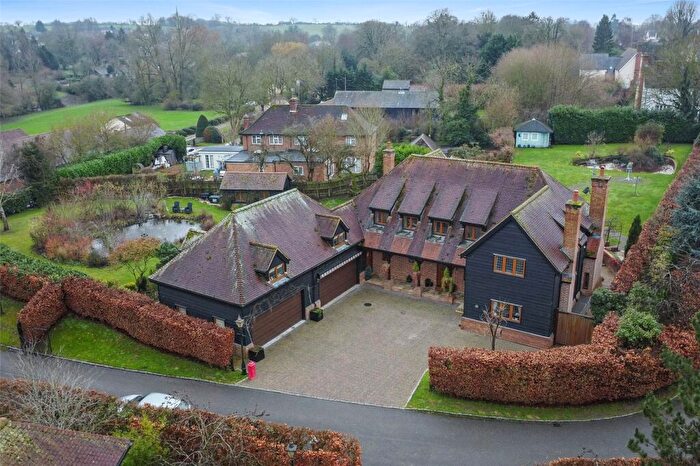
Properties in Braughing have an average house price of £714,316.00 and had 30 Property Transactions within the last 3 years¹.
Braughing is an area in Ware, Hertfordshire with 455 households², where the most expensive property was sold for £2,100,000.00.
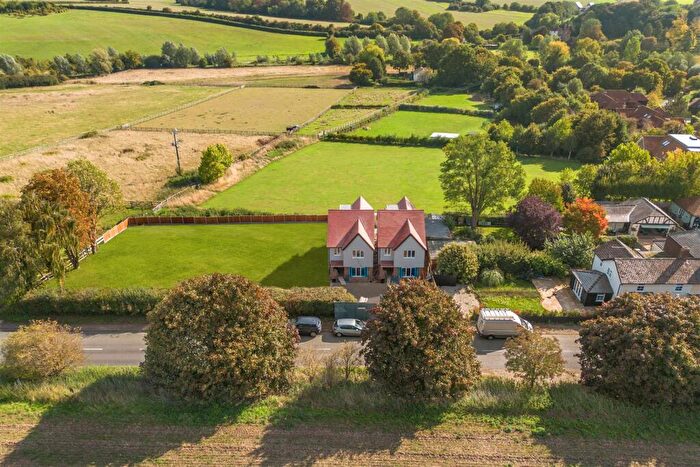
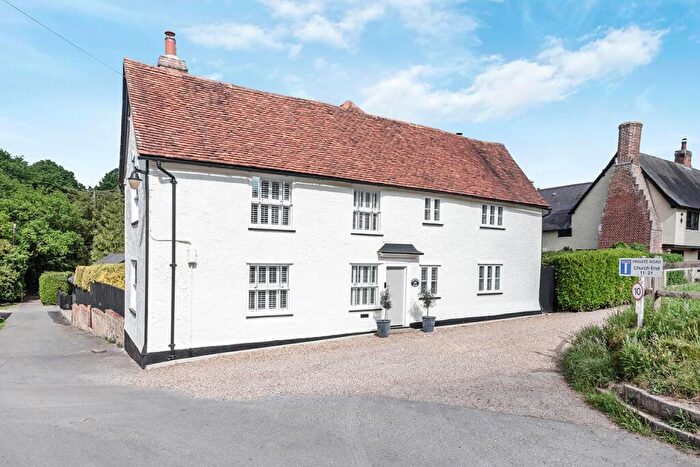
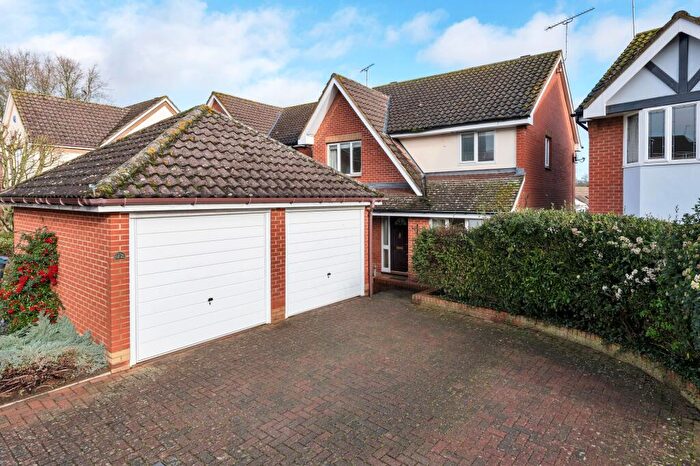
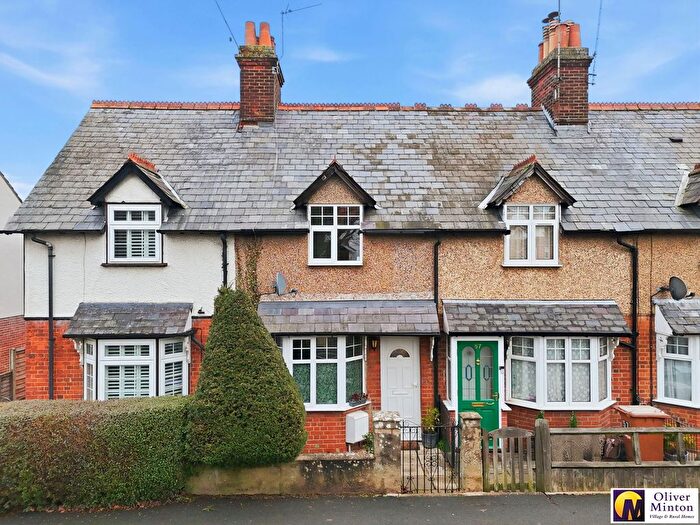
Properties for sale in Braughing
Roads and Postcodes in Braughing
Navigate through our locations to find the location of your next house in Braughing, Ware for sale or to rent.
| Streets | Postcodes |
|---|---|
| Braughing Bury | SG11 2RD |
| Braughing Road | SG11 2JF |
| Church End | SG11 2PZ SG11 2QA |
| Dassels | SG11 2RN SG11 2RP SG11 2RR SG11 2RW |
| Ford Street | SG11 2PW SG11 2PN |
| Friars | SG11 2NR SG11 2NS SG11 2NT |
| Friars Road | SG11 2NH SG11 2NN SG11 2NP |
| Gravelly Lane | SG11 2RL |
| Green End | SG11 2PE SG11 2PG SG11 2PQ |
| Green Lane | SG11 2QG SG11 2QN SG11 2QW |
| Greenhill Close | SG11 2PX |
| Hay Street | SG11 2RG SG11 2RH SG11 2RJ SG11 2RQ SG11 2RE SG11 2RF |
| Hull Lane | SG11 2PF |
| Longmans | SG11 2QL |
| Malting Lane | SG11 2QZ |
| Northfield | SG11 2QQ |
| Old School Place | SG11 2QB |
| Orchard Houses | SG11 2QP |
| Pelham Road | SG11 2QU |
| Pentlows | SG11 2QD |
| Pound Close | SG11 2BH |
| Quin Court | SG11 2PY |
| Rose Meadow | SG11 2RS |
| Saffron Ground Gardens | SG11 2BJ |
| Southfield | SG11 2QH |
| Station Road | SG11 2PB SG11 2PD |
| The Square | SG11 2QS |
| The Street | SG11 2QE SG11 2QF SG11 2QR SG11 2QT |
| Uplands | SG11 2QJ |
| Wickham Hill | SG11 2PA |
| SG11 2PP SG11 2QX SG11 2PR SG11 2PS SG11 2PT SG11 2PU SG11 2QY |
Transport near Braughing
-
Bishops Stortford Station
-
Stansted Mountfitchet Station
-
Watton-At-Stone Station
-
Ware Station
-
Elsenham Station
-
St.Margaret's (Hertfordshire) Station
-
Sawbridgeworth Station
-
Hertford East Station
-
Newport (Essex) Station
-
Roydon Station
- FAQ
- Price Paid By Year
- Property Type Price
Frequently asked questions about Braughing
What is the average price for a property for sale in Braughing?
The average price for a property for sale in Braughing is £714,316. This amount is 53% higher than the average price in Ware. There are 358 property listings for sale in Braughing.
What streets have the most expensive properties for sale in Braughing?
The streets with the most expensive properties for sale in Braughing are Friars at an average of £1,296,875, Saffron Ground Gardens at an average of £1,088,500 and Rose Meadow at an average of £825,000.
What streets have the most affordable properties for sale in Braughing?
The streets with the most affordable properties for sale in Braughing are Southfield at an average of £415,000, Ford Street at an average of £510,000 and Friars Road at an average of £552,000.
Which train stations are available in or near Braughing?
Some of the train stations available in or near Braughing are Bishops Stortford, Stansted Mountfitchet and Watton-At-Stone.
Property Price Paid in Braughing by Year
The average sold property price by year was:
| Year | Average Sold Price | Price Change |
Sold Properties
|
|---|---|---|---|
| 2025 | £702,857 | -6% |
7 Properties |
| 2024 | £743,272 | 7% |
11 Properties |
| 2023 | £694,458 | -13% |
12 Properties |
| 2022 | £782,975 | 9% |
20 Properties |
| 2021 | £715,766 | -39% |
30 Properties |
| 2020 | £997,547 | 25% |
19 Properties |
| 2019 | £748,388 | 31% |
18 Properties |
| 2018 | £519,375 | -11% |
16 Properties |
| 2017 | £575,178 | 7% |
14 Properties |
| 2016 | £534,555 | -16% |
18 Properties |
| 2015 | £622,300 | -17% |
15 Properties |
| 2014 | £726,176 | 38% |
17 Properties |
| 2013 | £447,574 | -20% |
26 Properties |
| 2012 | £537,999 | 10% |
14 Properties |
| 2011 | £485,998 | 16% |
7 Properties |
| 2010 | £407,681 | -20% |
11 Properties |
| 2009 | £490,214 | -29% |
14 Properties |
| 2008 | £634,800 | 35% |
10 Properties |
| 2007 | £411,863 | -17% |
22 Properties |
| 2006 | £481,427 | 25% |
23 Properties |
| 2005 | £361,792 | 10% |
12 Properties |
| 2004 | £325,656 | -18% |
16 Properties |
| 2003 | £384,555 | 17% |
9 Properties |
| 2002 | £320,932 | 4% |
20 Properties |
| 2001 | £308,416 | 42% |
12 Properties |
| 2000 | £179,611 | -20% |
18 Properties |
| 1999 | £214,821 | -25% |
14 Properties |
| 1998 | £268,266 | 48% |
15 Properties |
| 1997 | £140,121 | -11% |
16 Properties |
| 1996 | £155,431 | 37% |
16 Properties |
| 1995 | £97,333 | - |
12 Properties |
Property Price per Property Type in Braughing
Here you can find historic sold price data in order to help with your property search.
The average Property Paid Price for specific property types in the last three years are:
| Property Type | Average Sold Price | Sold Properties |
|---|---|---|
| Semi Detached House | £557,777.00 | 9 Semi Detached Houses |
| Detached House | £926,928.00 | 14 Detached Houses |
| Terraced House | £490,357.00 | 7 Terraced Houses |

