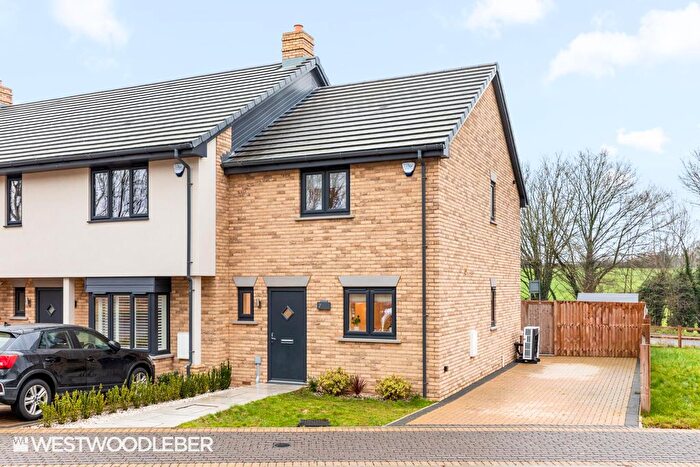
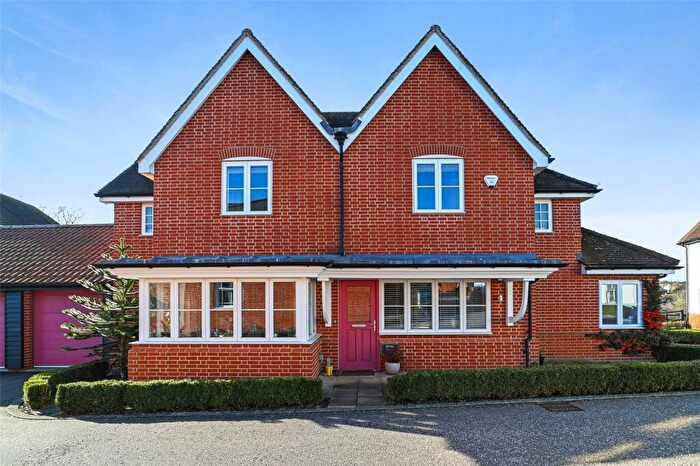
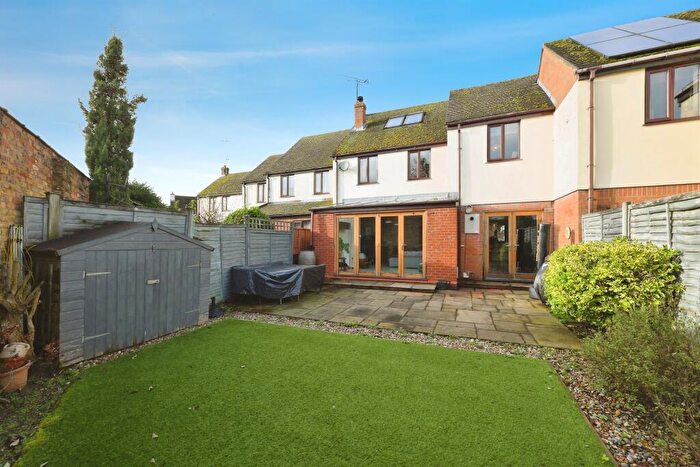
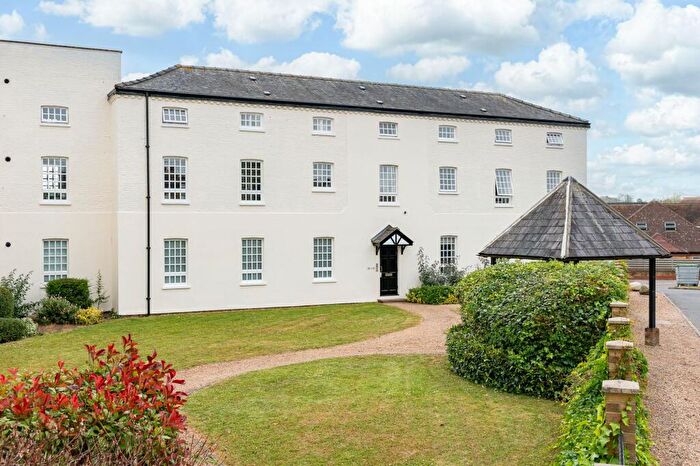
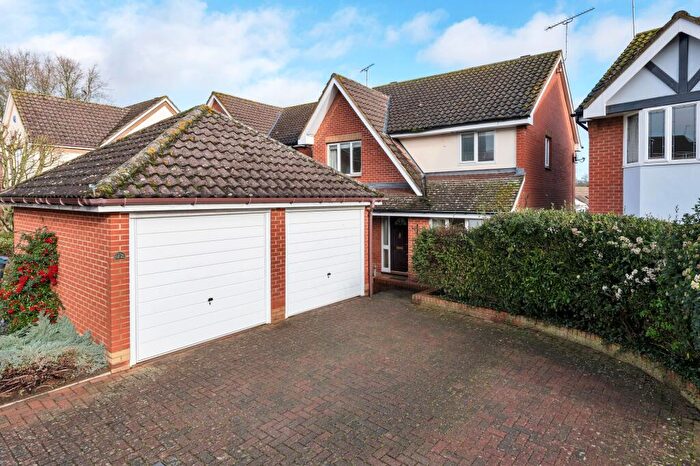
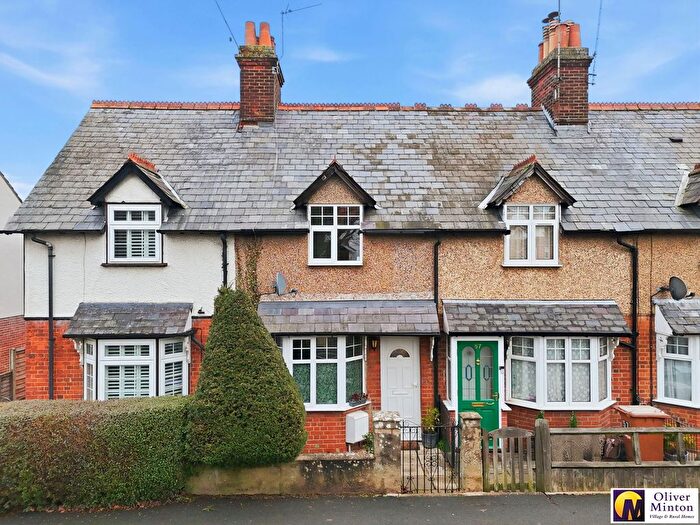
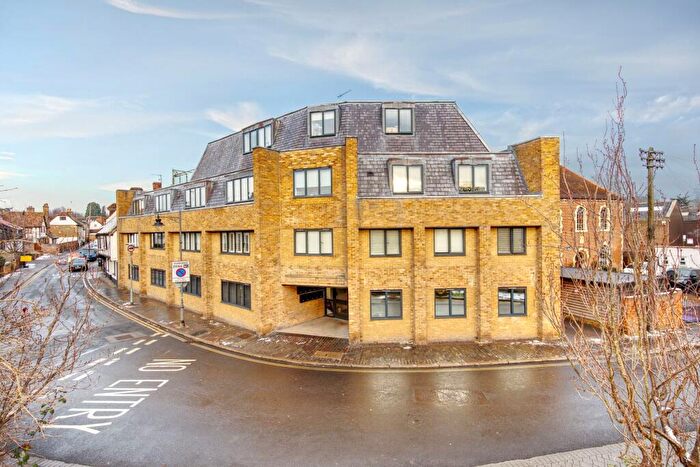
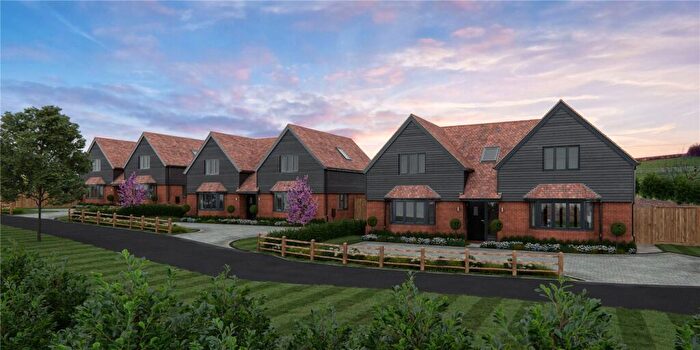
Houses for sale & to rent in Thundridge And Standon, Ware
House Prices in Thundridge And Standon
Properties in Thundridge And Standon have an average house price of £640,739.00 and had 93 Property Transactions within the last 3 years¹.
Thundridge And Standon is an area in Ware, Hertfordshire with 1,091 households², where the most expensive property was sold for £2,900,000.00.
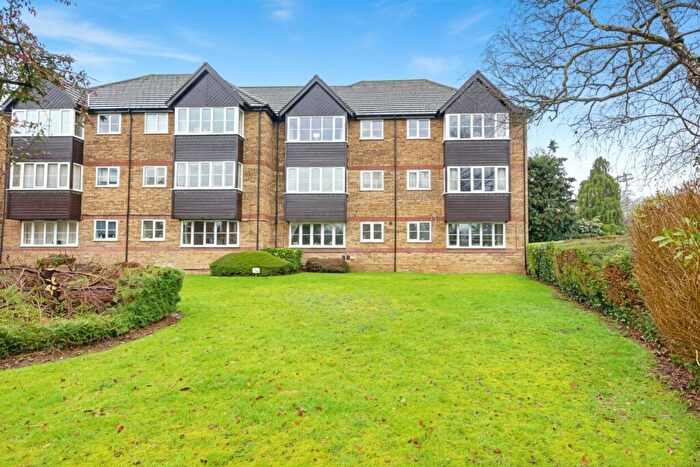
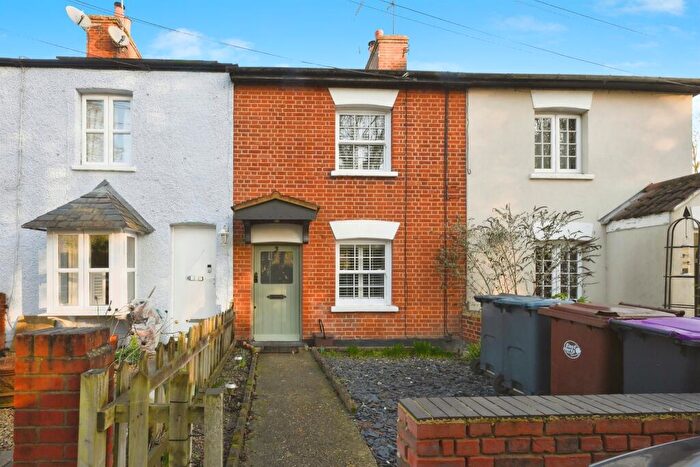
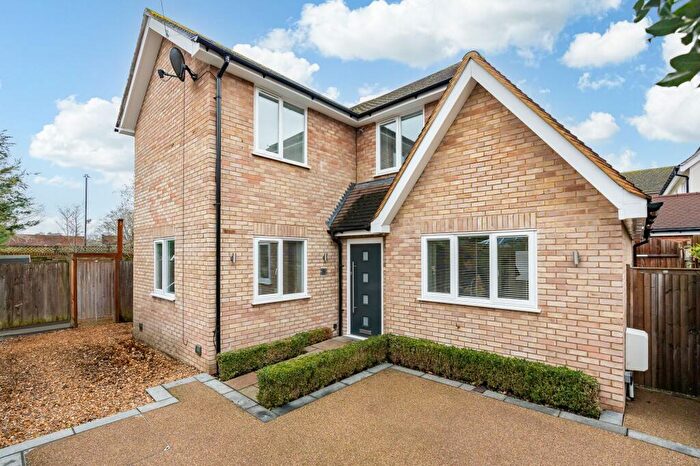
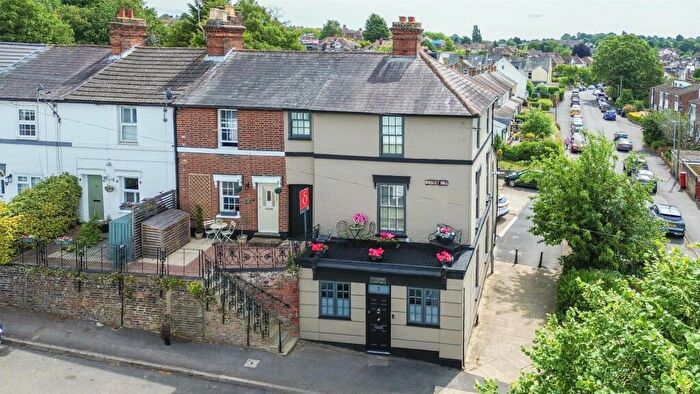
Properties for sale in Thundridge And Standon
Roads and Postcodes in Thundridge And Standon
Navigate through our locations to find the location of your next house in Thundridge And Standon, Ware for sale or to rent.
| Streets | Postcodes |
|---|---|
| Anchor Lane | SG12 0TE |
| Anchor Lane Cottages | SG12 0TG |
| Barwick | SG11 1BY SG11 1DB SG11 1DD |
| Barwick Road | SG11 1PN SG11 1PR |
| Bird Court | SG11 1BL |
| Bramble Cottages | SG11 1BW |
| Broken Green | SG11 1NG SG11 1NH SG11 1NQ |
| Bromley Hall Cottages | SG11 1NX |
| Bromley Lane | SG11 1NW |
| Cambridge Road | SG11 1BB SG12 0SU SG12 0TH SG12 0TJ SG12 0TN SG12 0TP SG12 0TS SG12 0TT |
| Chapmans Yard | SG11 1AQ |
| Church Fields | SG11 1QR |
| Cold Christmas Lane | SG12 0SJ SG12 0UE SG12 7SL SG12 7SN SG12 7SP |
| Colliers End | SG11 1EJ SG11 1ER SG11 1ET |
| Dellfield | SG12 0TB |
| Downfield Court | SG12 0SB |
| Ducketts Wood | SG12 0SR |
| Eleanors Close | SG12 0RA |
| Ermine Street | SG12 0SY SG12 0SZ |
| Gore Lane | SG11 1BU |
| Gore Lane Cottages | SG11 1BX |
| Hadham Road | SG11 1LE SG11 1LH SG11 1LQ |
| Hammarsfield Close | SG11 1PG |
| Hanbury Mews | SG12 0UB |
| Hanging Wood | SG11 1RB |
| High Road | SG11 1AA SG11 1AB SG11 1AD SG11 1AE SG11 1AF SG11 1AP SG11 1AZ SG11 1BA SG11 1BD |
| High Street | SG11 1LA SG11 1LB |
| Kents Lane | SG11 1PJ SG11 1PT |
| Knights Court | SG11 1LN |
| Knoll View | SG11 1BS |
| Latchford | SG11 1QX SG11 1QZ |
| Marshalls Lane | SG11 1AH |
| Meadow View Cottages | SG12 7SW |
| Mill End | SG11 1LP SG11 1LR |
| Millfield | SG12 0TU |
| Moles Farm | SG12 0UG |
| North Drive | SG11 1AN SG11 1AR SG11 1AW |
| Old Church Lane | SG12 0TA |
| Old Hall Green | SG11 1DX SG11 1DY SG11 1EZ |
| Paper Mill Lane | SG11 1LD |
| Parkins Close | SG11 1ED |
| Pest House Lane | SG11 1BG |
| Poles Lane | SG12 0SG SG12 0SQ |
| Poles Park | SG12 0UD |
| Poplar Close | SG11 1AY |
| Regal Close | SG11 1QJ |
| Rib Close | SG11 1QS |
| Rose Cottages | SG11 1LG |
| Saffron Meadow | SG11 1RE |
| Sargents | SG11 1LL |
| South Road | SG11 1PS |
| Standon Court | SG11 1LW |
| Standon Green End | SG11 1BP |
| Station Road | SG11 1QN SG11 1QW |
| Stortford Road | SG11 1LT SG11 1LX SG11 1LY SG11 1LZ |
| The Orchards | SG11 1BJ |
| Thundridge Hill | SG12 0UF |
| Town Farm Crescent | SG11 1NA |
| Upper Bacchus | SG11 1EH |
| Vicarage Close | SG11 1QP |
| Wellington Cottages | SG11 1EE |
| Wellpond Green | SG11 1NJ SG11 1NL SG11 1NN SG11 1NP |
| West View Cottages | SG11 1EG |
| Windmill Cottages | SG12 0SL |
| Woodlands Road | SG12 0SN SG12 0SW |
| Yew Tree Cottages | SG11 1EQ |
| Youngsbury Lane | SG12 0TX SG12 0TY |
| SG11 1DA SG12 0TZ |
Transport near Thundridge And Standon
-
Ware Station
-
St.Margaret's (Hertfordshire) Station
-
Watton-At-Stone Station
-
Hertford East Station
-
Hertford North Station
-
Roydon Station
-
Rye House Station
-
Harlow Town Station
-
Bishops Stortford Station
-
Harlow Mill Station
- FAQ
- Price Paid By Year
- Property Type Price
Frequently asked questions about Thundridge And Standon
What is the average price for a property for sale in Thundridge And Standon?
The average price for a property for sale in Thundridge And Standon is £640,739. This amount is 37% higher than the average price in Ware. There are 1,329 property listings for sale in Thundridge And Standon.
What streets have the most expensive properties for sale in Thundridge And Standon?
The streets with the most expensive properties for sale in Thundridge And Standon are Poles Park at an average of £2,900,000, Poles Lane at an average of £1,188,500 and Wellpond Green at an average of £1,135,000.
What streets have the most affordable properties for sale in Thundridge And Standon?
The streets with the most affordable properties for sale in Thundridge And Standon are Dellfield at an average of £250,000, Upper Bacchus at an average of £300,000 and Sargents at an average of £373,000.
Which train stations are available in or near Thundridge And Standon?
Some of the train stations available in or near Thundridge And Standon are Ware, St.Margaret's (Hertfordshire) and Watton-At-Stone.
Property Price Paid in Thundridge And Standon by Year
The average sold property price by year was:
| Year | Average Sold Price | Price Change |
Sold Properties
|
|---|---|---|---|
| 2025 | £647,710 | 16% |
32 Properties |
| 2024 | £543,983 | -35% |
31 Properties |
| 2023 | £733,283 | 14% |
30 Properties |
| 2022 | £628,453 | -10% |
49 Properties |
| 2021 | £691,529 | 21% |
43 Properties |
| 2020 | £545,983 | 4% |
30 Properties |
| 2019 | £525,484 | -7% |
33 Properties |
| 2018 | £564,416 | 16% |
30 Properties |
| 2017 | £475,617 | -11% |
42 Properties |
| 2016 | £530,094 | 18% |
43 Properties |
| 2015 | £434,764 | -15% |
46 Properties |
| 2014 | £501,122 | 18% |
48 Properties |
| 2013 | £412,588 | 8% |
35 Properties |
| 2012 | £380,705 | -7% |
29 Properties |
| 2011 | £407,976 | -15% |
38 Properties |
| 2010 | £468,497 | 10% |
34 Properties |
| 2009 | £423,293 | -6% |
34 Properties |
| 2008 | £448,935 | -9% |
31 Properties |
| 2007 | £487,536 | 28% |
71 Properties |
| 2006 | £350,862 | 0,2% |
80 Properties |
| 2005 | £350,090 | 13% |
69 Properties |
| 2004 | £305,258 | -10% |
52 Properties |
| 2003 | £335,560 | 19% |
54 Properties |
| 2002 | £271,594 | 7% |
63 Properties |
| 2001 | £251,348 | 18% |
52 Properties |
| 2000 | £206,085 | 8% |
60 Properties |
| 1999 | £189,928 | 12% |
50 Properties |
| 1998 | £166,264 | 12% |
59 Properties |
| 1997 | £147,000 | 7% |
84 Properties |
| 1996 | £137,405 | 11% |
83 Properties |
| 1995 | £122,012 | - |
41 Properties |
Property Price per Property Type in Thundridge And Standon
Here you can find historic sold price data in order to help with your property search.
The average Property Paid Price for specific property types in the last three years are:
| Property Type | Average Sold Price | Sold Properties |
|---|---|---|
| Semi Detached House | £571,152.00 | 23 Semi Detached Houses |
| Detached House | £915,616.00 | 28 Detached Houses |
| Terraced House | £519,756.00 | 37 Terraced Houses |
| Flat | £316,800.00 | 5 Flats |

