
Houses for sale & to rent in Callowland, Watford
House Prices in Callowland
Properties in Callowland have an average house price of £374k and had 322 Property Transactions within the last 3 years¹.
Callowland is an area in Watford, Hertfordshire with 3,158 households², where the most expensive property was sold for £585k.
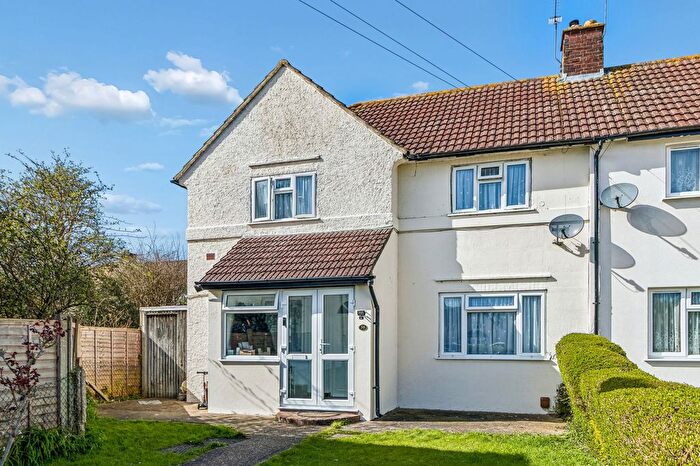
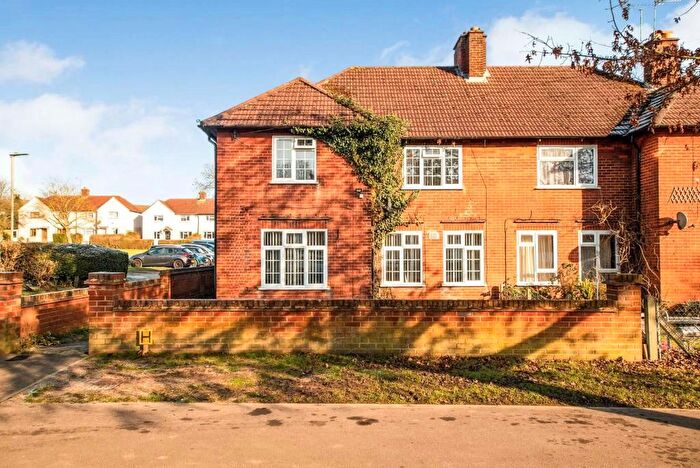
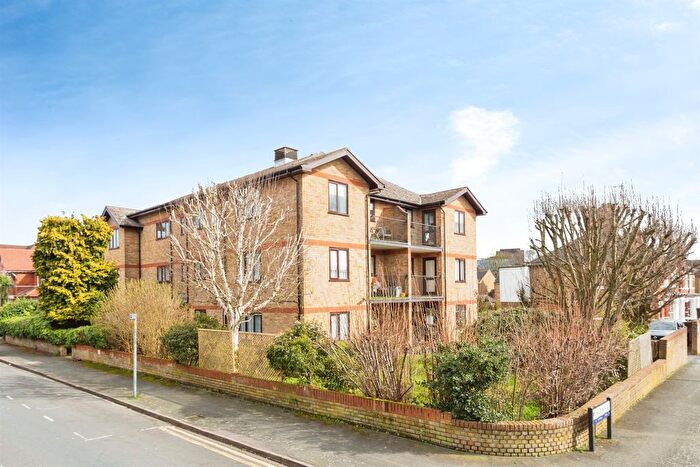
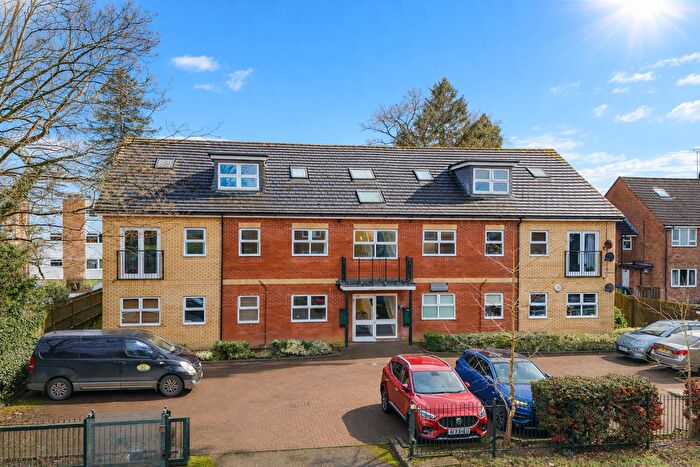
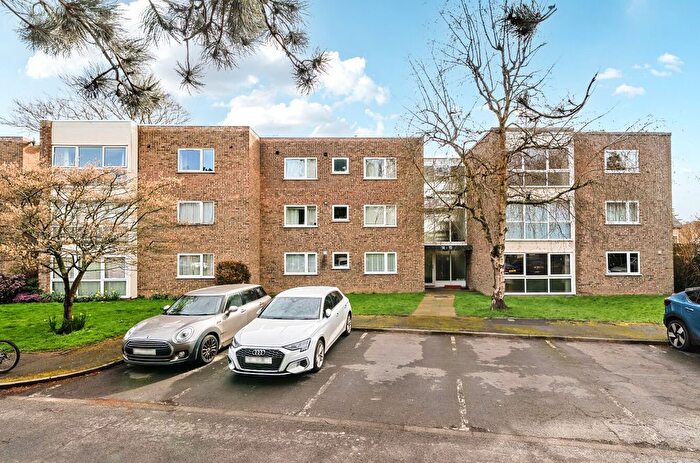
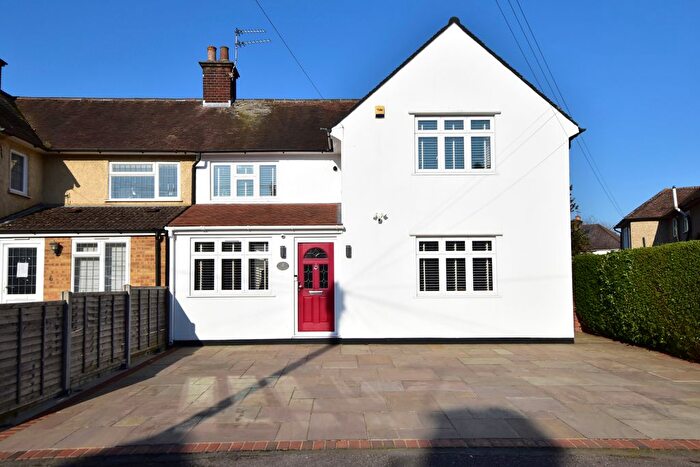
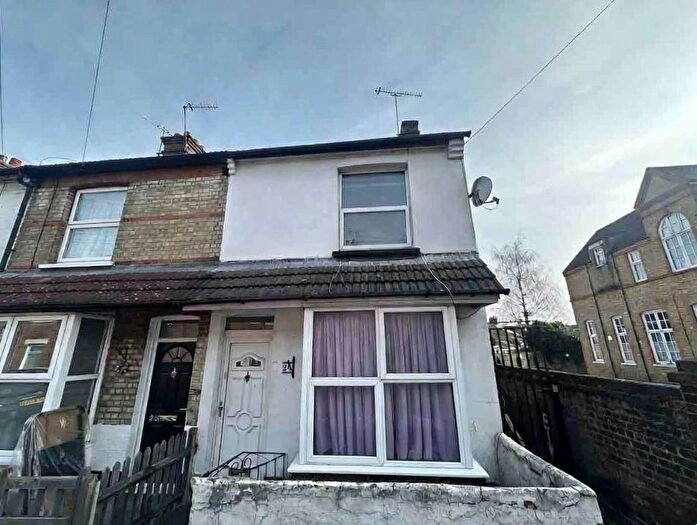
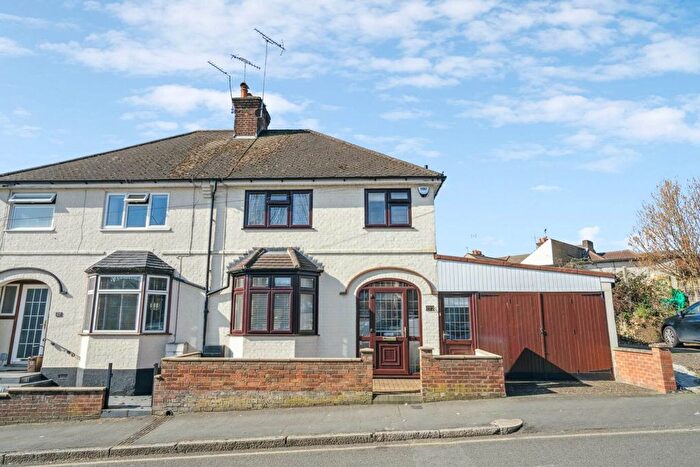
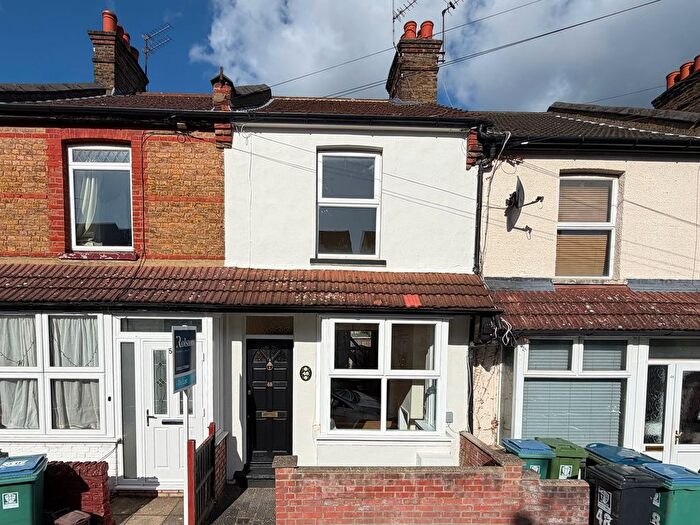
Properties for sale in Callowland
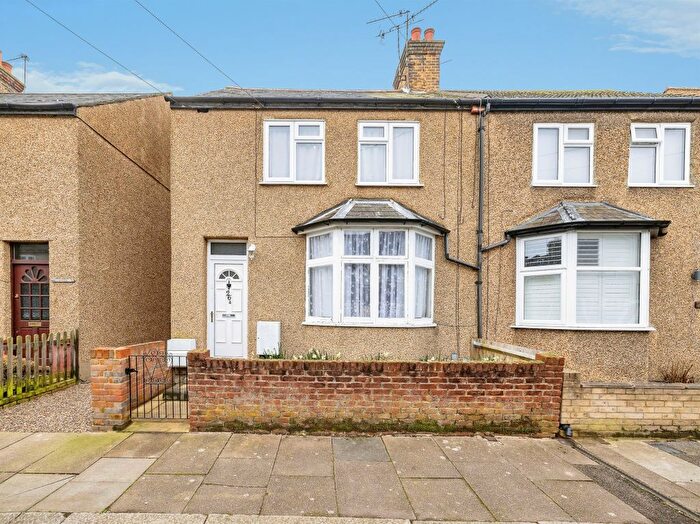
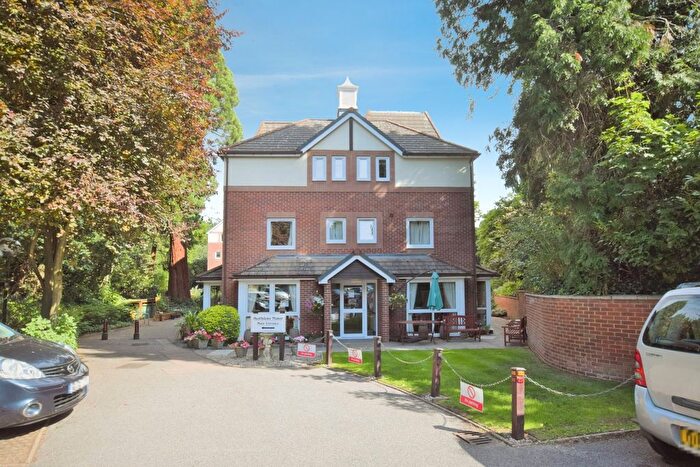
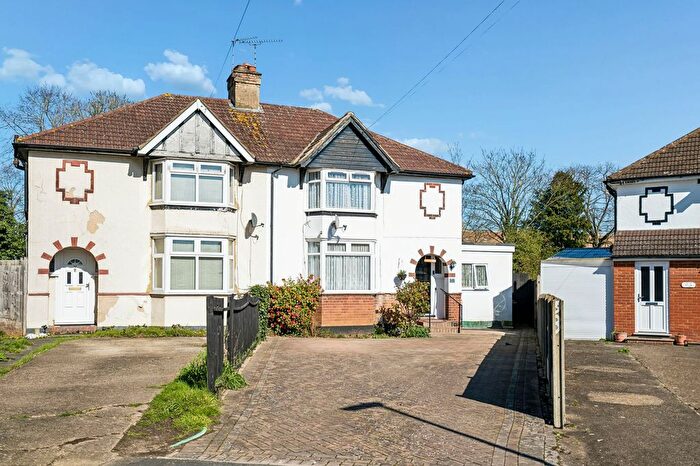
![]()
If you are looking to sell your house, let it out, or receive a property valuation, an expert can help you.
Click the button below to get started.

Roads and Postcodes in Callowland
Navigate through our locations to find the location of your next house in Callowland, Watford for sale or to rent.
Transport near Callowland
-
 Watford North Station
 -
 Watford Junction Station
 -
Garston (Hertfordshire) Station
-
 Watford Station
 -
Watford High Street Station
-
Bushey Station
-
Croxley Station
-
Bricket Wood Station
-
King's Langley Station
- FAQ
- Price Paid By Year
- Property Type Price
Frequently asked questions about Callowland
What is the average price for a property for sale in Callowland?
The average price for a property for sale in Callowland is £373,662. This amount is 18% lower than the average price in Watford. There are 2,509 property listings for sale in Callowland.
What streets have the most expensive properties for sale in Callowland?
The streets with the most expensive properties for sale in Callowland are Buckingham Road at an average of £525,000, Maude Crescent at an average of £515,000 and The Harebreaks at an average of £481,666.
What streets have the most affordable properties for sale in Callowland?
The streets with the most affordable properties for sale in Callowland are Chiswell Court at an average of £222,166, Southwold Road at an average of £240,750 and Sandown Road at an average of £275,833.
Which train stations are available in or near Callowland?
Some of the train stations available in or near Callowland are Watford North, Watford Junction and Garston (Hertfordshire).
Which tube stations are available in or near Callowland?
Some of the tube stations available in or near Callowland are Watford and Croxley.
Property Price Paid in Callowland by Year
The average sold property price by year was:
| Year | Average Sold Price | Price Change |
Sold Properties
|
|---|---|---|---|
| 2025 | £379,656 | 1% |
101 Properties |
| 2024 | £376,612 | 3% |
122 Properties |
| 2023 | £363,909 | -4% |
99 Properties |
| 2022 | £378,004 | 10% |
152 Properties |
| 2021 | £340,203 | 3% |
179 Properties |
| 2020 | £329,863 | 6% |
94 Properties |
| 2019 | £310,983 | -5% |
131 Properties |
| 2018 | £326,503 | -3% |
133 Properties |
| 2017 | £335,783 | 5% |
132 Properties |
| 2016 | £319,039 | 11% |
170 Properties |
| 2015 | £283,403 | 14% |
188 Properties |
| 2014 | £243,438 | 12% |
204 Properties |
| 2013 | £214,805 | 5% |
157 Properties |
| 2012 | £204,849 | 6% |
145 Properties |
| 2011 | £192,985 | -4% |
142 Properties |
| 2010 | £200,618 | 8% |
132 Properties |
| 2009 | £184,210 | -9% |
136 Properties |
| 2008 | £201,501 | -2% |
156 Properties |
| 2007 | £205,381 | 12% |
252 Properties |
| 2006 | £181,362 | 5% |
255 Properties |
| 2005 | £172,178 | 2% |
221 Properties |
| 2004 | £168,439 | 6% |
291 Properties |
| 2003 | £158,227 | 14% |
300 Properties |
| 2002 | £135,413 | 18% |
300 Properties |
| 2001 | £110,785 | 9% |
287 Properties |
| 2000 | £100,546 | 21% |
282 Properties |
| 1999 | £79,613 | 8% |
286 Properties |
| 1998 | £73,345 | 11% |
267 Properties |
| 1997 | £65,564 | 14% |
287 Properties |
| 1996 | £56,078 | 3% |
213 Properties |
| 1995 | £54,605 | - |
187 Properties |
Property Price per Property Type in Callowland
Here you can find historic sold price data in order to help with your property search.
The average Property Paid Price for specific property types in the last three years are:
| Property Type | Average Sold Price | Sold Properties |
|---|---|---|
| Flat | £250,196.00 | 51 Flats |
| Semi Detached House | £440,937.00 | 24 Semi Detached Houses |
| Detached House | £457,500.00 | 2 Detached Houses |
| Terraced House | £392,088.00 | 245 Terraced Houses |