
Houses for sale & to rent in Dickinsons, Watford
House Prices in Dickinsons
Properties in Dickinsons have an average house price of £433k and had 31 Property Transactions within the last 3 years¹.
Dickinsons is an area in Watford, Hertfordshire with 291 households², where the most expensive property was sold for £695k.
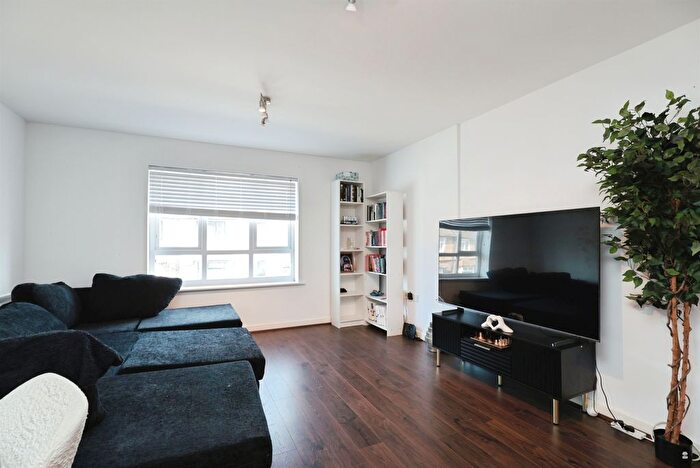
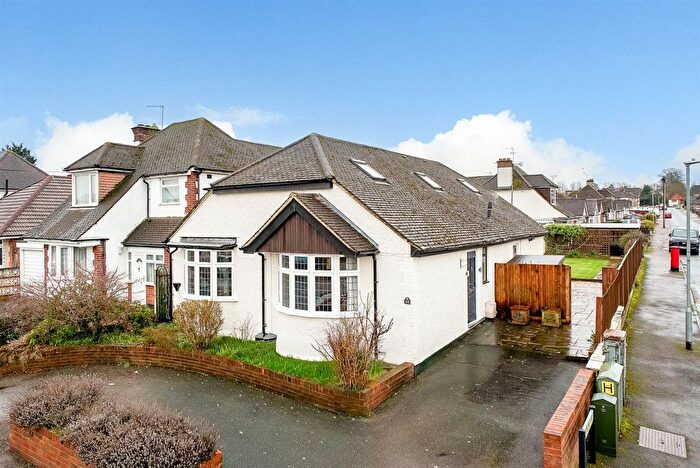
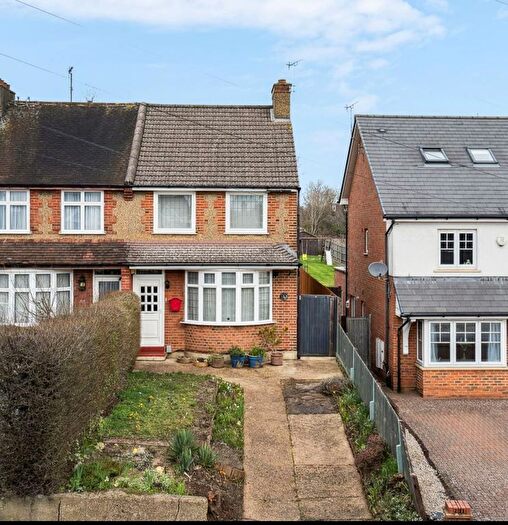
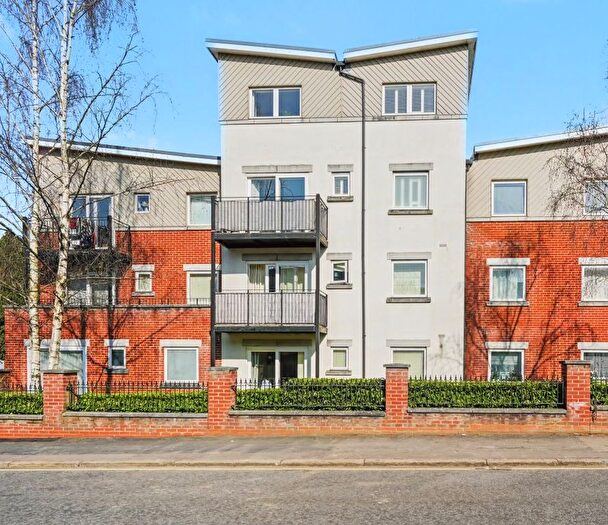
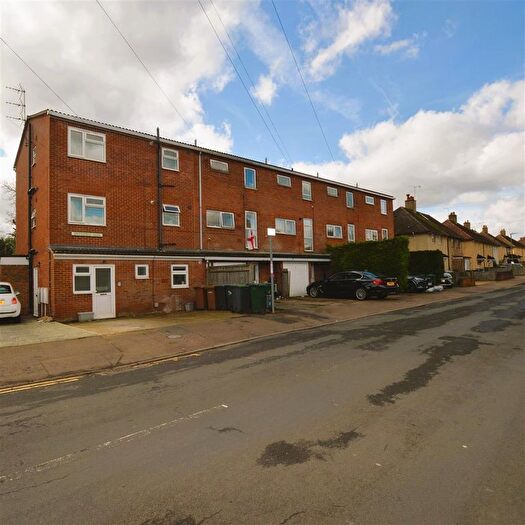
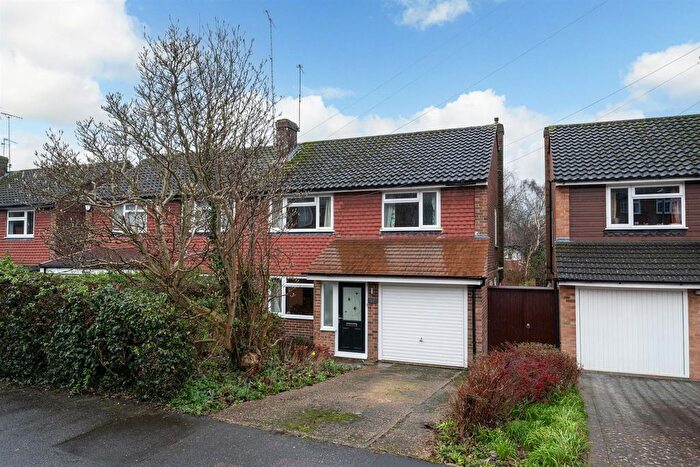
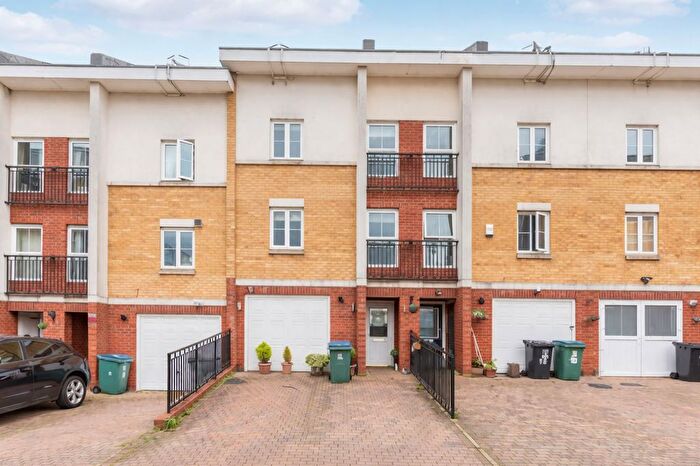
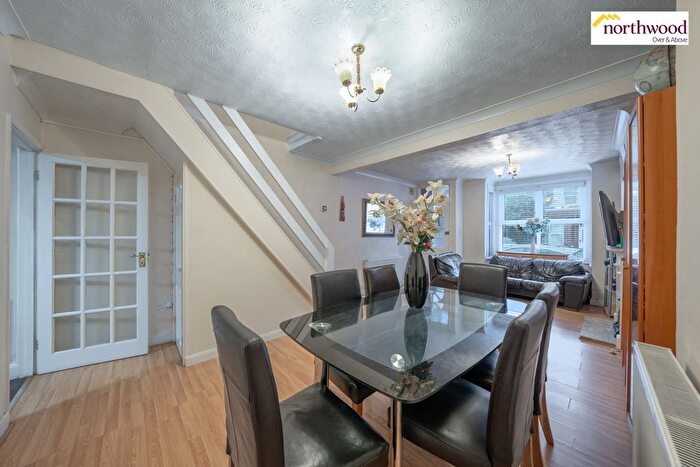
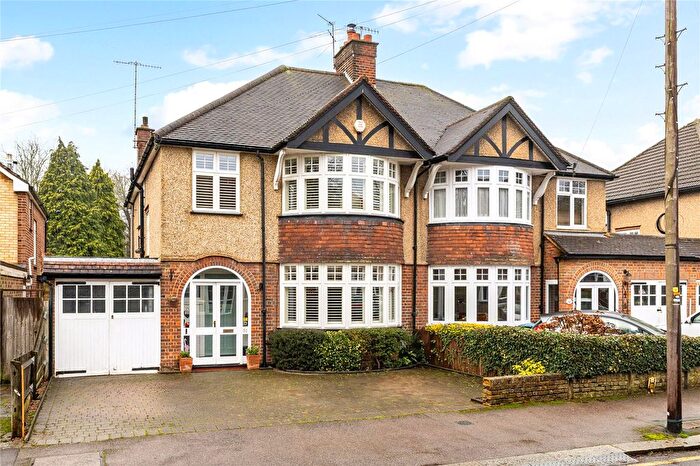
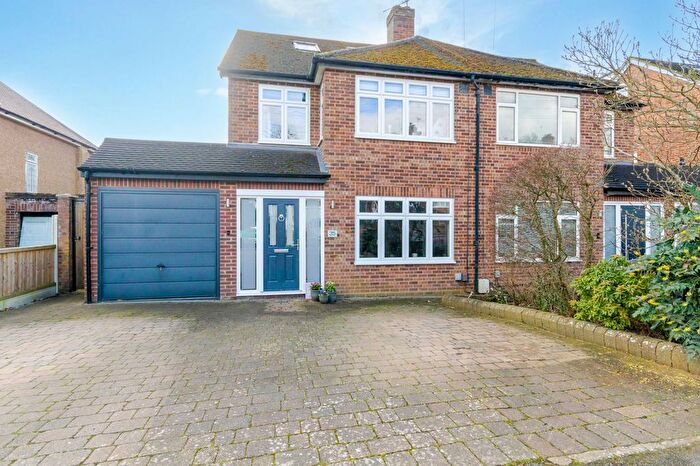
Properties for sale in Dickinsons
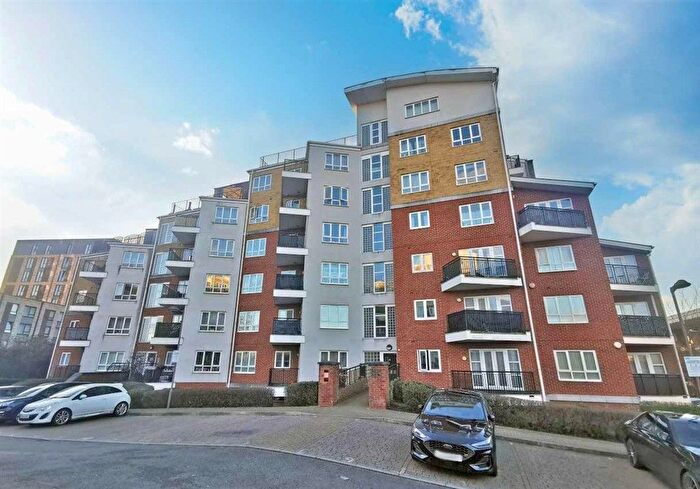
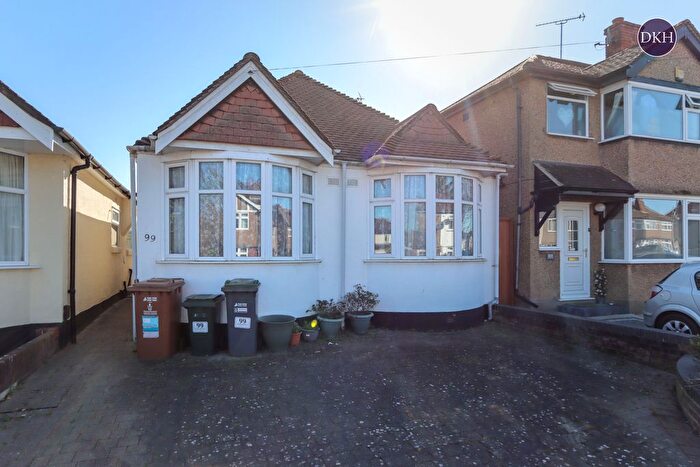
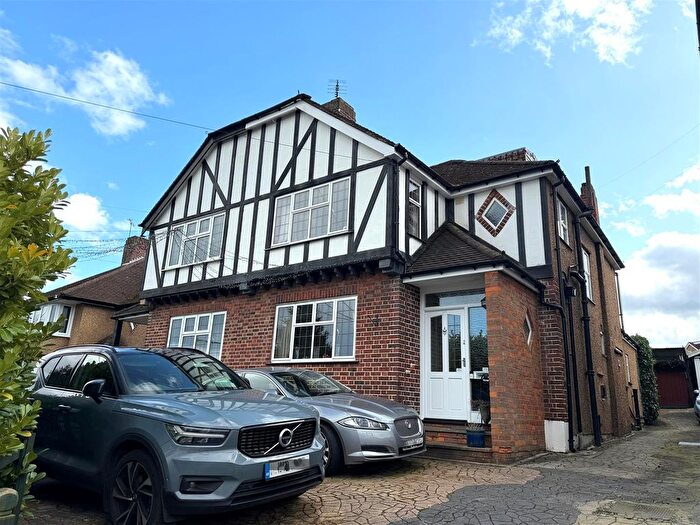
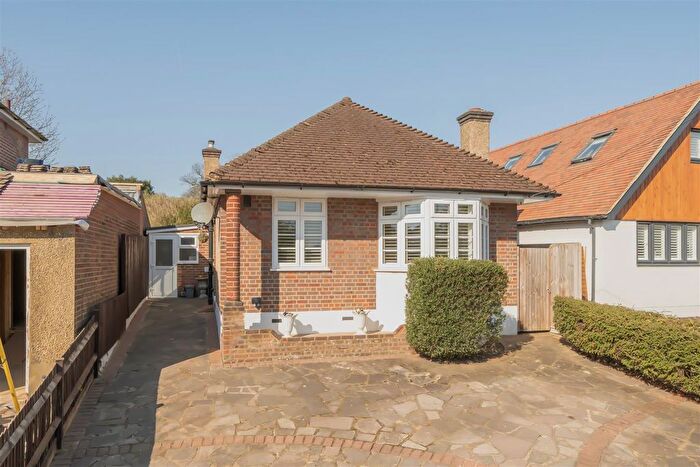
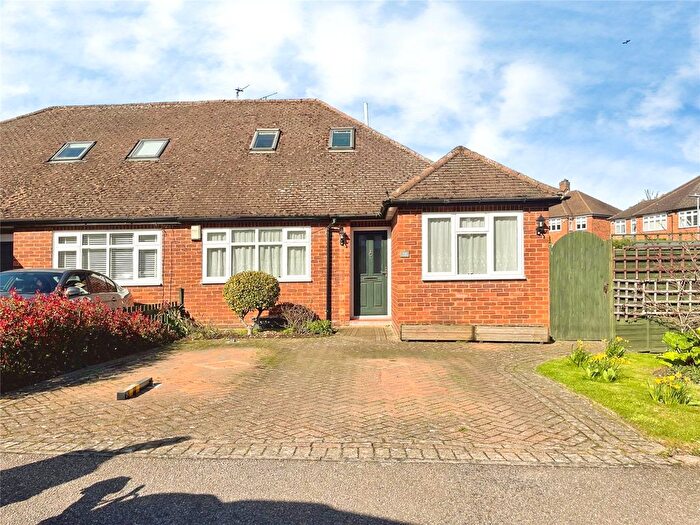
![]()
If you are looking to sell your house, let it out, or receive a property valuation, an expert can help you.
Click the button below to get started.
Roads and Postcodes in Dickinsons
Navigate through our locations to find the location of your next house in Dickinsons, Watford for sale or to rent.
| Streets | Postcodes |
|---|---|
| Basildon Close | WD18 8WL |
| Byewaters | WD18 8WH WD18 8WJ |
| Cassio Wharf | WD18 8SL |
| Evensyde | WD18 8WN WD18 8WQ |
| Gill Close | WD18 8WS |
| Hatters Lane | WD18 8AJ WD18 8AS WD18 8PX WD18 8WW WD18 8YE WD18 8YF WD18 8YG WD18 8YH WD18 8YN |
| Heckford Close | WD18 8WR |
| Longman Close | WD18 8WP |
| Marlins Meadow | WD18 8YA |
| Watford Road | WD18 8SN |
| Woodshots Meadow | WD18 8SS WD18 8YX |
Transport near Dickinsons
-
 Croxley Station
 -
Watford Station
-
Moor Park Station
-

 Watford High Street Station
 -
Rickmansworth Station
-
Watford Junction Station
-
Bushey Station
-
Carpenders Park Station
-
Northwood Station
-
Watford North Station
- FAQ
- Price Paid By Year
- Property Type Price
Frequently asked questions about Dickinsons
What is the average price for a property for sale in Dickinsons?
The average price for a property for sale in Dickinsons is £433,403. This amount is 5% lower than the average price in Watford. There are 697 property listings for sale in Dickinsons.
What streets have the most expensive properties for sale in Dickinsons?
The streets with the most expensive properties for sale in Dickinsons are Longman Close at an average of £519,166 and Byewaters at an average of £444,000.
What streets have the most affordable properties for sale in Dickinsons?
The streets with the most affordable properties for sale in Dickinsons are Basildon Close at an average of £317,500 and Evensyde at an average of £390,916.
Which train stations are available in or near Dickinsons?
Some of the train stations available in or near Dickinsons are Watford High Street, Rickmansworth and Watford Junction.
Which tube stations are available in or near Dickinsons?
Some of the tube stations available in or near Dickinsons are Croxley, Watford and Moor Park.
Property Price Paid in Dickinsons by Year
The average sold property price by year was:
| Year | Average Sold Price | Price Change |
Sold Properties
|
|---|---|---|---|
| 2025 | £381,600 | -15% |
10 Properties |
| 2024 | £439,500 | -8% |
10 Properties |
| 2023 | £474,954 | 6% |
11 Properties |
| 2022 | £446,480 | 9% |
13 Properties |
| 2021 | £408,194 | -8% |
18 Properties |
| 2020 | £440,566 | 5% |
15 Properties |
| 2019 | £419,000 | -15% |
8 Properties |
| 2018 | £481,416 | 19% |
12 Properties |
| 2017 | £390,150 | -16% |
17 Properties |
| 2016 | £452,444 | 17% |
18 Properties |
| 2015 | £376,222 | 23% |
18 Properties |
| 2014 | £290,499 | -9% |
10 Properties |
| 2013 | £315,627 | 9% |
16 Properties |
| 2012 | £287,025 | -1% |
18 Properties |
| 2011 | £288,996 | 6% |
16 Properties |
| 2010 | £270,321 | 2% |
14 Properties |
| 2009 | £264,722 | -0,2% |
20 Properties |
| 2008 | £265,166 | -0,5% |
15 Properties |
| 2007 | £266,367 | 5% |
26 Properties |
| 2006 | £252,011 | 3% |
26 Properties |
| 2005 | £244,961 | 0,3% |
26 Properties |
| 2004 | £244,203 | 8% |
43 Properties |
| 2003 | £223,578 | 12% |
31 Properties |
| 2002 | £196,141 | 8% |
55 Properties |
| 2001 | £179,550 | -5% |
30 Properties |
| 2000 | £187,967 | 19% |
52 Properties |
| 1999 | £151,634 | 8% |
195 Properties |
| 1998 | £140,081 | - |
58 Properties |
Property Price per Property Type in Dickinsons
Here you can find historic sold price data in order to help with your property search.
The average Property Paid Price for specific property types in the last three years are:
| Property Type | Average Sold Price | Sold Properties |
|---|---|---|
| Semi Detached House | £465,125.00 | 4 Semi Detached Houses |
| Terraced House | £443,323.00 | 17 Terraced Houses |
| Flat | £332,937.00 | 8 Flats |
| Detached House | £687,500.00 | 2 Detached Houses |