
Houses for sale & to rent in AL6 9JU, Tudor Road, Welwyn West, Welwyn
House Prices in AL6 9JU, Tudor Road, Welwyn West
Properties in AL6 9JU have no sales history available within the last 3 years. AL6 9JU is a postcode in Tudor Road located in Welwyn West, an area in Welwyn, Hertfordshire, with 8 households².
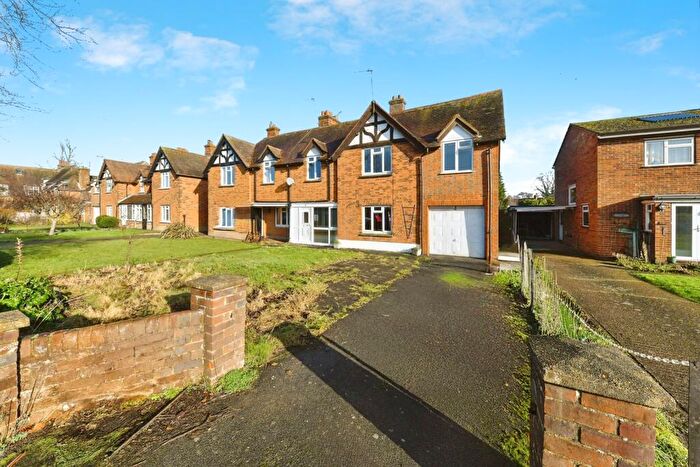
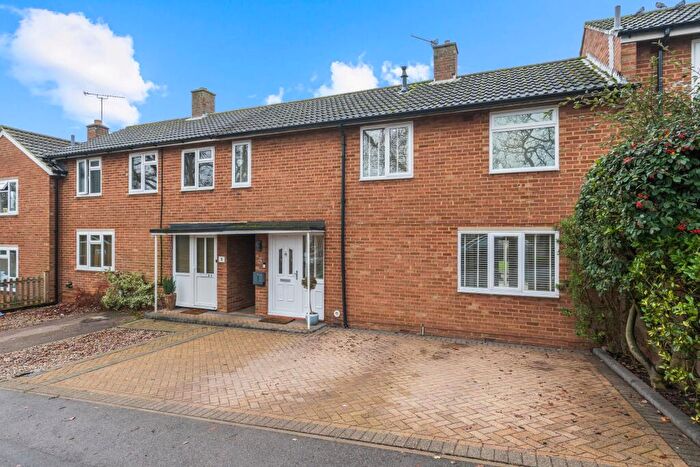
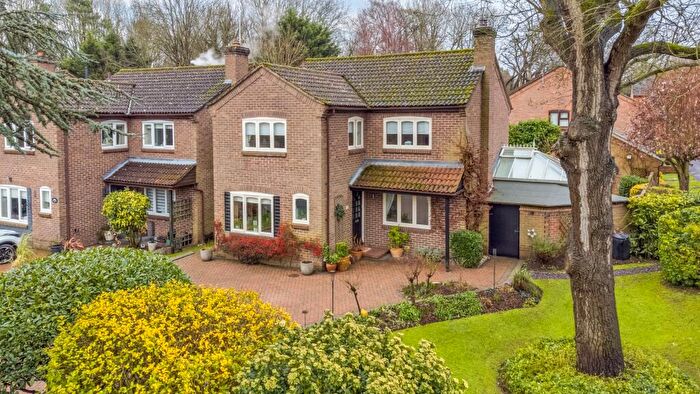
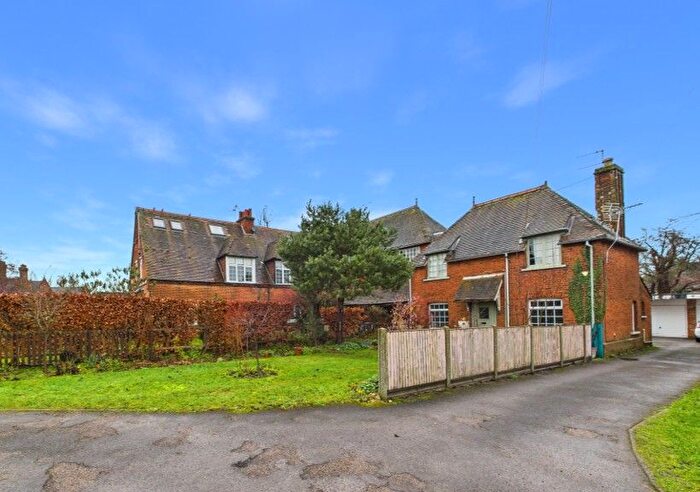
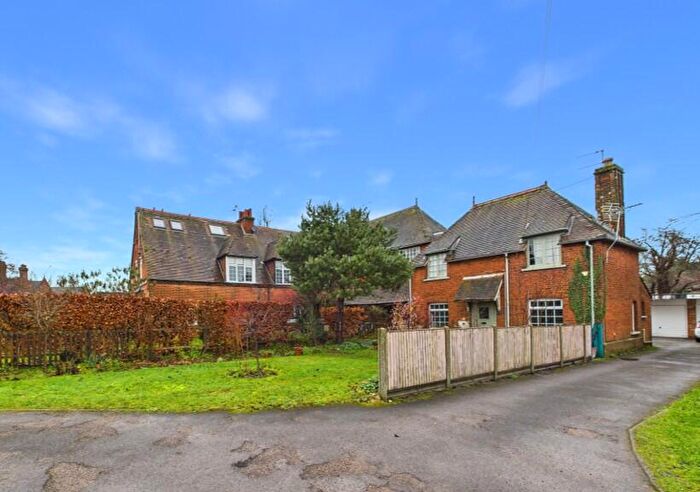
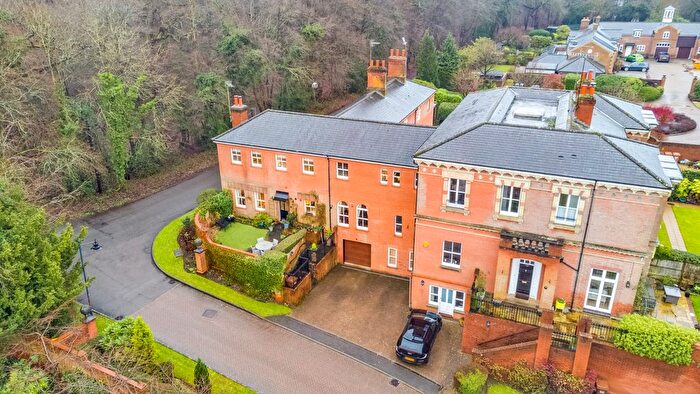
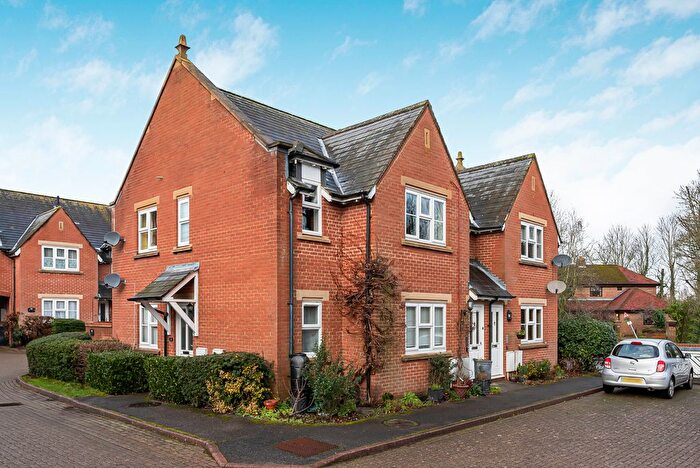
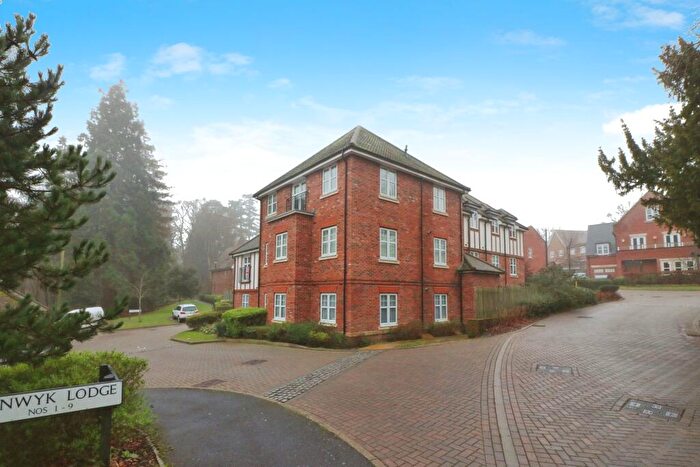
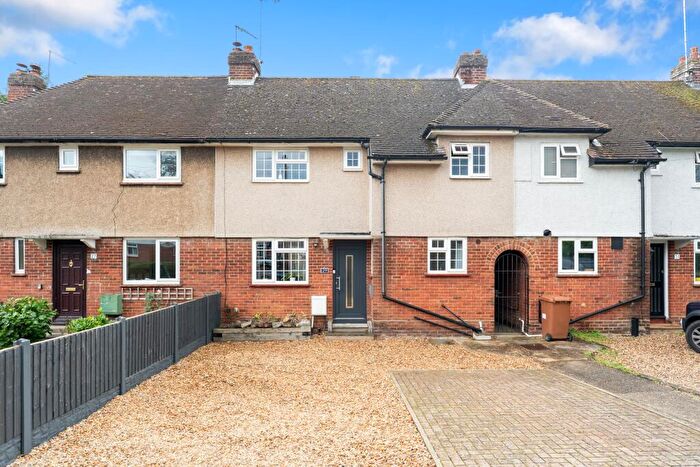
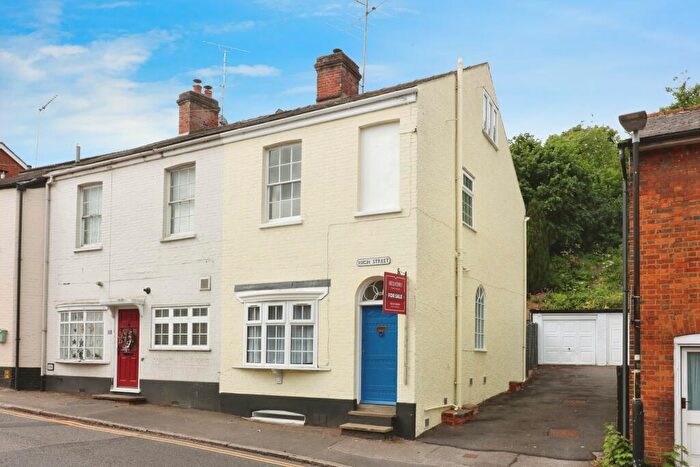
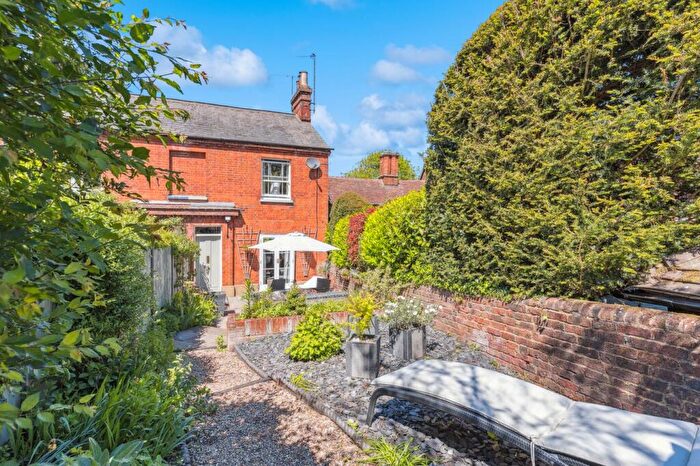
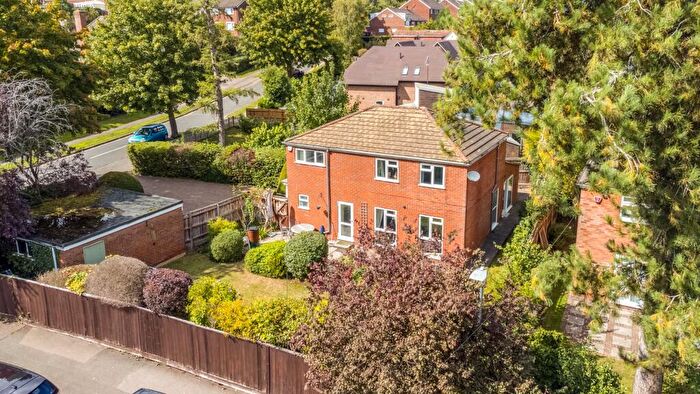
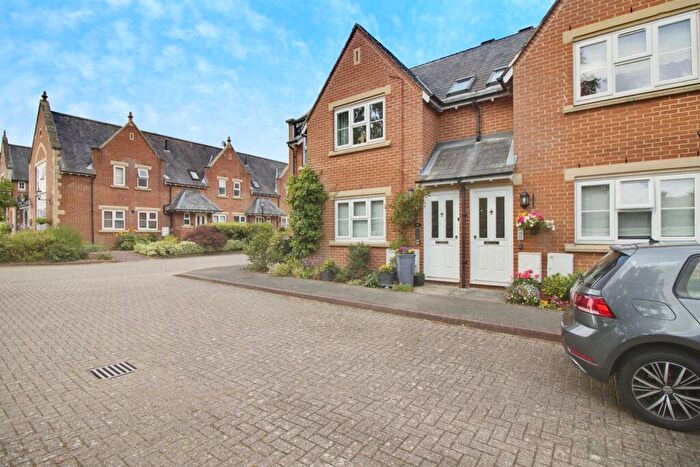
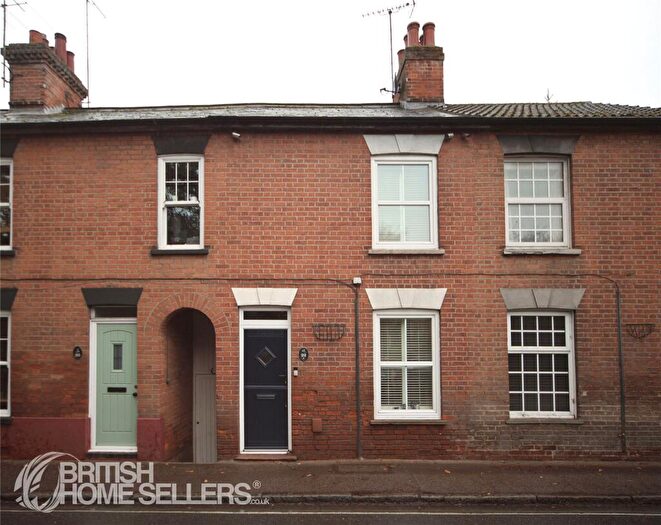
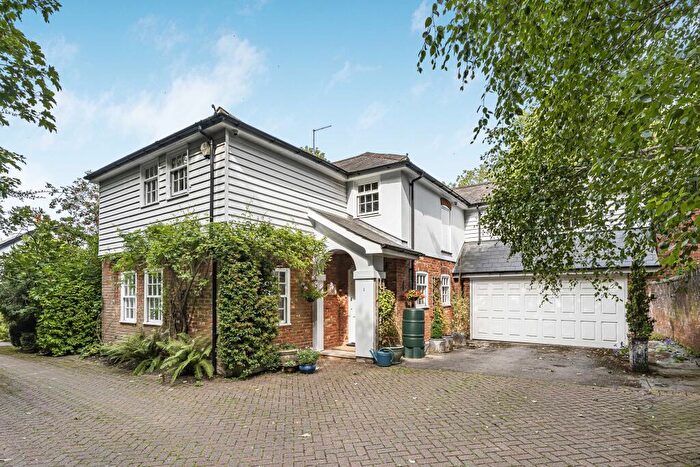
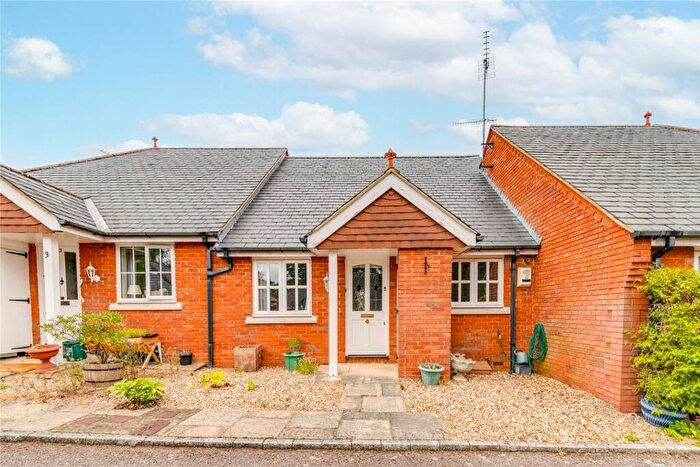
Properties for sale near AL6 9JU, Tudor Road
![]()
If you are looking to sell your house, let it out, or receive a property valuation, an expert can help you.
Click the button below to get started.


Price Paid in Tudor Road, AL6 9JU, Welwyn West
5 Tudor Road, AL6 9JU, Welwyn West Welwyn
Property 5 has been sold 4 times. The last time it was sold was in 07/06/2021 and the sold price was £380,000.00.
This terraced house, sold as a freehold on 07/06/2021, is a 80 sqm mid-terrace house with an EPC rating of D.
| Date | Price | Property Type | Tenure | Classification |
|---|---|---|---|---|
| 07/06/2021 | £380,000.00 | Terraced House | freehold | Established Building |
| 05/12/2014 | £310,000.00 | Terraced House | freehold | Established Building |
| 17/12/2010 | £235,000.00 | Terraced House | freehold | Established Building |
| 09/12/1998 | £90,000.00 | Terraced House | freehold | Established Building |
9 Tudor Road, AL6 9JU, Welwyn West Welwyn
Property 9 has been sold 1 time. The last time it was sold was in 21/11/2008 and the sold price was £193,000.00.
This semi detached house, sold as a freehold on 21/11/2008, is a 106 sqm end-terrace house with an EPC rating of C.
| Date | Price | Property Type | Tenure | Classification |
|---|---|---|---|---|
| 21/11/2008 | £193,000.00 | Semi Detached House | freehold | Established Building |
Postcodes in Tudor Road, Welwyn West
Navigate through other locations in Tudor Road, Welwyn West, Welwyn to see more property listings for sale or to rent.
Transport near AL6 9JU, Tudor Road
-
 Welwyn North Station
 -
Welwyn Garden City Station
-
Knebworth Station
-
Hatfield Station
-
Watton-At-Stone Station
House price paid reports for AL6 9JU, Tudor Road
Click on the buttons below to see price paid reports by year or property price:
- Price Paid By Year
Property Price Paid in AL6 9JU, Tudor Road by Year
The average sold property price by year was:
| Year | Average Sold Price | Price Change |
Sold Properties
|
|---|---|---|---|
| 2021 | £380,000 | 18% |
1 Property |
| 2014 | £310,000 | 24% |
1 Property |
| 2010 | £235,000 | 18% |
1 Property |
| 2008 | £193,000 | 53% |
1 Property |
| 1998 | £90,000 | - |
1 Property |