
Houses for sale & to rent in Uxbridge South, Uxbridge
House Prices in Uxbridge South
Properties in this part of Uxbridge South within Uxbridge have an average house price of £396,203.00 and had 396 Property Transactions within the last 3 years¹. This area has 4,870 households² , where the most expensive property was sold for £875,000.00.
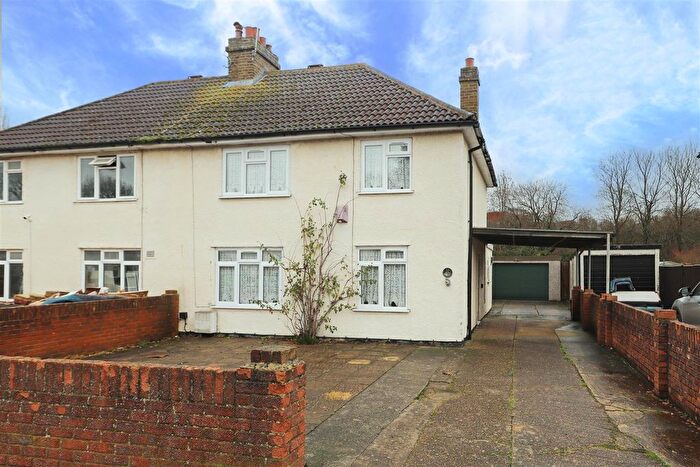
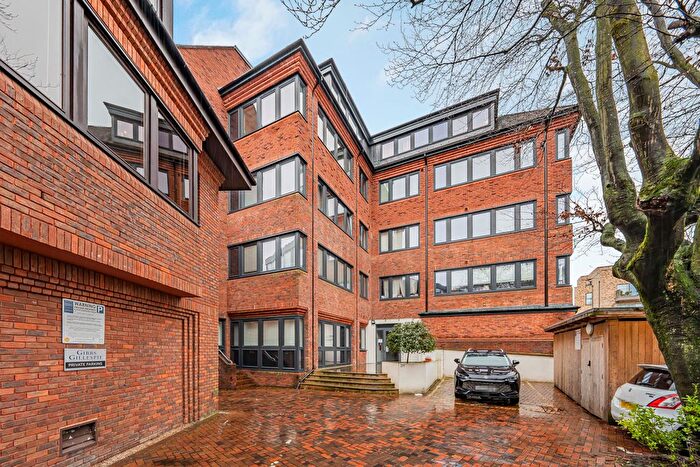
Properties for sale in Uxbridge South
![]()
If you are looking to sell your house, let it out, or receive a property valuation, an expert can help you.
Click the button below to get started.
Roads and Postcodes in Uxbridge South
Navigate through our locations to find the location of your next house in Uxbridge South, Uxbridge for sale or to rent.
Transport near Uxbridge South
-
 Uxbridge Station
 -
Hillingdon Station
-

 West Drayton Station
 -
Iver Station
-
Ickenham Station
-
Denham Station
-
West Ruislip Station
- FAQ
- Price Paid By Year
- Property Type Price
Frequently asked questions about Uxbridge South
What is the average price for a property for sale in Uxbridge South?
The average price for a property for sale in Uxbridge South is £396,203. This amount is 22% lower than the average price in Uxbridge. There are 1,126 property listings for sale in Uxbridge South.
What streets have the most expensive properties for sale in Uxbridge South?
The streets with the most expensive properties for sale in Uxbridge South are Orchard Drive at an average of £722,166, Hamilton Road at an average of £644,222 and Clayton Way at an average of £630,000.
What streets have the most affordable properties for sale in Uxbridge South?
The streets with the most affordable properties for sale in Uxbridge South are Verona Close at an average of £117,661, Lawn Road at an average of £188,666 and Newcourt at an average of £194,157.
Which train stations are available in or near Uxbridge South?
Some of the train stations available in or near Uxbridge South are West Drayton, Iver and Denham.
Which tube stations are available in or near Uxbridge South?
Some of the tube stations available in or near Uxbridge South are Uxbridge, Hillingdon and Ickenham.
Property Price Paid in Uxbridge South by Year
The average sold property price by year was:
| Year | Average Sold Price | Price Change |
Sold Properties
|
|---|---|---|---|
| 2025 | £408,597 | -2% |
105 Properties |
| 2024 | £416,635 | 11% |
135 Properties |
| 2023 | £370,178 | -9% |
156 Properties |
| 2022 | £405,110 | 8% |
183 Properties |
| 2021 | £373,685 | 7% |
243 Properties |
| 2020 | £347,291 | 5% |
158 Properties |
| 2019 | £328,206 | 1% |
391 Properties |
| 2018 | £326,377 | -3% |
305 Properties |
| 2017 | £337,028 | -4% |
138 Properties |
| 2016 | £351,162 | 10% |
169 Properties |
| 2015 | £316,939 | 17% |
172 Properties |
| 2014 | £263,183 | 11% |
179 Properties |
| 2013 | £233,938 | -0,5% |
144 Properties |
| 2012 | £235,021 | 10% |
132 Properties |
| 2011 | £212,612 | -3% |
168 Properties |
| 2010 | £218,908 | 12% |
154 Properties |
| 2009 | £193,497 | -13% |
140 Properties |
| 2008 | £219,557 | -10% |
171 Properties |
| 2007 | £240,995 | 11% |
242 Properties |
| 2006 | £215,292 | 10% |
250 Properties |
| 2005 | £194,069 | 2% |
291 Properties |
| 2004 | £189,969 | 5% |
263 Properties |
| 2003 | £180,041 | 17% |
268 Properties |
| 2002 | £150,216 | 15% |
286 Properties |
| 2001 | £127,241 | 6% |
241 Properties |
| 2000 | £119,898 | 16% |
315 Properties |
| 1999 | £100,299 | 16% |
315 Properties |
| 1998 | £83,931 | 13% |
270 Properties |
| 1997 | £72,913 | 8% |
268 Properties |
| 1996 | £66,726 | -5% |
250 Properties |
| 1995 | £69,926 | - |
163 Properties |
Property Price per Property Type in Uxbridge South
Here you can find historic sold price data in order to help with your property search.
The average Property Paid Price for specific property types in the last three years are:
| Property Type | Average Sold Price | Sold Properties |
|---|---|---|
| Semi Detached House | £511,135.00 | 145 Semi Detached Houses |
| Detached House | £556,300.00 | 25 Detached Houses |
| Terraced House | £415,283.00 | 82 Terraced Houses |
| Flat | £241,813.00 | 144 Flats |