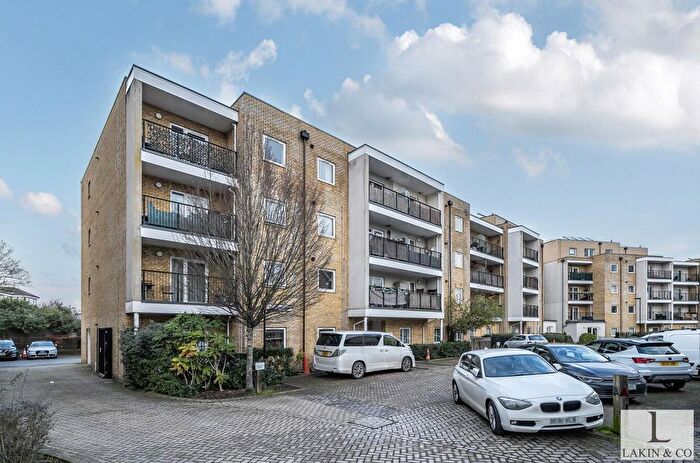
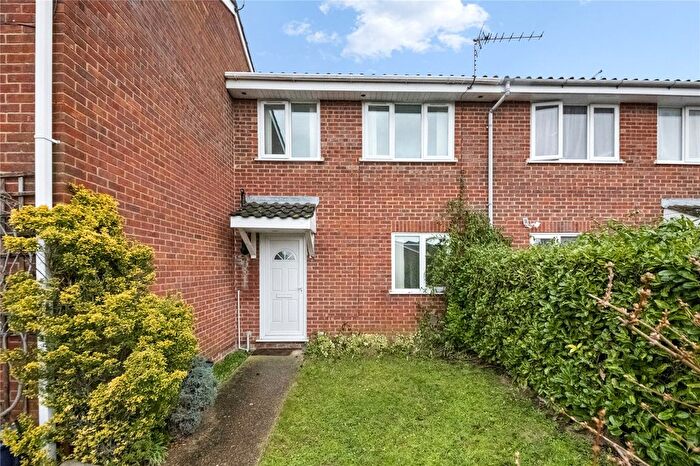
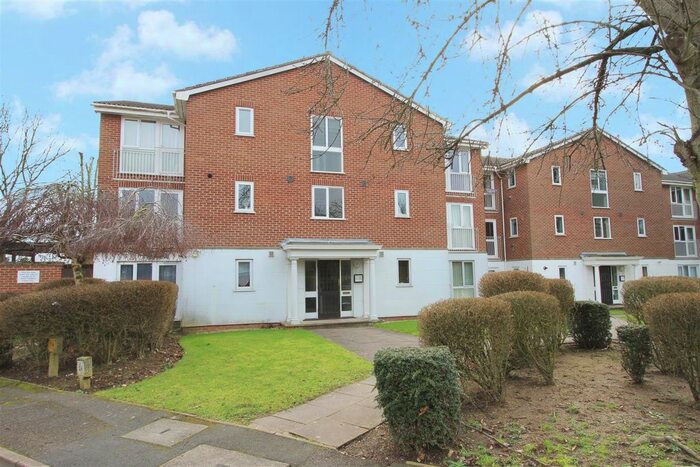
Houses for sale & to rent in West Ruislip, Uxbridge
House Prices in West Ruislip
Properties in this part of West Ruislip within Uxbridge have an average house price of £448,418.00 and had 113 Property Transactions within the last 3 years¹. This area has 767 households² , where the most expensive property was sold for £1,165,000.00.
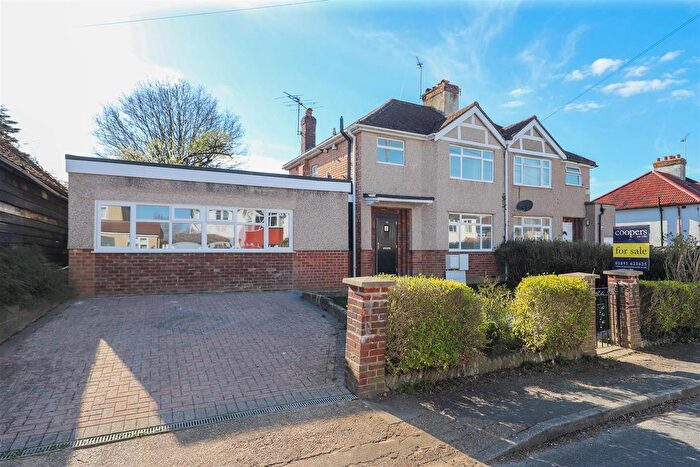
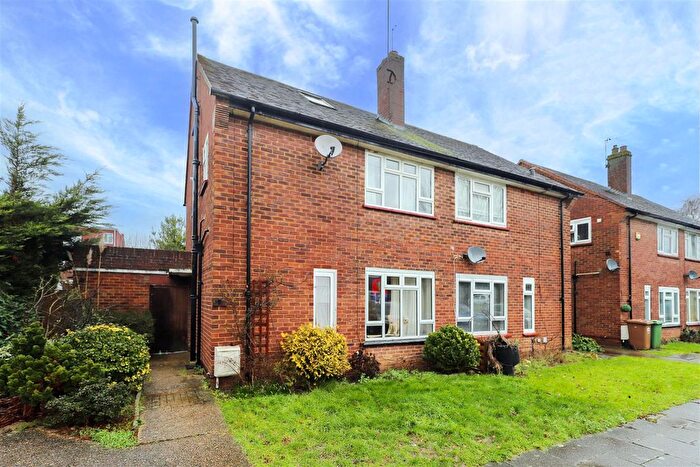
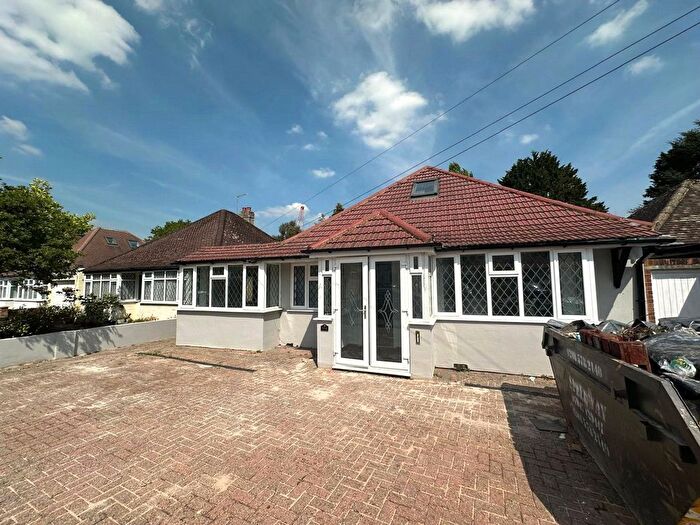
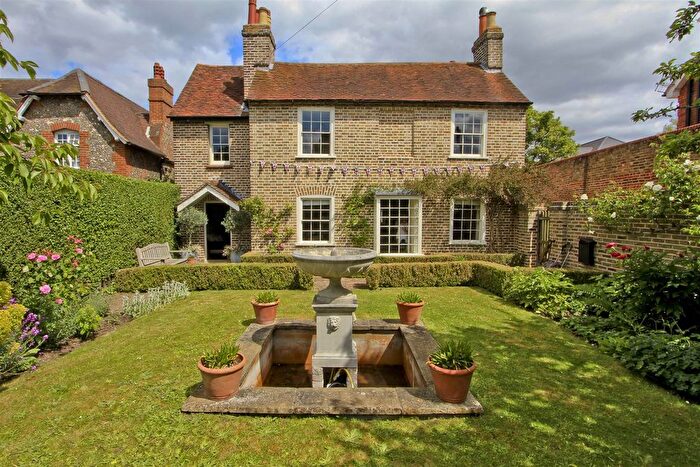
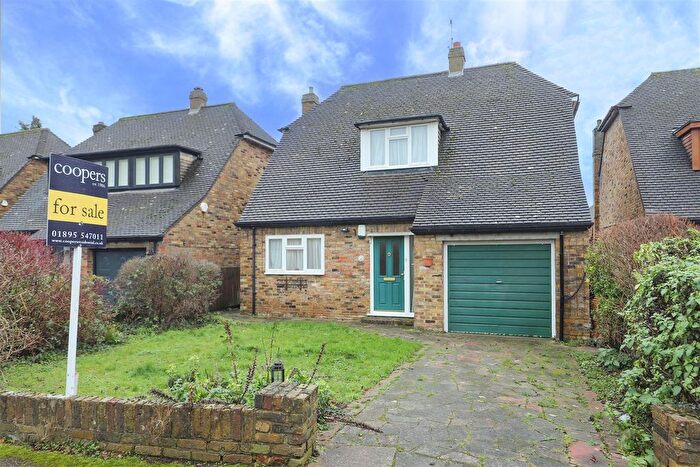
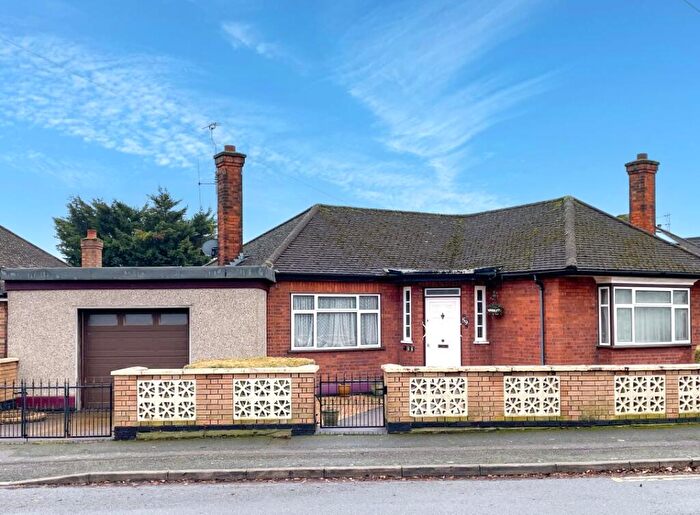
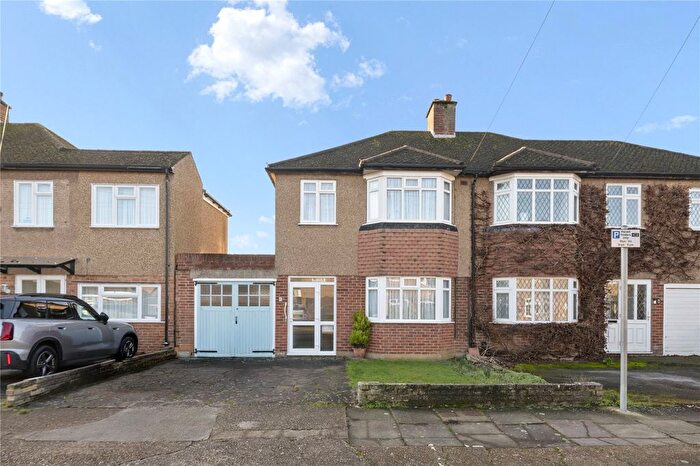
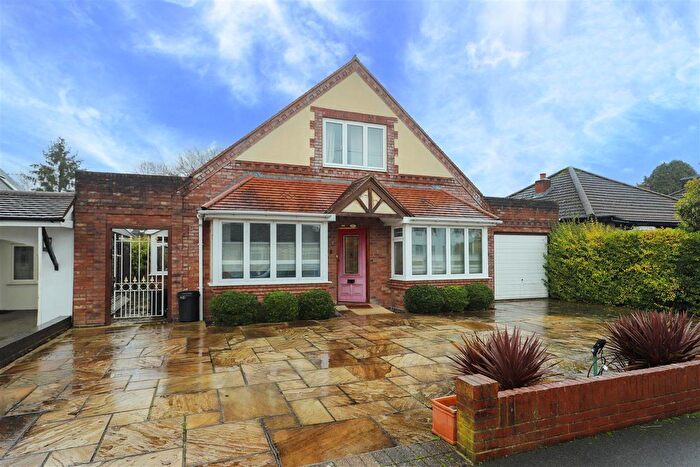
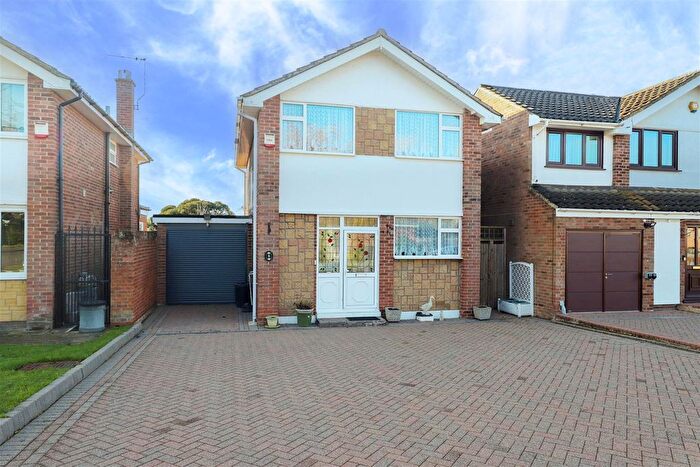
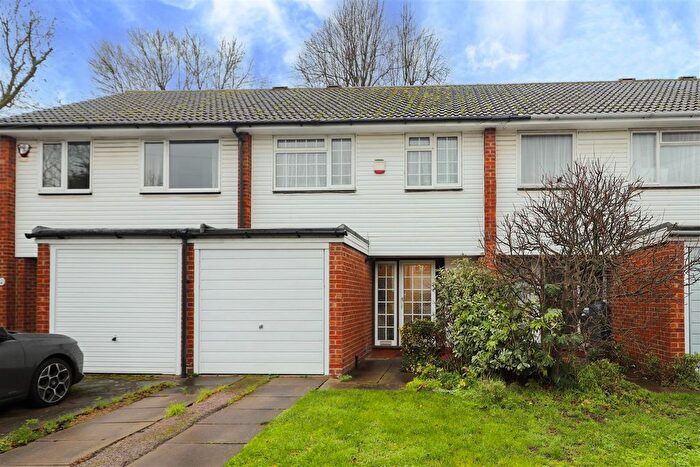
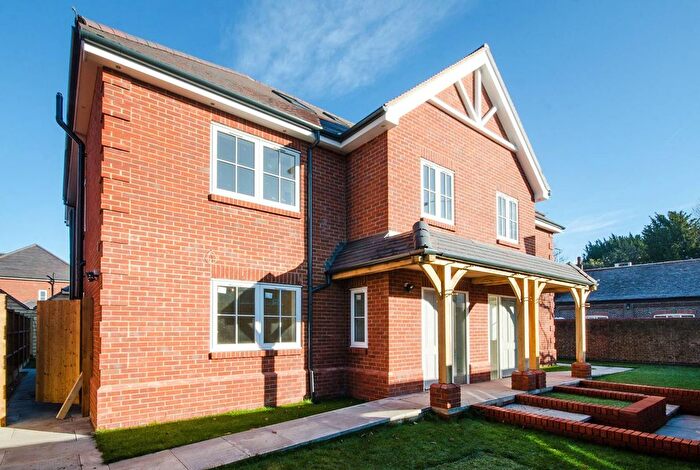
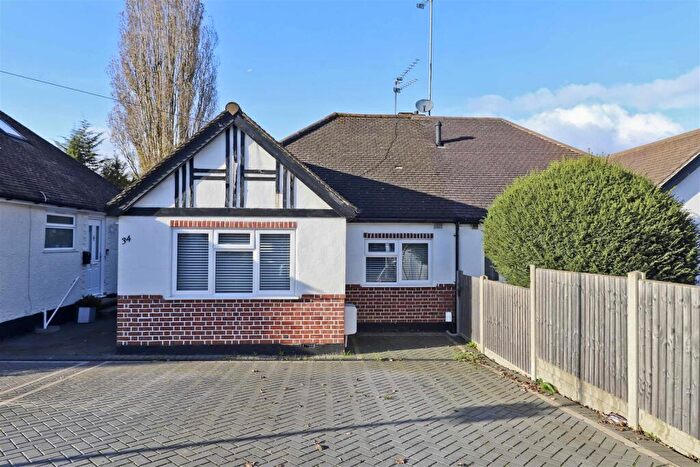
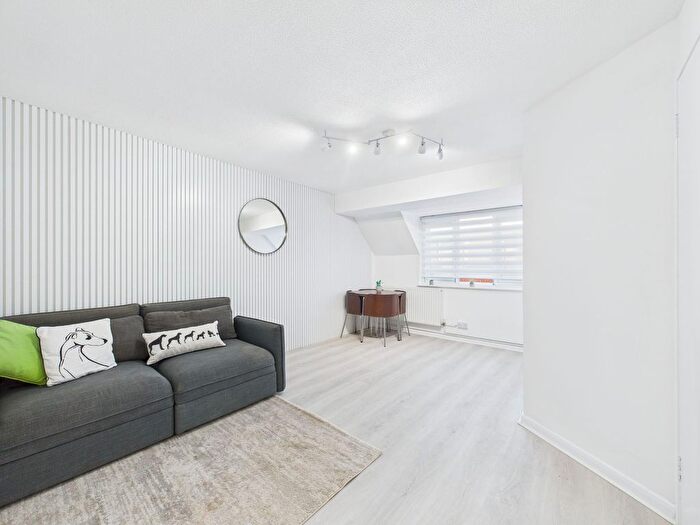
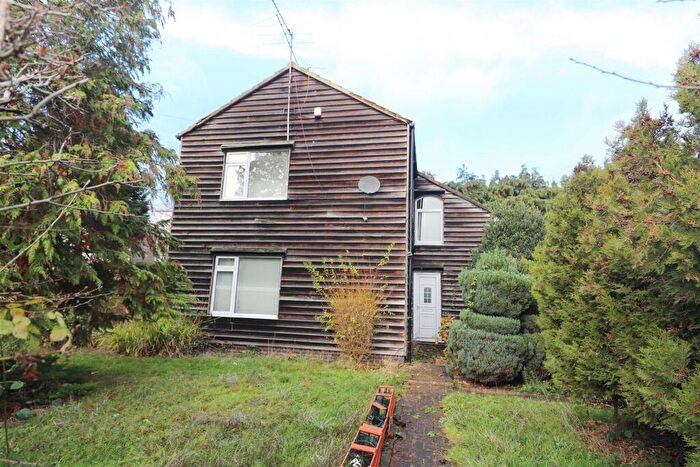
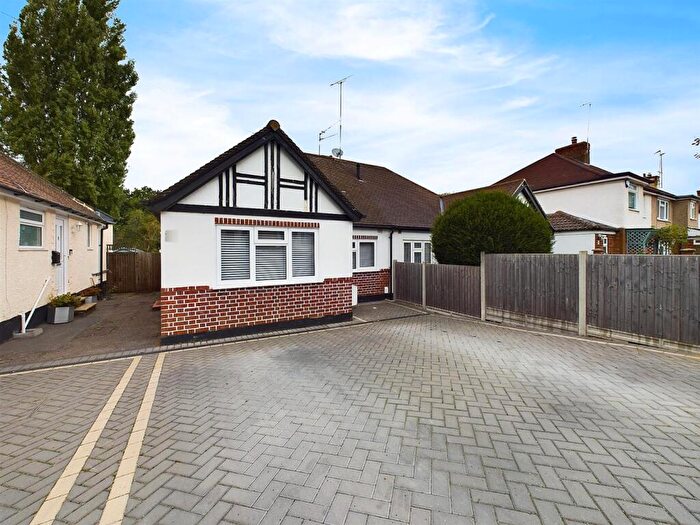
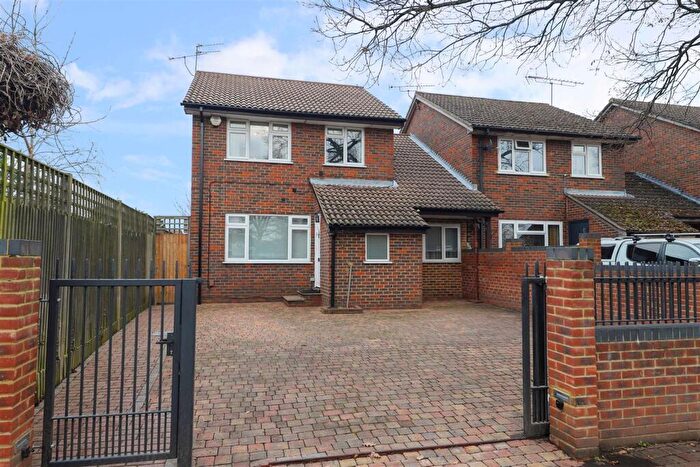
Properties for sale in West Ruislip
Roads and Postcodes in West Ruislip
Navigate through our locations to find the location of your next house in West Ruislip, Uxbridge for sale or to rent.
| Streets | Postcodes |
|---|---|
| Annandale Grove | UB10 8TU |
| Aylsham Drive | UB10 8TL UB10 8UD UB10 8UE UB10 8UF UB10 8UG UB10 8UH UB10 8UJ UB10 8UL UB10 8UN UB10 8UQ |
| Coton Drive | UB10 8FG |
| Coyle Drive | UB10 8FN UB10 8FW |
| Cranston Close | UB10 8TH |
| Cunningham Drive | UB10 8FL |
| Cyrus Terrace | UB10 8FR |
| Fincham Close | UB10 8TP |
| Fine Bush Lane | UB9 6LY |
| Harecroft Lane | UB10 8FD |
| Haslam Close | UB10 8TJ |
| Heacham Avenue | UB10 8TR |
| High Road | UB10 8LF UB10 8LH UB10 8LQ UB10 8LB UB10 8LG |
| Josiah Drive | UB10 8FB UB10 8FF UB10 8FH |
| Kenmare Close | UB10 8FP |
| Melville Close | UB10 8TY UB10 8TZ |
| Narborough Close | UB10 8TN |
| Nithsdale Grove | UB10 8TX |
| Oak Avenue | UB10 8LP UB10 8LR UB10 8UT |
| Pentland Way | UB10 8TS |
| Perkins Gardens | UB10 8FQ UB10 8FT UB10 8FZ |
| Storey Close | UB10 8FE |
| Summer Gardens | UB10 8FS |
| Tayfield Close | UB10 8XA |
| The Green | UB10 8LL |
| The Greenway | UB10 8LA UB10 8LS UB10 8LT UB10 8LU UB10 8LX |
| Thorpland Avenue | UB10 8TQ UB10 8TW |
| Truesdales | UB10 8FX UB10 8FY UB10 8FJ |
| Tweeddale Grove | UB10 8TT |
Transport near West Ruislip
-
West Ruislip Station
-
Ickenham Station
-
Ruislip Station
-
Hillingdon Station
-
Ruislip Manor Station
-
Ruislip Gardens Station
-
South Ruislip Station
-
Eastcote Station
-
Uxbridge Station
-
Northwood Hills Station
- FAQ
- Price Paid By Year
- Property Type Price
Frequently asked questions about West Ruislip
What is the average price for a property for sale in West Ruislip?
The average price for a property for sale in West Ruislip is £448,418. This amount is 11% lower than the average price in Uxbridge. There are 931 property listings for sale in West Ruislip.
What streets have the most expensive properties for sale in West Ruislip?
The streets with the most expensive properties for sale in West Ruislip are Harecroft Lane at an average of £1,182,500, The Green at an average of £1,120,000 and Oak Avenue at an average of £985,000.
What streets have the most affordable properties for sale in West Ruislip?
The streets with the most affordable properties for sale in West Ruislip are Coyle Drive at an average of £275,437, Josiah Drive at an average of £288,000 and Cranston Close at an average of £339,683.
Which train stations are available in or near West Ruislip?
Some of the train stations available in or near West Ruislip are West Ruislip and South Ruislip.
Which tube stations are available in or near West Ruislip?
Some of the tube stations available in or near West Ruislip are West Ruislip, Ickenham and Ruislip.
Property Price Paid in West Ruislip by Year
The average sold property price by year was:
| Year | Average Sold Price | Price Change |
Sold Properties
|
|---|---|---|---|
| 2025 | £487,206 | 5% |
29 Properties |
| 2024 | £464,063 | 14% |
47 Properties |
| 2023 | £398,141 | -14% |
37 Properties |
| 2022 | £454,367 | -3% |
51 Properties |
| 2021 | £467,404 | 0,3% |
55 Properties |
| 2020 | £466,038 | 20% |
39 Properties |
| 2019 | £371,199 | -6% |
30 Properties |
| 2018 | £391,747 | -21% |
96 Properties |
| 2017 | £474,292 | 9% |
134 Properties |
| 2016 | £430,235 | 17% |
185 Properties |
| 2015 | £358,029 | -7% |
46 Properties |
| 2014 | £382,542 | -4% |
38 Properties |
| 2013 | £396,677 | -4% |
35 Properties |
| 2012 | £412,925 | -7% |
88 Properties |
| 2011 | £441,068 | 28% |
71 Properties |
| 2010 | £319,293 | 24% |
34 Properties |
| 2009 | £241,248 | -7% |
29 Properties |
| 2008 | £257,957 | -0,1% |
13 Properties |
| 2007 | £258,323 | 10% |
58 Properties |
| 2006 | £232,168 | 7% |
60 Properties |
| 2005 | £216,373 | 9% |
53 Properties |
| 2004 | £197,401 | 3% |
51 Properties |
| 2003 | £191,126 | 18% |
56 Properties |
| 2002 | £156,375 | 15% |
57 Properties |
| 2001 | £132,998 | 3% |
44 Properties |
| 2000 | £129,294 | 8% |
67 Properties |
| 1999 | £118,819 | 13% |
74 Properties |
| 1998 | £103,206 | 21% |
54 Properties |
| 1997 | £81,759 | 8% |
63 Properties |
| 1996 | £75,509 | 0,3% |
77 Properties |
| 1995 | £75,245 | - |
43 Properties |
Property Price per Property Type in West Ruislip
Here you can find historic sold price data in order to help with your property search.
The average Property Paid Price for specific property types in the last three years are:
| Property Type | Average Sold Price | Sold Properties |
|---|---|---|
| Semi Detached House | £503,166.00 | 9 Semi Detached Houses |
| Detached House | £889,642.00 | 14 Detached Houses |
| Terraced House | £520,360.00 | 25 Terraced Houses |
| Flat | £318,134.00 | 65 Flats |

