
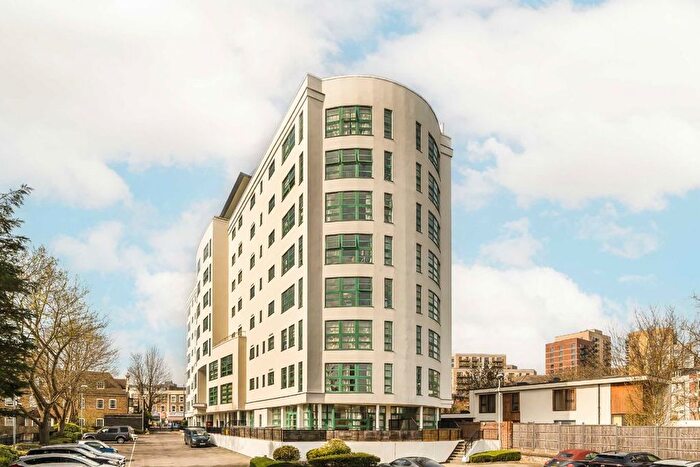
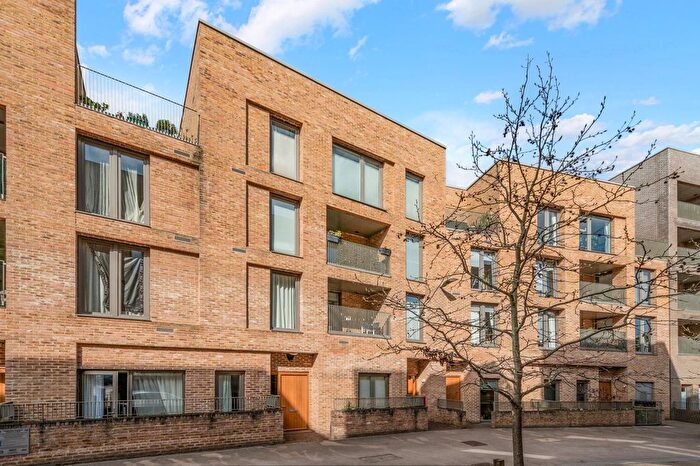
Houses for sale & to rent in Syon, Brentford
House Prices in Syon
Properties in this part of Syon within Brentford have an average house price of £486k and had 221 Property Transactions within the last 3 years¹. This area has 3,111 households² , where the most expensive property was sold for £1.98M.
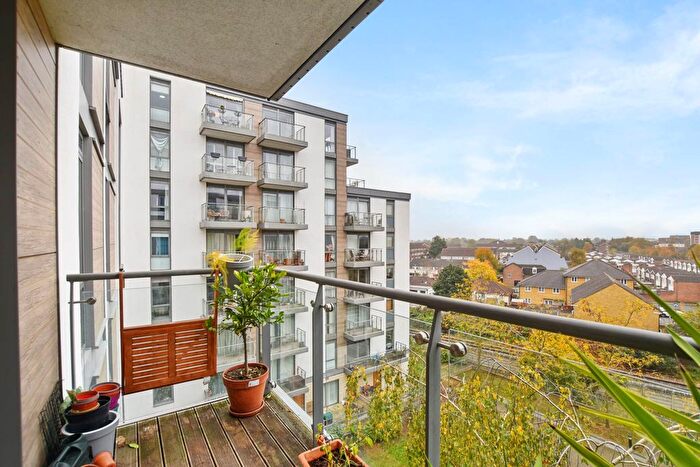
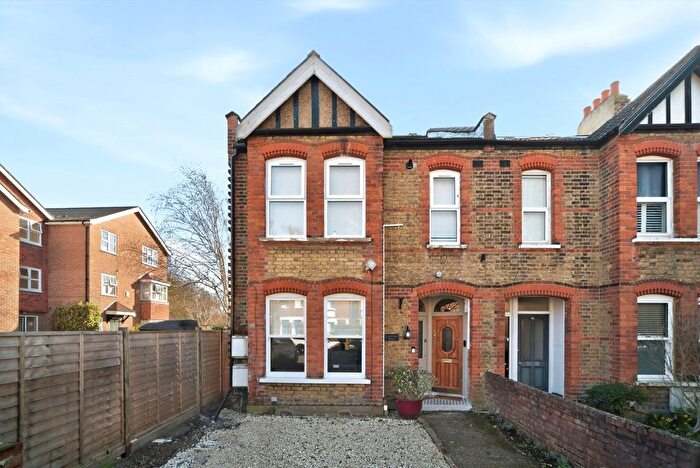
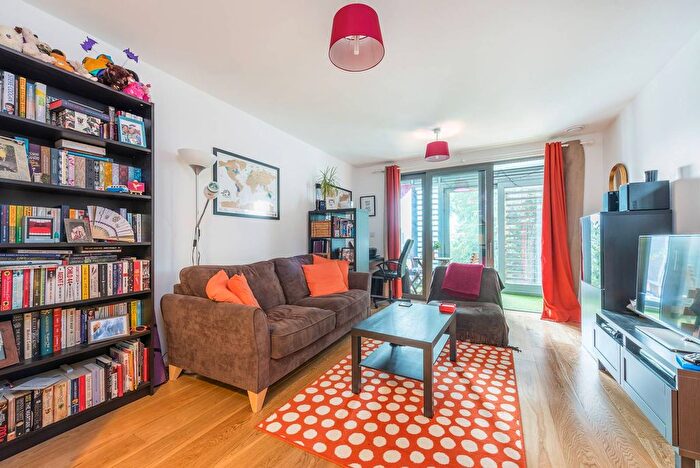
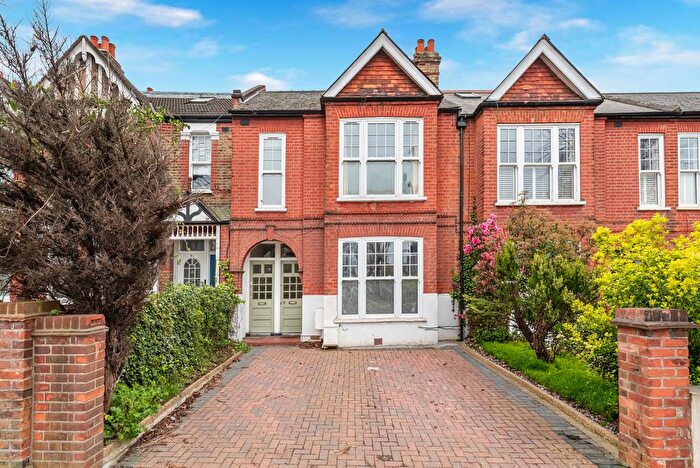
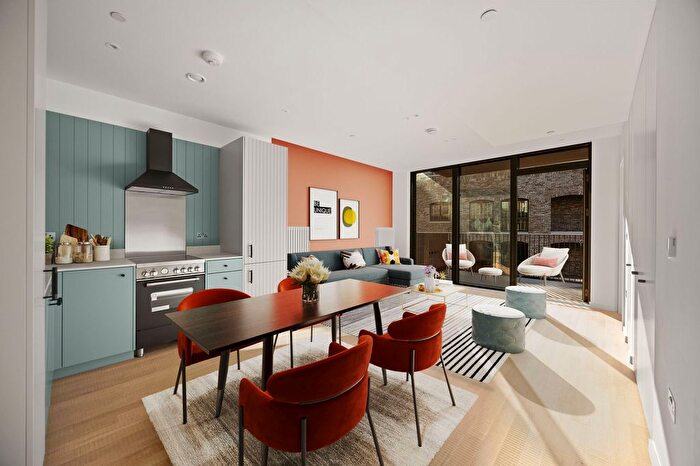
Properties for sale in Syon
![]()
If you are looking to sell your house, let it out, or receive a property valuation, an expert can help you.
Click the button below to get started.
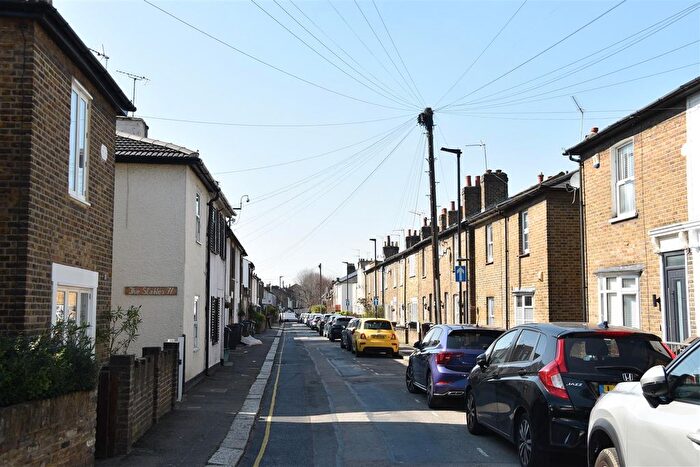
Roads and Postcodes in Syon
Navigate through our locations to find the location of your next house in Syon, Brentford for sale or to rent.
Transport near Syon
-
 Brentford Station
 -
Syon Lane Station
-
Kew Bridge Station
-
 Boston Manor Station
 -
 Kew Gardens Station
 -
Northfields Station
-
South Ealing Station
-
Isleworth Station
-
Richmond Station
-
Gunnersbury Station
- FAQ
- Price Paid By Year
- Property Type Price
Frequently asked questions about Syon
What is the average price for a property for sale in Syon?
The average price for a property for sale in Syon is £486,388. This amount is 3% lower than the average price in Brentford. There are 2,790 property listings for sale in Syon.
What streets have the most expensive properties for sale in Syon?
The streets with the most expensive properties for sale in Syon are The Butts at an average of £1,980,000, Somerset Road at an average of £895,000 and Windmill Road at an average of £890,000.
What streets have the most affordable properties for sale in Syon?
The streets with the most affordable properties for sale in Syon are Commerce Road at an average of £244,000, Barrow Walk at an average of £310,000 and Paddlers Avenue at an average of £331,236.
Which train stations are available in or near Syon?
Some of the train stations available in or near Syon are Brentford, Syon Lane and Kew Bridge.
Which tube stations are available in or near Syon?
Some of the tube stations available in or near Syon are Boston Manor, Kew Gardens and Northfields.
Property Price Paid in Syon by Year
The average sold property price by year was:
| Year | Average Sold Price | Price Change |
Sold Properties
|
|---|---|---|---|
| 2026 | £357,500 | -33% |
2 Properties |
| 2025 | £474,270 | -5% |
72 Properties |
| 2024 | £499,464 | 2% |
80 Properties |
| 2023 | £487,643 | -10% |
67 Properties |
| 2022 | £535,729 | 7% |
112 Properties |
| 2021 | £497,136 | 3% |
136 Properties |
| 2020 | £481,675 | -5% |
75 Properties |
| 2019 | £505,465 | 9% |
109 Properties |
| 2018 | £458,685 | -11% |
174 Properties |
| 2017 | £507,078 | 11% |
134 Properties |
| 2016 | £449,272 | -1% |
138 Properties |
| 2015 | £453,893 | 8% |
230 Properties |
| 2014 | £415,597 | 21% |
289 Properties |
| 2013 | £328,517 | 8% |
103 Properties |
| 2012 | £302,466 | -2% |
101 Properties |
| 2011 | £307,097 | 6% |
76 Properties |
| 2010 | £288,389 | -5% |
69 Properties |
| 2009 | £302,096 | 2% |
51 Properties |
| 2008 | £295,328 | -4% |
55 Properties |
| 2007 | £306,950 | -2% |
176 Properties |
| 2006 | £313,200 | 5% |
189 Properties |
| 2005 | £298,950 | 7% |
182 Properties |
| 2004 | £277,109 | -7% |
280 Properties |
| 2003 | £296,850 | 17% |
270 Properties |
| 2002 | £246,679 | 14% |
251 Properties |
| 2001 | £210,964 | 26% |
153 Properties |
| 2000 | £155,524 | 15% |
62 Properties |
| 1999 | £132,310 | 18% |
96 Properties |
| 1998 | £108,237 | 15% |
63 Properties |
| 1997 | £91,687 | 20% |
111 Properties |
| 1996 | £73,592 | -13% |
64 Properties |
| 1995 | £83,465 | - |
52 Properties |
Property Price per Property Type in Syon
Here you can find historic sold price data in order to help with your property search.
The average Property Paid Price for specific property types in the last three years are:
| Property Type | Average Sold Price | Sold Properties |
|---|---|---|
| Flat | £434,390.00 | 174 Flats |
| Semi Detached House | £766,116.00 | 16 Semi Detached Houses |
| Detached House | £850,000.00 | 1 Detached House |
| Terraced House | £626,666.00 | 30 Terraced Houses |