
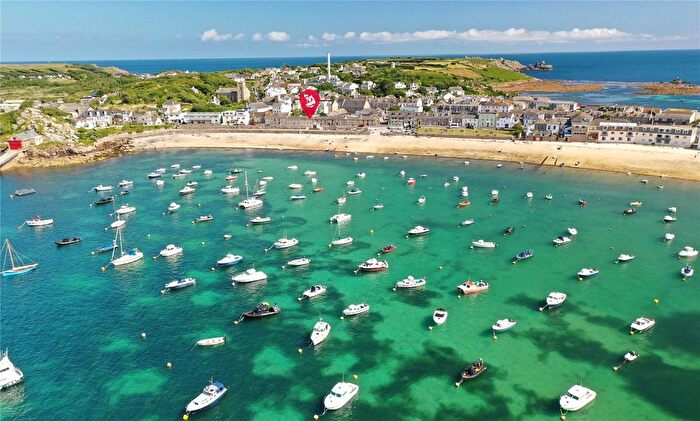
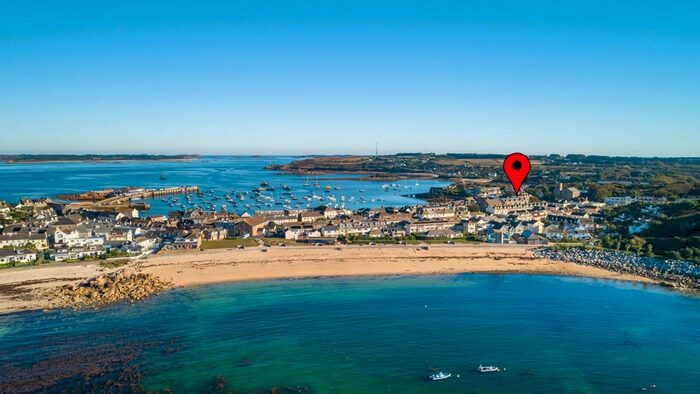
Houses for sale & to rent in St. Marys, Isles Of Scilly
House Prices in St. Marys
Properties in St. Marys have an average house price of £490,177.78 and had 45 Property Transactions within the last 3 years¹.
St. Marys is an area in Isles Of Scilly, Isles of Scilly with 772 households², where the most expensive property was sold for £1,850,000.00.
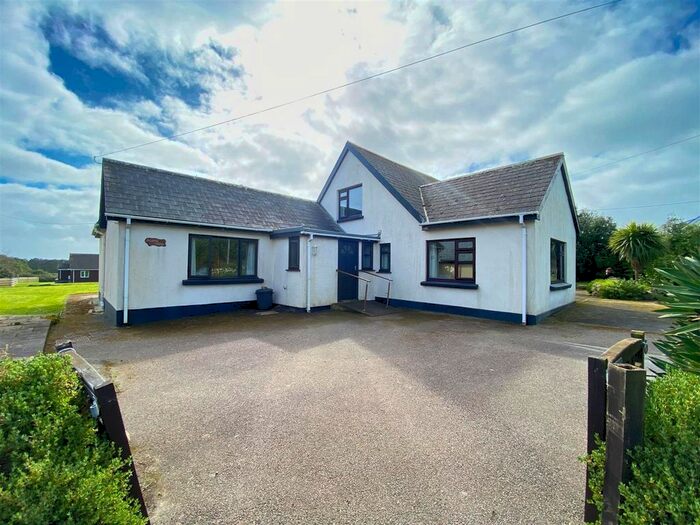
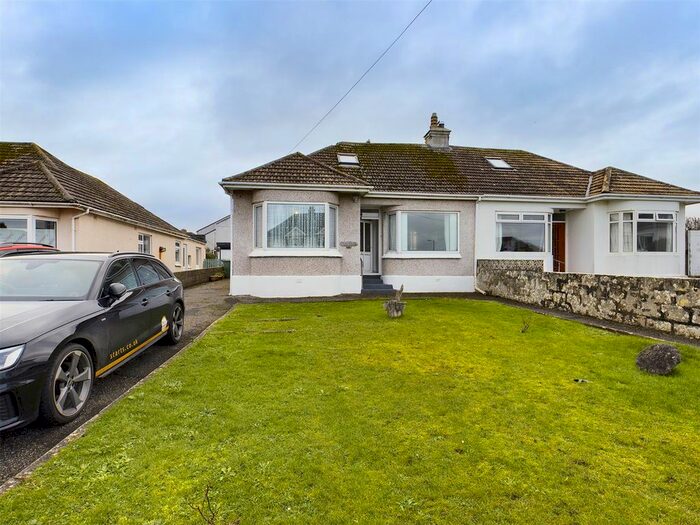
Properties for sale in St. Marys

Previously listed properties in St. Marys


![]()
If you are looking to sell your house, let it out, or receive a property valuation, an expert can help you.
Click the button below to get started.
Roads and Postcodes in St. Marys
Navigate through our locations to find the location of your next house in St. Marys, Isles Of Scilly for sale or to rent.
| Streets | Postcodes |
|---|---|
| Back Lane | TR21 0LA |
| Belmont | TR21 0LE |
| Branksea Close | TR21 0ND |
| Buzza Hill | TR21 0NQ |
| Buzza Street | TR21 0HX TR21 0HW |
| Church Road | TR21 0NA TR21 0NB |
| Church Street | TR21 0JT TR21 0JU TR21 0JP TR21 0JR |
| Coastguard Cottages | TR21 0NR |
| Ennor Close | TR21 0NL |
| Garrison | TR21 0LS TR21 0JA |
| Garrison Lane | TR21 0JD TR21 0JF |
| Holy Vale | TR21 0NT |
| Hospital Lane | TR21 0LQ |
| Hugh Street | TR21 0LL TR21 0LJ TR21 0LR TR21 0PL |
| Jacksons Hill | TR21 0JZ |
| Jerusalem Terrace | TR21 0JH |
| King Edward's Road | TR21 0HE |
| Launceston Close | TR21 0NJ |
| Little Porth | TR21 0JG |
| Lower Strand | TR21 0PS |
| Maypole | TR21 0NU |
| Old Town | TR21 0NH TR21 0NN TR21 0PE |
| Parsons Field | TR21 0JJ |
| Pelistry | TR21 0NX |
| Pilots Retreat | TR21 0PB |
| Porth Mellon | TR21 0JY |
| Porthcressa | TR21 0JQ |
| Porthcressa Road | TR21 0JL |
| Porthcressa Terrace | TR21 0JW |
| Rams Valley | TR21 0JX |
| Sally Port | TR21 0JE |
| Silver Street | TR21 0PZ |
| Strand | TR21 0PT |
| Telegraph | TR21 0NP |
| The Bank | TR21 0HY |
| The Parade | TR21 0LP |
| The Quay | TR21 0HU |
| Thorofare | TR21 0LN |
| Trench Lane | TR21 0PA |
| Well Lane | TR21 0HZ |
| Wellcross | TR21 0PU |
| TR21 0AD TR21 0NE TR21 0NF TR21 0NG TR21 0NS TR21 0NW TR21 0AB TR21 0JN TR21 0LW TR21 0NY TR21 0NZ TR21 0PP TR21 0QA TR21 0SA TR21 0SB TR21 0SD TR21 0SE TR21 0SF |
Transport near St. Marys
-
 Penzance Station
 -
St.Ives Station
-
St.Erth Station
-
Carbis Bay Station
-
Lelant Saltings Station
-
Lelant Station
-
Hayle Station
-
Camborne Station
- FAQ
- Price Paid By Year
- Property Type Price
Frequently asked questions about St. Marys
What is the average price for a property for sale in St. Marys?
The average price for a property for sale in St. Marys is £490,178. This amount is 0.22% higher than the average price in Isles Of Scilly. There are 8 property listings for sale in St. Marys.
What streets have the most expensive properties for sale in St. Marys?
The streets with the most expensive properties for sale in St. Marys are Jacksons Hill at an average of £805,000, Porthcressa Road at an average of £687,500 and Rams Valley at an average of £580,000.
What streets have the most affordable properties for sale in St. Marys?
The streets with the most affordable properties for sale in St. Marys are Strand at an average of £195,000, The Bank at an average of £245,000 and Church Street at an average of £265,000.
Which train stations are available in or near St. Marys?
Some of the train stations available in or near St. Marys are Penzance, St.Ives and St.Erth.
Property Price Paid in St. Marys by Year
The average sold property price by year was:
| Year | Average Sold Price | Price Change |
Sold Properties
|
|---|---|---|---|
| 2025 | £746,250 | 37% |
4 Properties |
| 2024 | £472,500 | -11% |
15 Properties |
| 2023 | £522,633.33 | 28% |
15 Properties |
| 2022 | £376,909.09 | -8% |
11 Properties |
| 2021 | £406,717.39 | 4% |
23 Properties |
| 2020 | £389,490.53 | 14% |
19 Properties |
| 2019 | £335,325 | -3% |
20 Properties |
| 2018 | £344,311.43 | 11% |
35 Properties |
| 2017 | £305,389.13 | 8% |
23 Properties |
| 2016 | £281,770 | -2% |
24 Properties |
| 2015 | £287,105.26 | 0,1% |
19 Properties |
| 2014 | £286,888.89 | -4% |
18 Properties |
| 2013 | £297,045 | -24% |
10 Properties |
| 2012 | £367,583 | 14% |
12 Properties |
| 2011 | £316,662 | 2% |
16 Properties |
| 2010 | £311,100 | -32% |
10 Properties |
| 2009 | £409,461 | 18% |
13 Properties |
| 2008 | £335,000 | -14% |
8 Properties |
| 2007 | £382,600 | -1% |
20 Properties |
| 2006 | £387,003 | 21% |
25 Properties |
| 2005 | £305,616 | 6% |
15 Properties |
| 2004 | £287,717 | -3% |
24 Properties |
| 2003 | £295,891 | 24% |
27 Properties |
| 2002 | £224,906 | 18% |
16 Properties |
| 2001 | £184,500 | -15% |
17 Properties |
| 2000 | £211,618 | 18% |
22 Properties |
| 1999 | £172,683 | 11% |
24 Properties |
| 1998 | £153,742 | 17% |
33 Properties |
| 1997 | £127,888 | 12% |
38 Properties |
| 1996 | £112,004 | -6% |
35 Properties |
| 1995 | £119,115 | - |
13 Properties |
Property Price per Property Type in St. Marys
Here you can find historic sold price data in order to help with your property search.
The average Property Paid Price for specific property types in the last three years are:
| Property Type | Average Sold Price | Sold Properties |
|---|---|---|
| Semi Detached House | £472,000.00 | 5 Semi Detached Houses |
| Detached House | £735,166.67 | 15 Detached Houses |
| Terraced House | £475,800.00 | 10 Terraced Houses |
| Flat | £260,833.00 | 15 Flats |