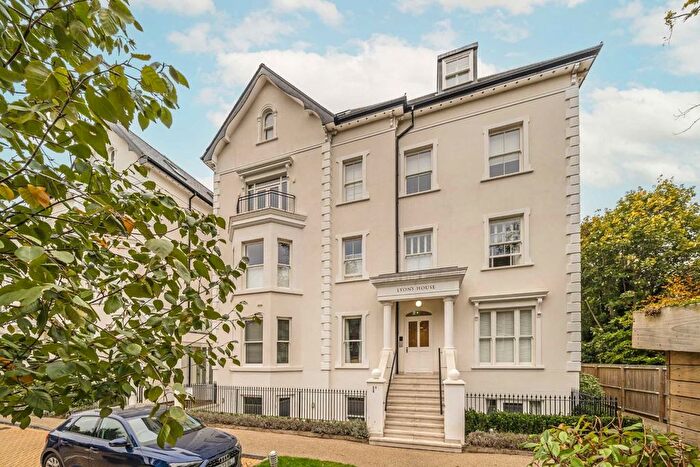
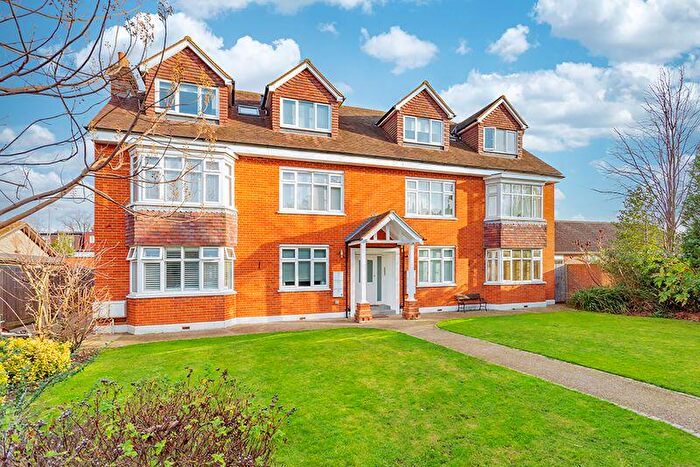
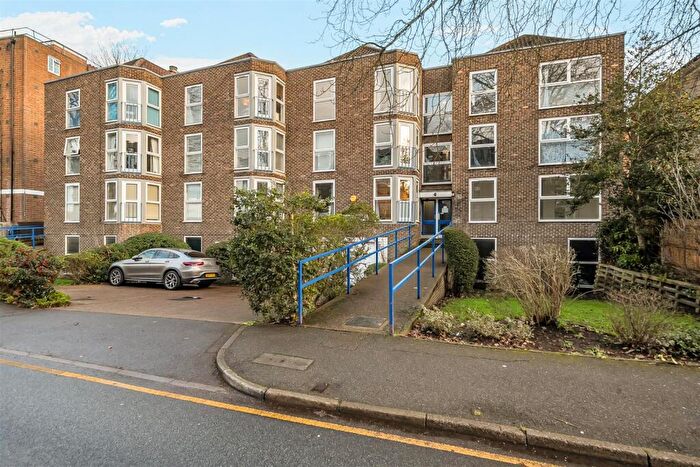
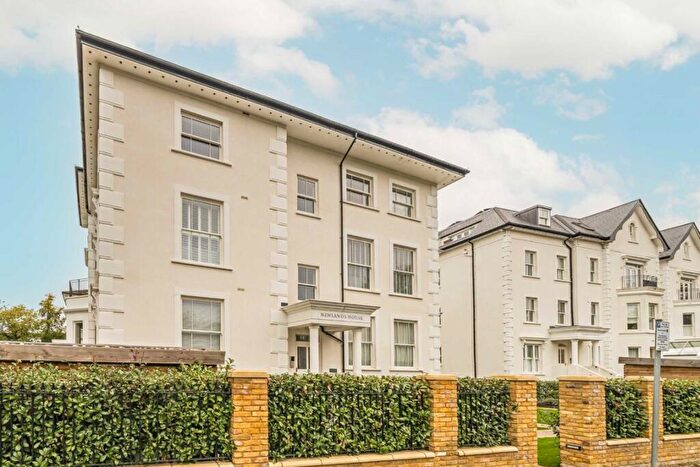
Houses for sale & to rent in Berrylands, Surbiton
House Prices in Berrylands
Properties in this part of Berrylands within Surbiton have an average house price of £575,849.00 and had 534 Property Transactions within the last 3 years¹. This area has 4,328 households² , where the most expensive property was sold for £1,965,000.00.
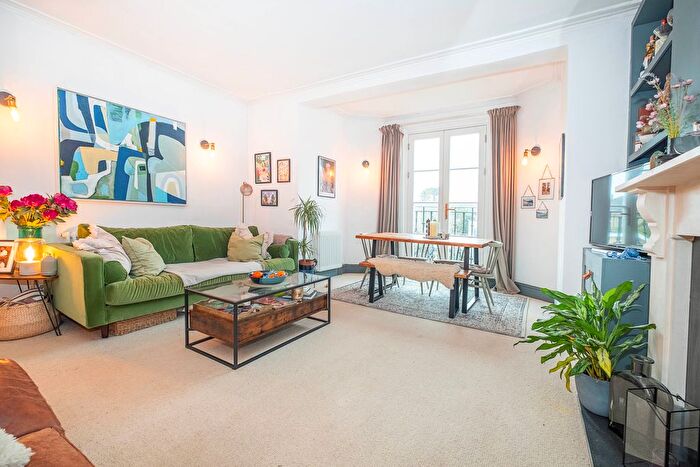
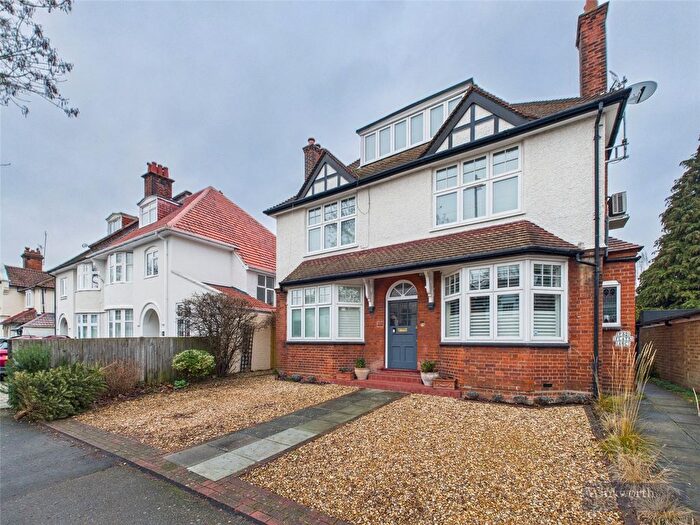
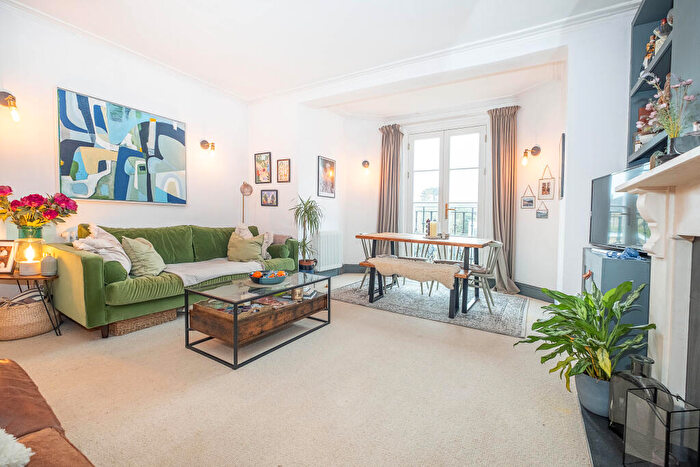
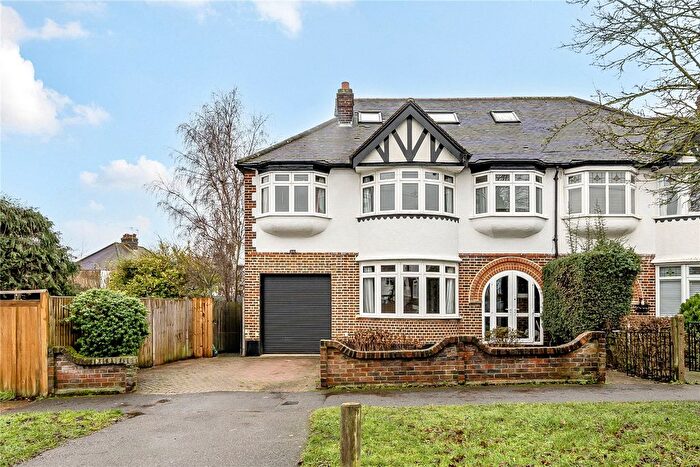
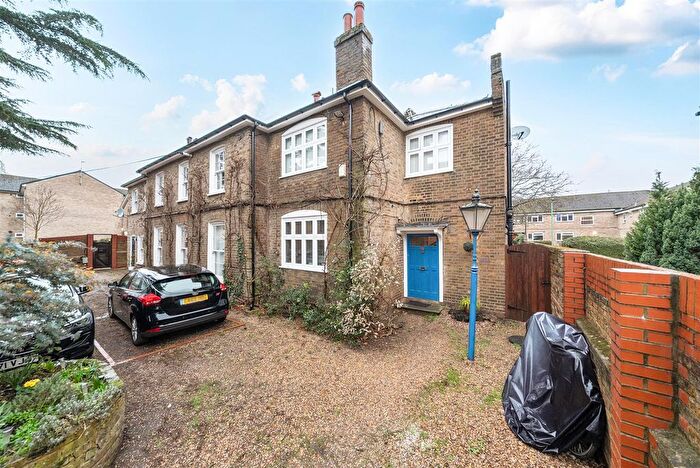
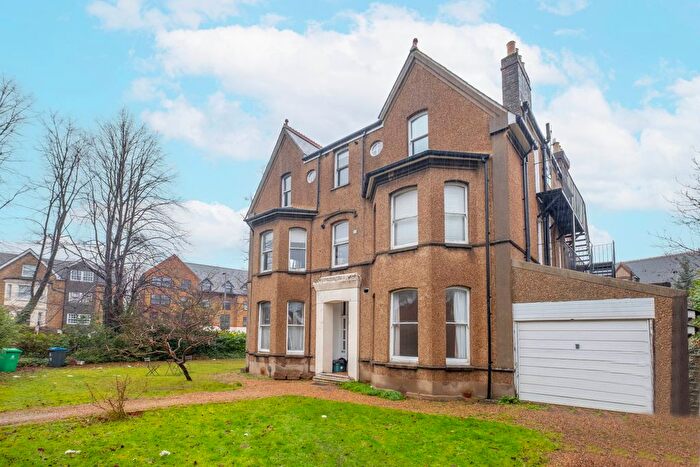
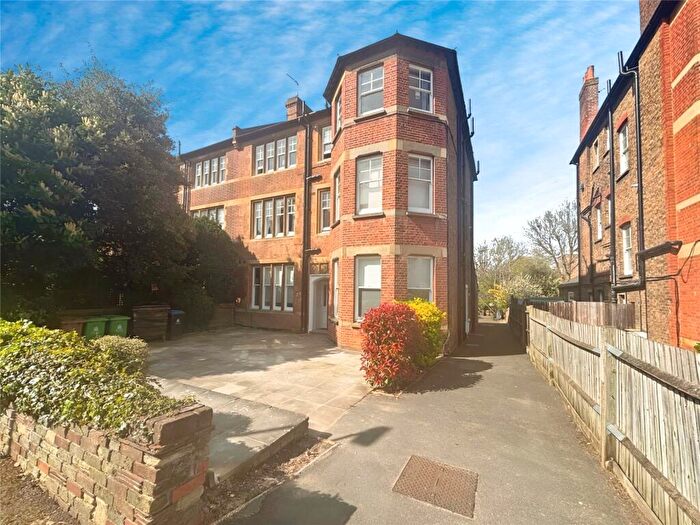
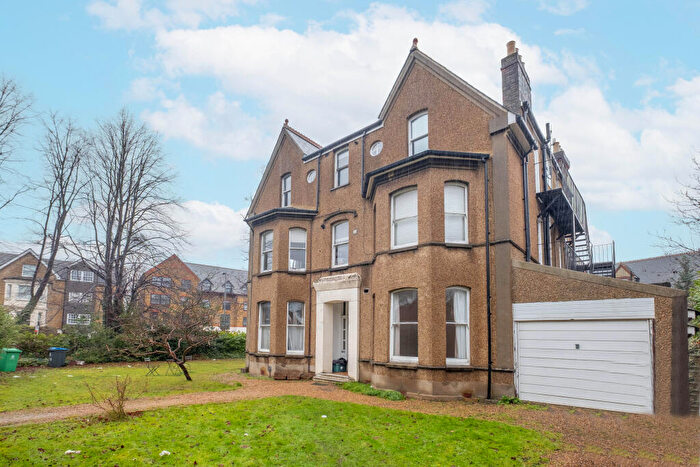
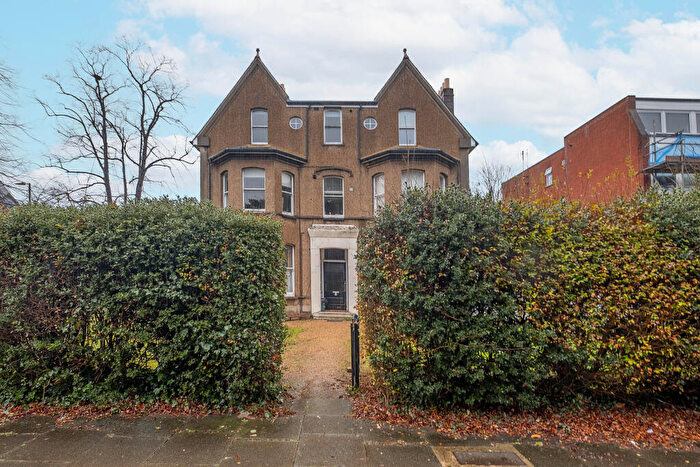
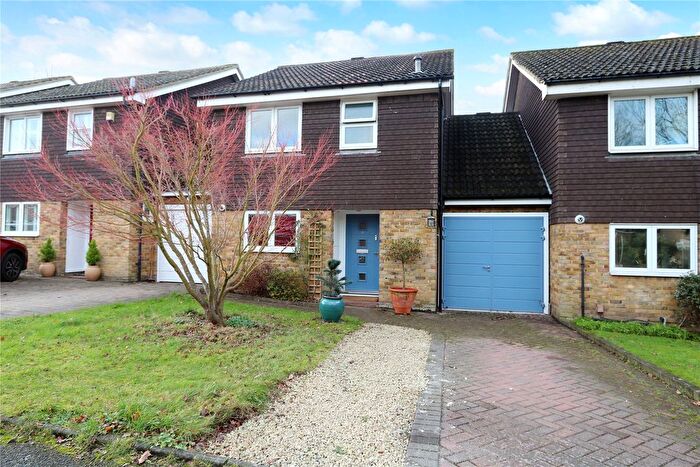
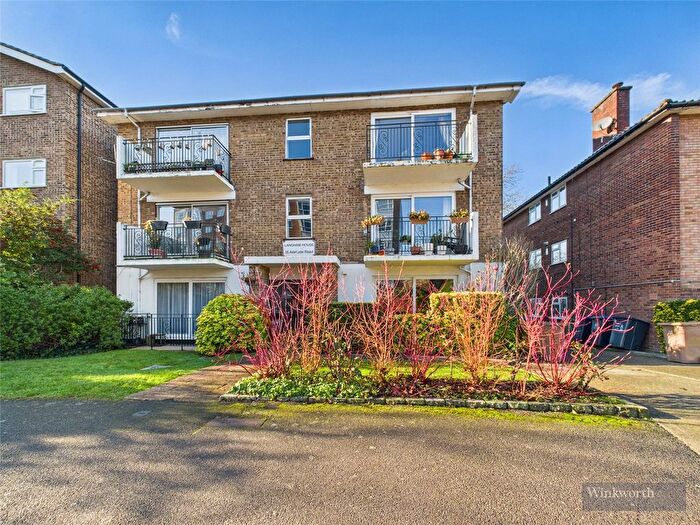
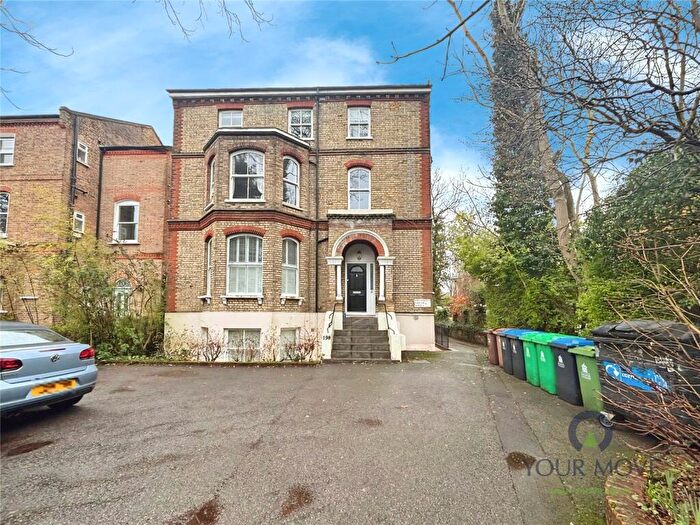
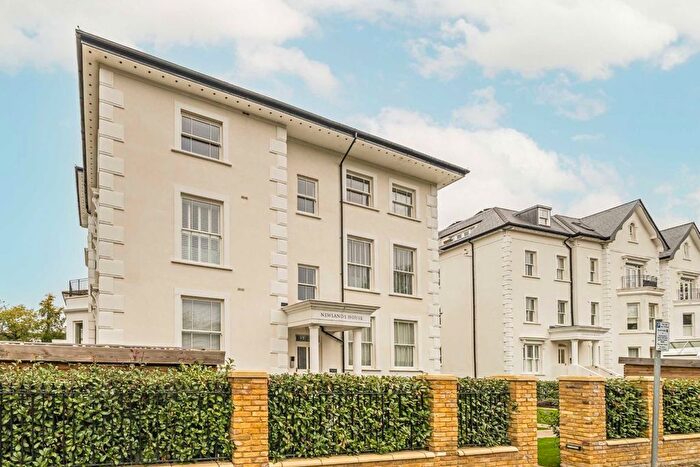
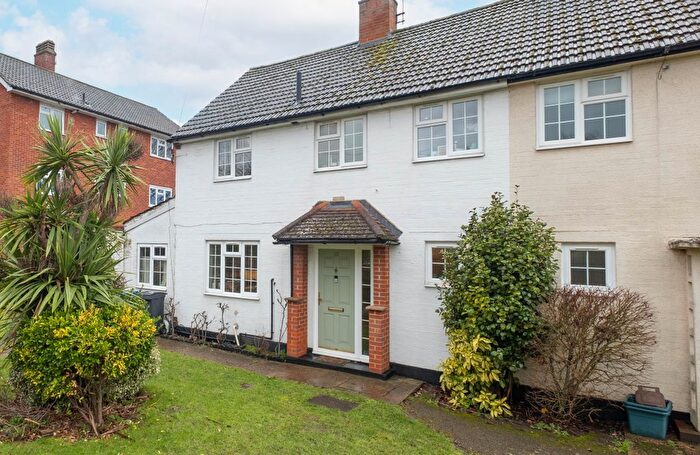
Properties for sale in Berrylands
Roads and Postcodes in Berrylands
Navigate through our locations to find the location of your next house in Berrylands, Surbiton for sale or to rent.
Transport near Berrylands
-
Surbiton Station
-
Berrylands Station
-
Tolworth Station
-
Norbiton Station
-
Malden Manor Station
-
Kingston Station
-
New Malden Station
-
Hampton Wick Station
-
Chessington North Station
-
Thames Ditton Station
- FAQ
- Price Paid By Year
- Property Type Price
Frequently asked questions about Berrylands
What is the average price for a property for sale in Berrylands?
The average price for a property for sale in Berrylands is £575,849. This amount is 0.91% higher than the average price in Surbiton. There are 4,047 property listings for sale in Berrylands.
What streets have the most expensive properties for sale in Berrylands?
The streets with the most expensive properties for sale in Berrylands are Seymour Gardens at an average of £1,355,333, The Crest at an average of £1,319,166 and Pine Walk at an average of £1,256,375.
What streets have the most affordable properties for sale in Berrylands?
The streets with the most affordable properties for sale in Berrylands are Lysander Gardens at an average of £314,375, Ewell Road at an average of £350,215 and Hollyfield Road at an average of £397,857.
Which train stations are available in or near Berrylands?
Some of the train stations available in or near Berrylands are Surbiton, Berrylands and Tolworth.
Property Price Paid in Berrylands by Year
The average sold property price by year was:
| Year | Average Sold Price | Price Change |
Sold Properties
|
|---|---|---|---|
| 2025 | £603,414 | 5% |
98 Properties |
| 2024 | £571,352 | -2% |
137 Properties |
| 2023 | £581,461 | 4% |
125 Properties |
| 2022 | £559,832 | 3% |
174 Properties |
| 2021 | £545,124 | 1% |
224 Properties |
| 2020 | £541,062 | 6% |
104 Properties |
| 2019 | £507,692 | -9% |
140 Properties |
| 2018 | £555,577 | -1% |
144 Properties |
| 2017 | £559,318 | 9% |
153 Properties |
| 2016 | £508,081 | 8% |
160 Properties |
| 2015 | £469,601 | 7% |
170 Properties |
| 2014 | £434,678 | 17% |
180 Properties |
| 2013 | £360,436 | -4% |
179 Properties |
| 2012 | £373,822 | 6% |
151 Properties |
| 2011 | £352,932 | 5% |
141 Properties |
| 2010 | £335,641 | 8% |
149 Properties |
| 2009 | £308,494 | -3% |
114 Properties |
| 2008 | £318,481 | -8% |
106 Properties |
| 2007 | £342,706 | 20% |
211 Properties |
| 2006 | £274,660 | 1% |
300 Properties |
| 2005 | £271,200 | 15% |
216 Properties |
| 2004 | £230,458 | -4% |
234 Properties |
| 2003 | £239,130 | 12% |
244 Properties |
| 2002 | £211,242 | 14% |
297 Properties |
| 2001 | £182,514 | 12% |
266 Properties |
| 2000 | £159,957 | 13% |
258 Properties |
| 1999 | £139,093 | 17% |
264 Properties |
| 1998 | £115,591 | 11% |
244 Properties |
| 1997 | £103,182 | 11% |
253 Properties |
| 1996 | £92,042 | 6% |
203 Properties |
| 1995 | £86,880 | - |
205 Properties |
Property Price per Property Type in Berrylands
Here you can find historic sold price data in order to help with your property search.
The average Property Paid Price for specific property types in the last three years are:
| Property Type | Average Sold Price | Sold Properties |
|---|---|---|
| Flat | £382,241.00 | 306 Flats |
| Semi Detached House | £840,365.00 | 97 Semi Detached Houses |
| Detached House | £1,112,751.00 | 45 Detached Houses |
| Terraced House | £685,447.00 | 86 Terraced Houses |

