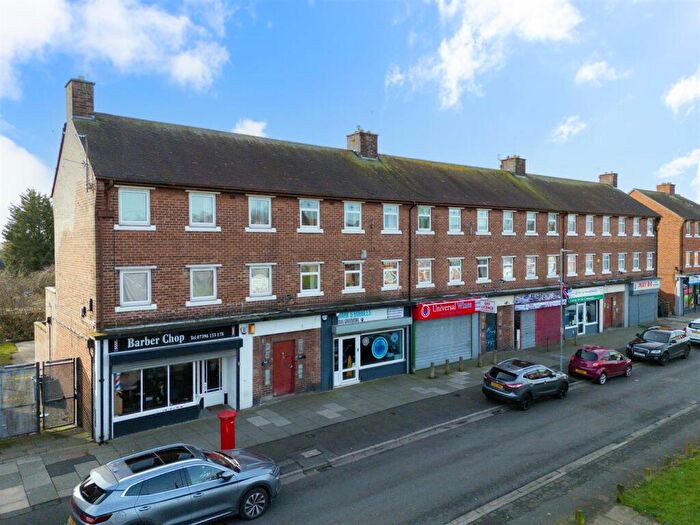
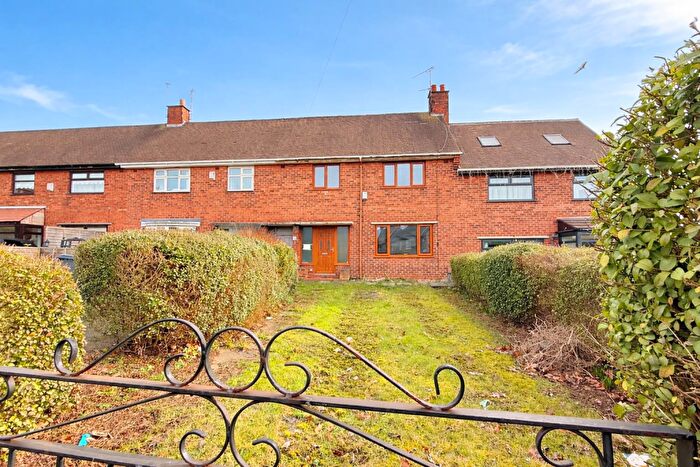
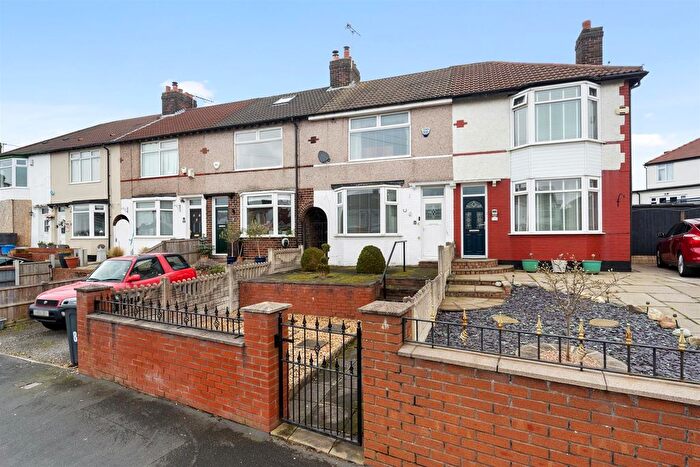
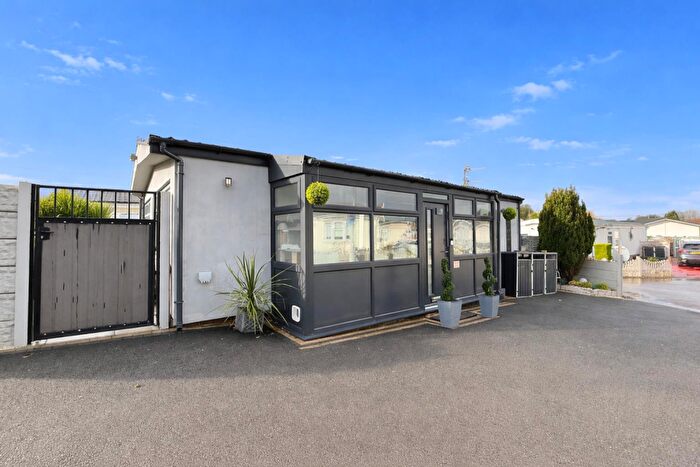
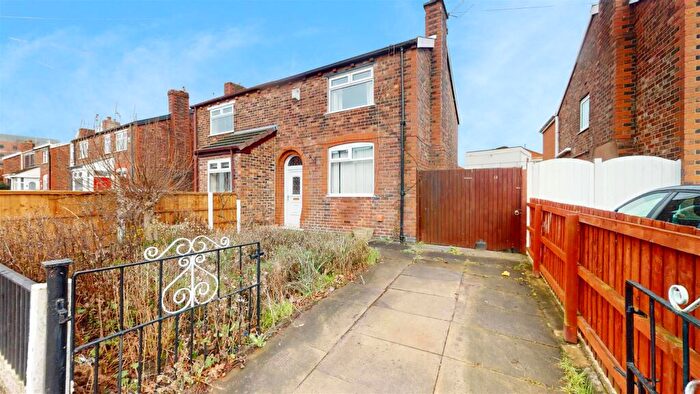
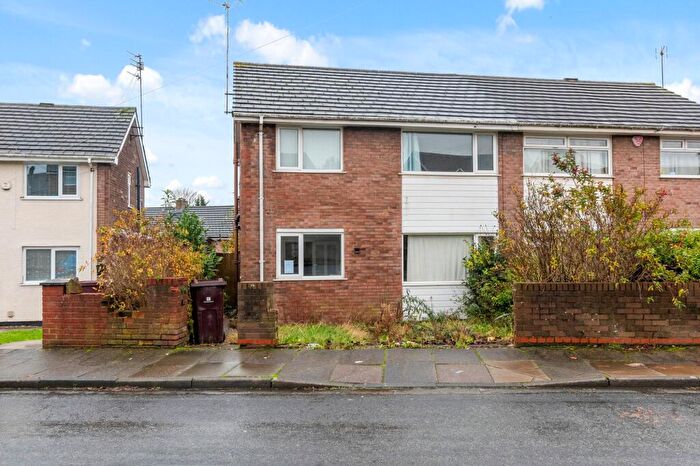
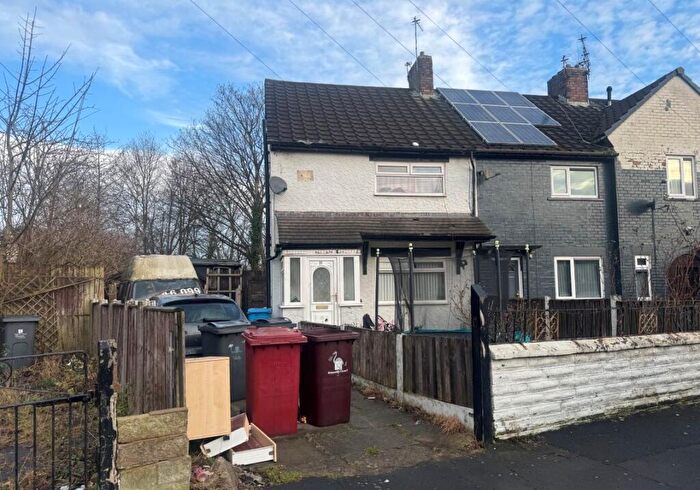
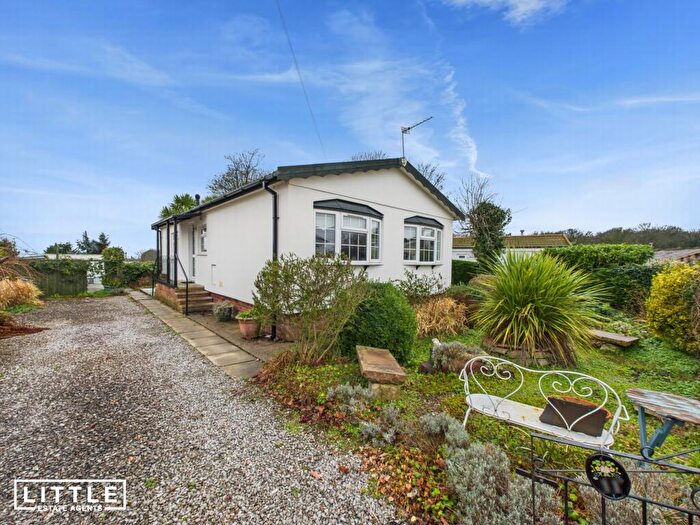
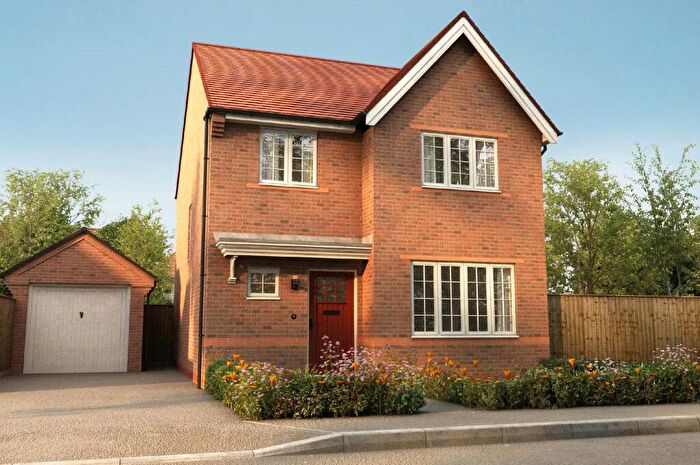
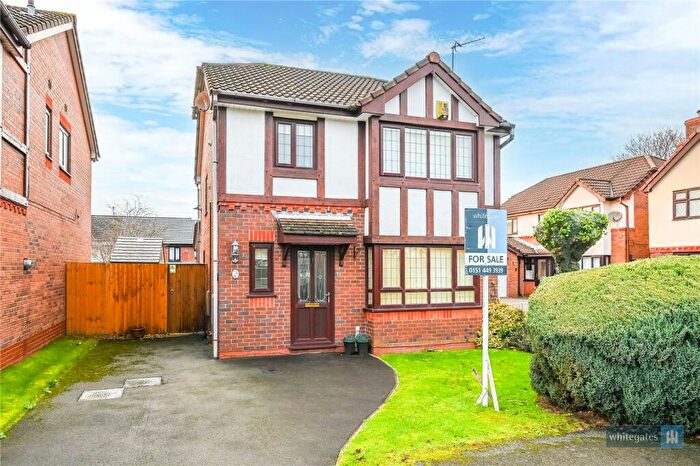
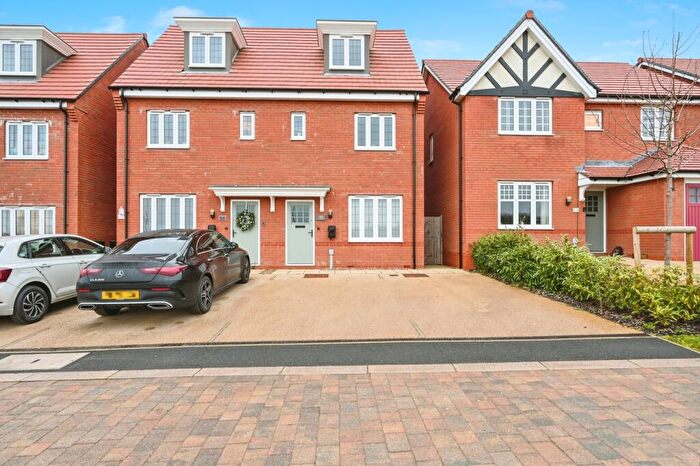
Houses for sale & to rent in Whiston South, Prescot
House Prices in Whiston South
Properties in Whiston South have an average house price of £161,348.00 and had 193 Property Transactions within the last 3 years¹.
Whiston South is an area in Prescot, Knowsley with 2,279 households², where the most expensive property was sold for £450,000.00.
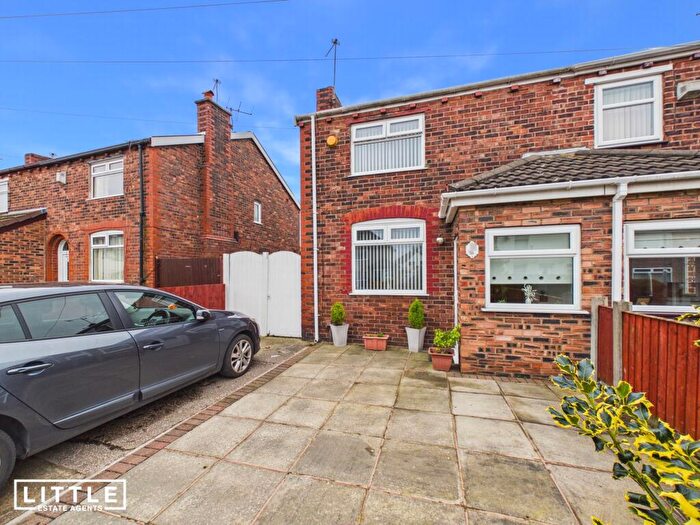
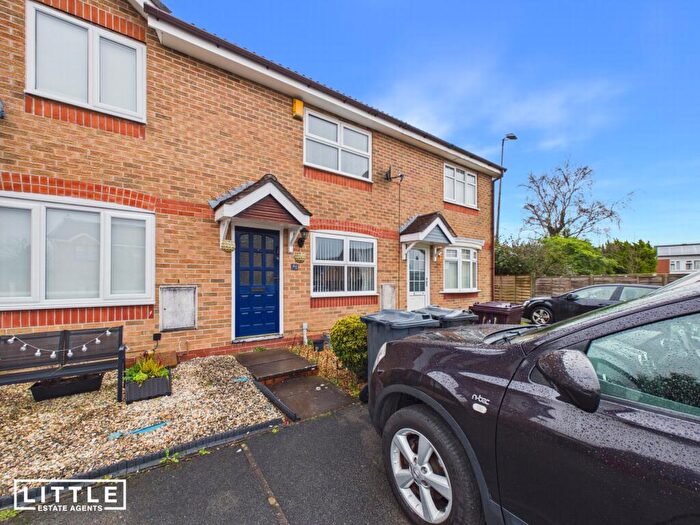
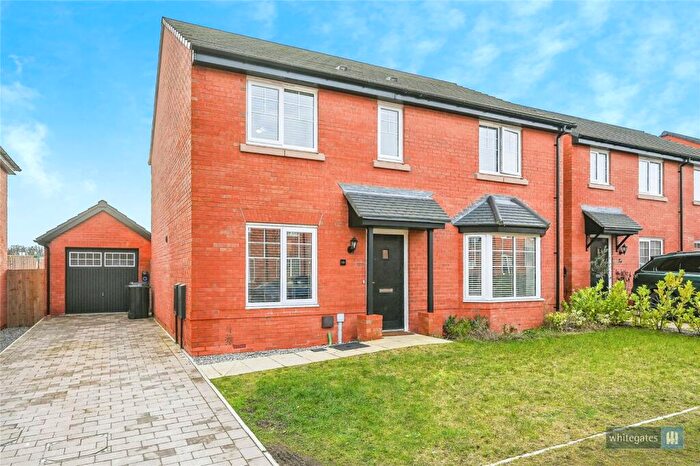
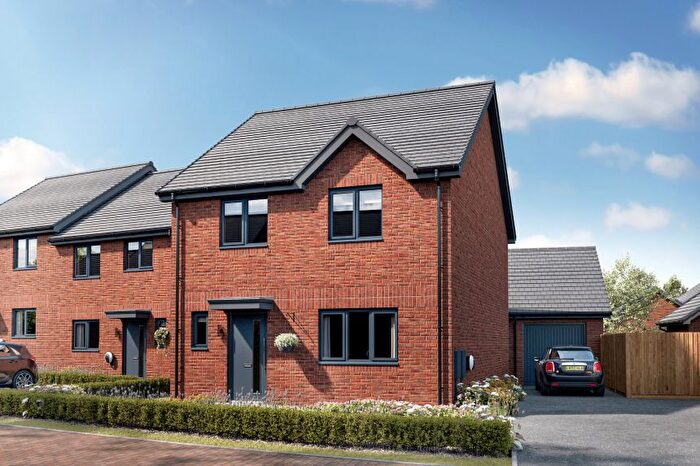
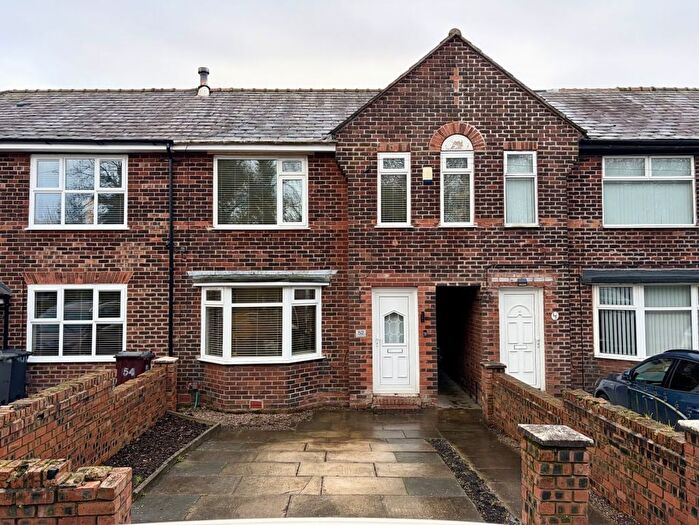
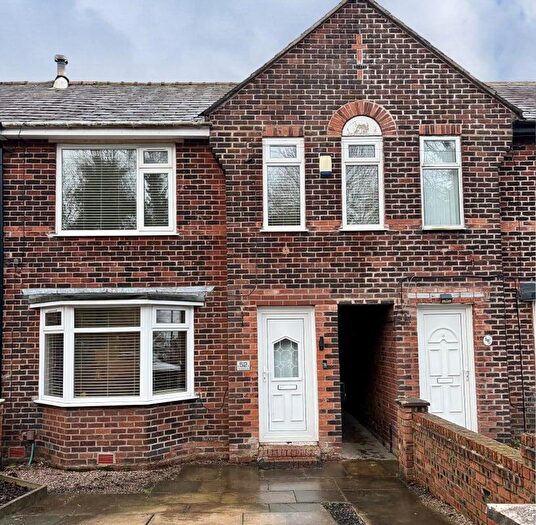
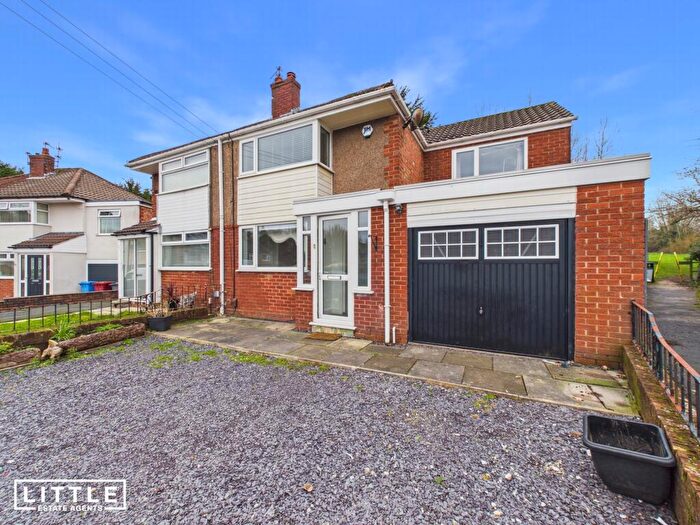
Properties for sale in Whiston South
Roads and Postcodes in Whiston South
Navigate through our locations to find the location of your next house in Whiston South, Prescot for sale or to rent.
| Streets | Postcodes |
|---|---|
| Abbeywood Grove | L35 3RS |
| Banner Hey | L35 3JS |
| Beatty Close | L35 3PH |
| Berrywood Drive | L35 3UQ |
| Bishop Drive | L35 3JL L35 3SY |
| Brackenwood Grove | L35 3US |
| Braemar Close | L35 3TR |
| Briarswood Close | L35 3UY |
| Caldywood Drive | L35 3XW |
| Cheswood Close | L35 3XP |
| Coalgate Lane | L35 3RT |
| Copperwood Drive | L35 3UG |
| Croftwood Grove | L35 3UT |
| Cronton Avenue | L35 3SH |
| Dalewood Gardens | L35 3UW |
| Deanwood Close | L35 3UX |
| Deepwood Grove | L35 3XE |
| Domville | L35 3JF L35 3JG |
| Drake Close | L35 3PR |
| Driveway | L35 3TT |
| Dursley | L35 3TB L35 3TD |
| Earlwood Gardens | L35 3XF |
| Exeley | L35 3JH |
| Fellwood Grove | L35 3XL |
| Fisher Avenue | L35 3PE L35 3PF |
| Fisher Place | L35 3PJ |
| Foxs Bank Lane | L35 3SS |
| Foxshaw Close | L35 3SP |
| Glenwood Close | L35 3RL |
| Gresford Close | L35 3TS |
| Grovewood Gardens | L35 3UP |
| Halsnead Avenue | L35 3SD |
| Halsnead Hall Villas | L35 3SU |
| Halton Hey | L35 3JP |
| Haslemere | L35 3TW |
| Heywood Gardens | L35 3XD |
| Holly Hey | L35 3JR |
| Jubilee Drive | L35 3PD |
| Kingsnorth | L35 3TF |
| Langbar | L35 3JJ |
| Lickers Lane | L35 3PN L35 3PW L35 3QD L35 3SR |
| Linwood Grove | L35 3XJ |
| Littlewood Close | L35 3XQ |
| Long Hey | L35 3JN L35 3JW |
| Lyneham | L35 3TH L35 3TN |
| Manorwood Drive | L35 3RP L35 3UH L35 3UU L35 3UZ |
| Martock | L35 3JZ L35 3TA |
| Millwood Gardens | L35 3RR |
| Mitre Close | L35 3JD |
| Nelson Avenue | L35 3PG L35 3PQ |
| Nelson Place | L35 3PP |
| Paradise Lane | L35 3RY L35 3RZ |
| Parkwood Road | L35 3XB |
| Parren Avenue | L35 3SB |
| Priory Close | L35 3SZ |
| Raleigh Avenue | L35 3PL |
| Ravenhurst Way | L35 3SA |
| Rudgate | L35 3JE |
| Selborne | L35 3TG L35 3TQ |
| Sherwood Drive | L35 3XZ |
| Simons Close | L35 3SJ |
| Skeffington | L35 3JQ |
| St Nicholas Road | L35 3SN L35 3SW |
| Stanwood Gardens | L35 3XN |
| Stone Hey | L35 3JT |
| Wexwood Grove | L35 3XH |
| Willis Close | L35 3RX |
| Willis Lane | L35 3RU |
| Windy Arbor Brow | L35 1RA |
| Windy Arbor Close | L35 3SL |
| Windy Arbor Road | L35 1RB L35 3PA L35 3PB L35 3SE L35 3SF L35 3SG L35 3SQ |
Transport near Whiston South
-
Whiston Station
-
Prescot Station
-
Rainhill Station
-
Eccleston Park Station
-
Huyton Station
-
Thatto Heath Station
-
Roby Station
-
Hough Green Station
- FAQ
- Price Paid By Year
- Property Type Price
Frequently asked questions about Whiston South
What is the average price for a property for sale in Whiston South?
The average price for a property for sale in Whiston South is £161,348. This amount is 14% lower than the average price in Prescot. There are 688 property listings for sale in Whiston South.
What streets have the most expensive properties for sale in Whiston South?
The streets with the most expensive properties for sale in Whiston South are Brackenwood Grove at an average of £325,000, Wexwood Grove at an average of £285,000 and Copperwood Drive at an average of £266,000.
What streets have the most affordable properties for sale in Whiston South?
The streets with the most affordable properties for sale in Whiston South are Driveway at an average of £53,000, Exeley at an average of £75,000 and Langbar at an average of £101,666.
Which train stations are available in or near Whiston South?
Some of the train stations available in or near Whiston South are Whiston, Prescot and Rainhill.
Property Price Paid in Whiston South by Year
The average sold property price by year was:
| Year | Average Sold Price | Price Change |
Sold Properties
|
|---|---|---|---|
| 2025 | £177,486 | 11% |
54 Properties |
| 2024 | £157,442 | 3% |
69 Properties |
| 2023 | £152,749 | -3% |
70 Properties |
| 2022 | £156,935 | 7% |
79 Properties |
| 2021 | £146,400 | 11% |
72 Properties |
| 2020 | £129,668 | 5% |
64 Properties |
| 2019 | £123,301 | 6% |
64 Properties |
| 2018 | £115,896 | 0,2% |
64 Properties |
| 2017 | £115,613 | 14% |
68 Properties |
| 2016 | £99,562 | -7% |
70 Properties |
| 2015 | £106,386 | 0,3% |
55 Properties |
| 2014 | £106,099 | 5% |
54 Properties |
| 2013 | £100,620 | -10% |
29 Properties |
| 2012 | £110,225 | 13% |
31 Properties |
| 2011 | £95,910 | -14% |
37 Properties |
| 2010 | £109,782 | -3% |
23 Properties |
| 2009 | £113,188 | -3% |
29 Properties |
| 2008 | £116,564 | -12% |
32 Properties |
| 2007 | £130,985 | 15% |
92 Properties |
| 2006 | £111,358 | -4% |
100 Properties |
| 2005 | £115,258 | 17% |
64 Properties |
| 2004 | £95,603 | 25% |
89 Properties |
| 2003 | £72,094 | 18% |
115 Properties |
| 2002 | £59,041 | 9% |
115 Properties |
| 2001 | £53,868 | 8% |
139 Properties |
| 2000 | £49,574 | -0,1% |
115 Properties |
| 1999 | £49,631 | 3% |
125 Properties |
| 1998 | £48,212 | 1% |
127 Properties |
| 1997 | £47,522 | 1% |
134 Properties |
| 1996 | £46,966 | -7% |
122 Properties |
| 1995 | £50,137 | - |
137 Properties |
Property Price per Property Type in Whiston South
Here you can find historic sold price data in order to help with your property search.
The average Property Paid Price for specific property types in the last three years are:
| Property Type | Average Sold Price | Sold Properties |
|---|---|---|
| Semi Detached House | £174,080.00 | 87 Semi Detached Houses |
| Detached House | £236,394.00 | 19 Detached Houses |
| Terraced House | £135,704.00 | 82 Terraced Houses |
| Flat | £75,200.00 | 5 Flats |

