
Houses for sale & to rent in SE24 0BF, Mumford Road, Herne Hill, London
House Prices in SE24 0BF, Mumford Road, Herne Hill
Properties in SE24 0BF have no sales history available within the last 3 years. SE24 0BF is a postcode in Mumford Road located in Herne Hill, an area in London, Lambeth London Borough, with 2 households².
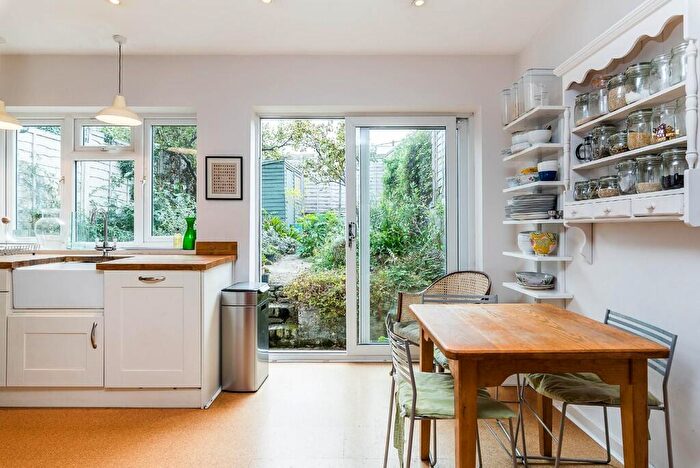
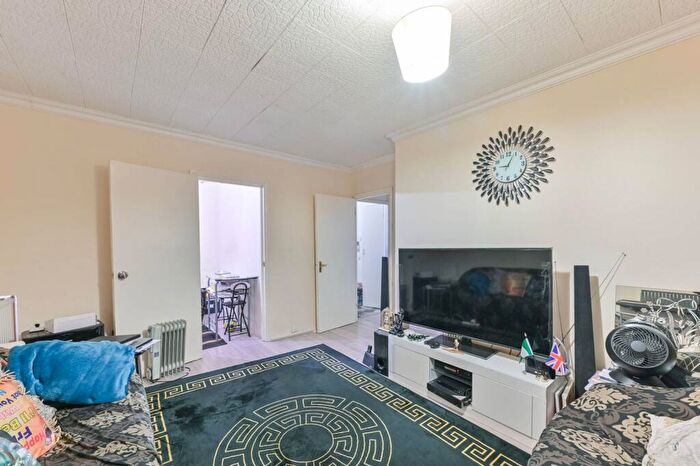
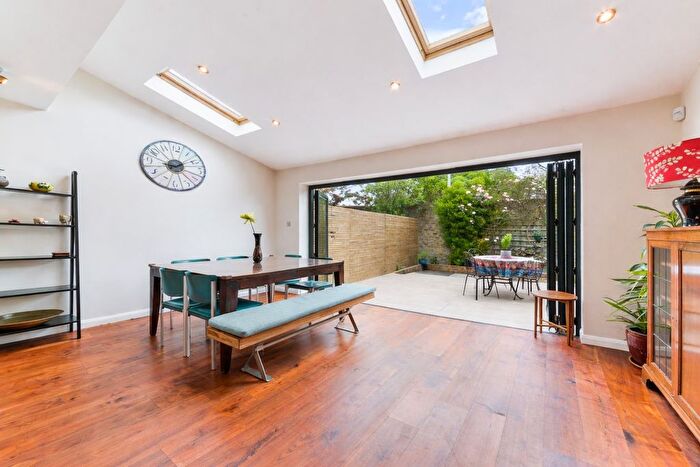
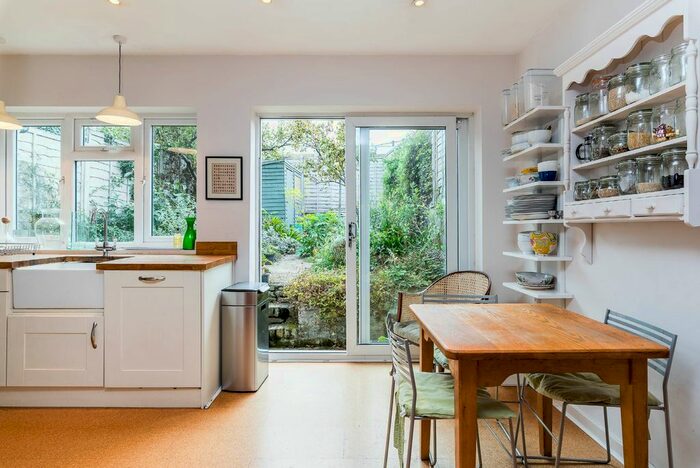
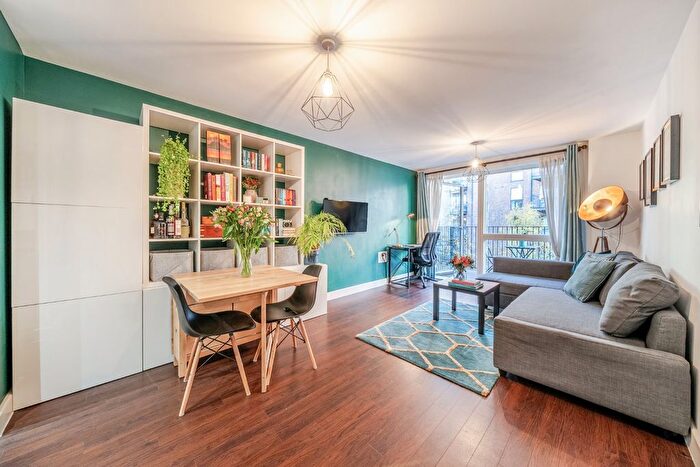
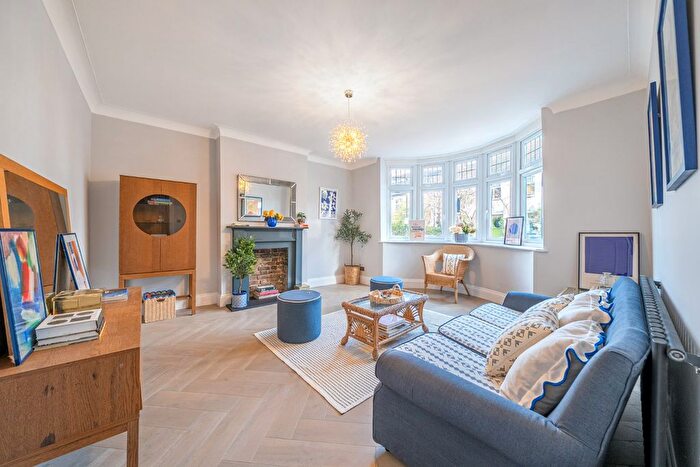
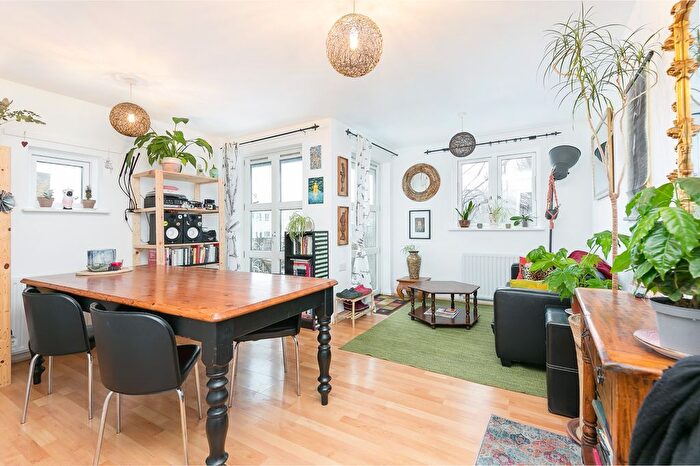
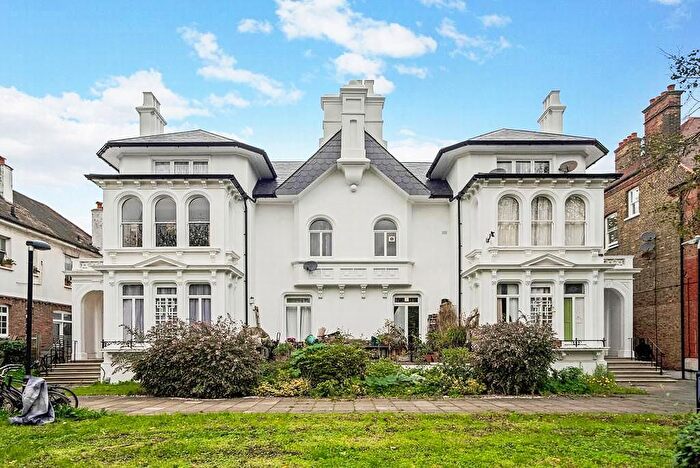
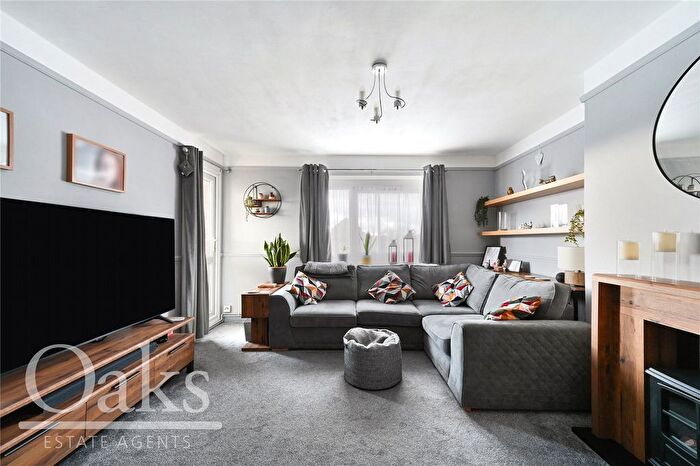
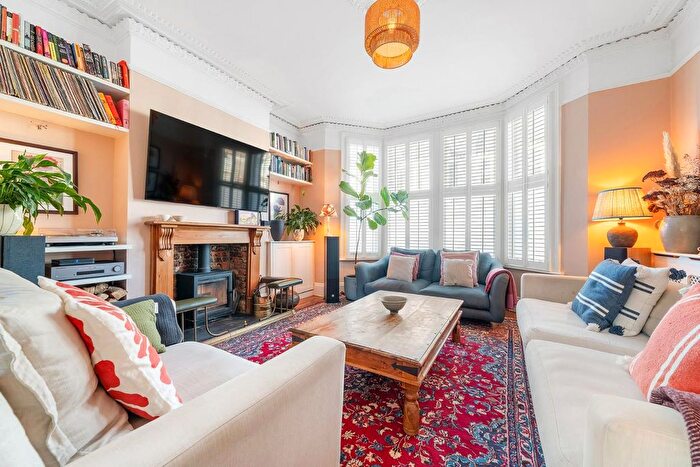
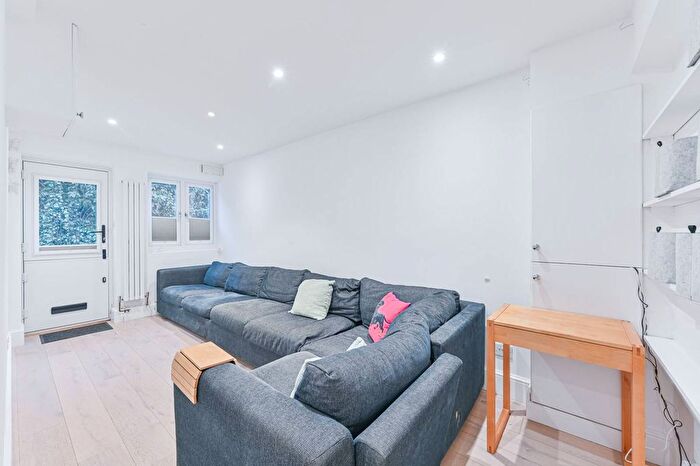
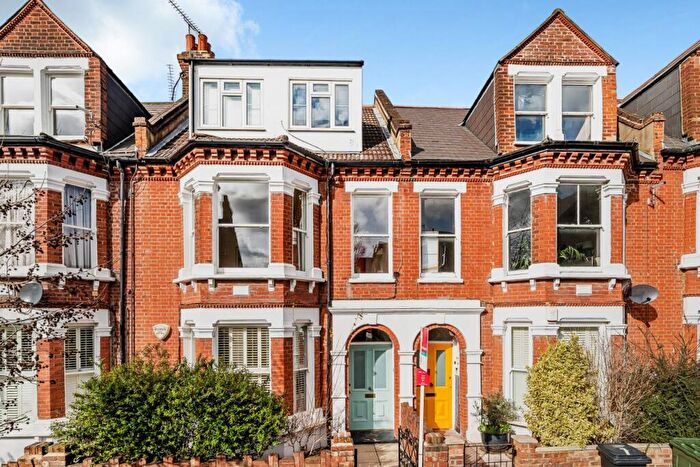
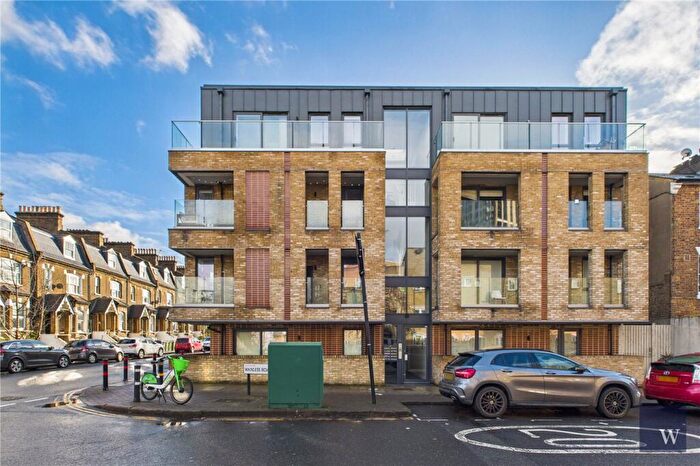
Properties for sale near SE24 0BF, Mumford Road
![]()
If you are looking to sell your house, let it out, or receive a property valuation, an expert can help you.
Click the button below to get started.
Price Paid in Mumford Road, SE24 0BF, Herne Hill
2 Mumford Road, SE24 0BF, Herne Hill London
Property 2 has been sold 2 times. The last time it was sold was in 20/06/2022 and the sold price was £660,000.00.
This terraced house, sold as a freehold on 20/06/2022, is a 70 sqm semi-detached house with an EPC rating of C.
| Date | Price | Property Type | Tenure | Classification |
|---|---|---|---|---|
| 20/06/2022 | £660,000.00 | Terraced House | freehold | Established Building |
| 20/04/2010 | £299,950.00 | Terraced House | freehold | Established Building |
1 Mumford Road, SE24 0BF, Herne Hill London
Property 1 has been sold 3 times. The last time it was sold was in 18/05/2018 and the sold price was £645,000.00.
This semi detached house, sold as a freehold on 18/05/2018, is a 70 sqm semi-detached house with an EPC rating of B.
| Date | Price | Property Type | Tenure | Classification |
|---|---|---|---|---|
| 18/05/2018 | £645,000.00 | Semi Detached House | freehold | Established Building |
| 07/10/2013 | £467,000.00 | Semi Detached House | freehold | Established Building |
| 07/05/2010 | £299,950.00 | Semi Detached House | freehold | New Build |
Transport near SE24 0BF, Mumford Road
-
 Herne Hill Station
 -
 Brixton Station
 -
North Dulwich Station
-
Loughborough Junction Station
-
 Denmark Hill Station
 -
Tulse Hill Station
-
East Dulwich Station
-
West Dulwich Station
-
Clapham North Station
-
Clapham High Street Station
House price paid reports for SE24 0BF, Mumford Road
Click on the buttons below to see price paid reports by year or property price:
- Price Paid By Year
Property Price Paid in SE24 0BF, Mumford Road by Year
The average sold property price by year was:
| Year | Average Sold Price | Price Change |
Sold Properties
|
|---|---|---|---|
| 2022 | £660,000 | 2% |
1 Property |
| 2018 | £645,000 | 28% |
1 Property |
| 2013 | £467,000 | 36% |
1 Property |
| 2010 | £299,950 | - |
2 Properties |