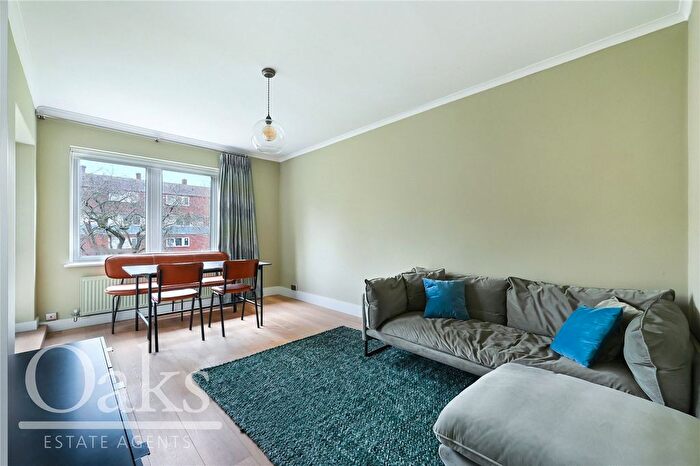
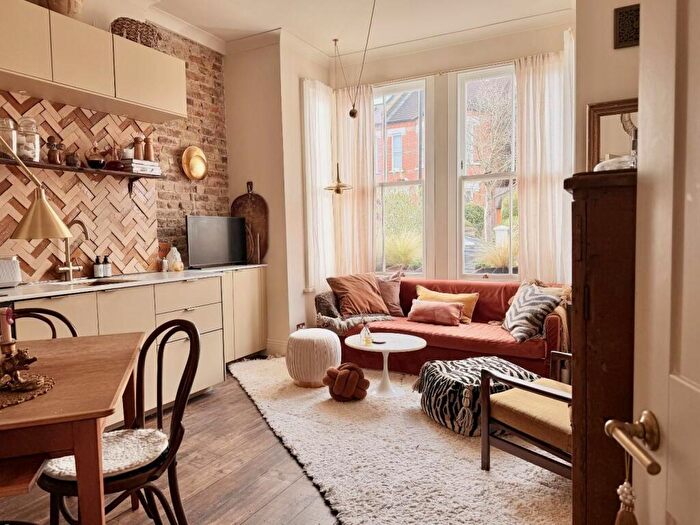
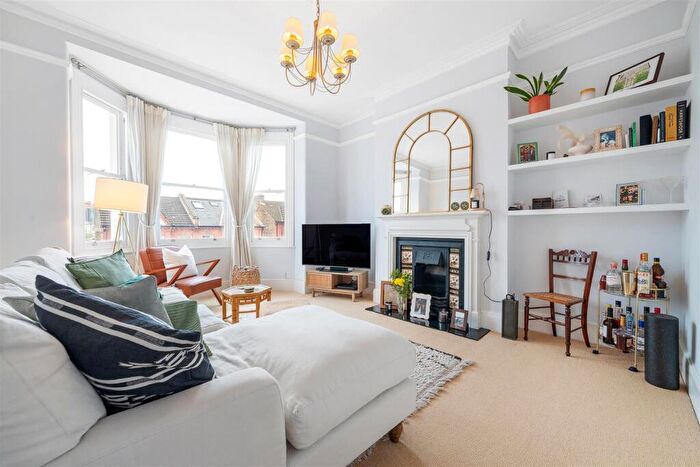
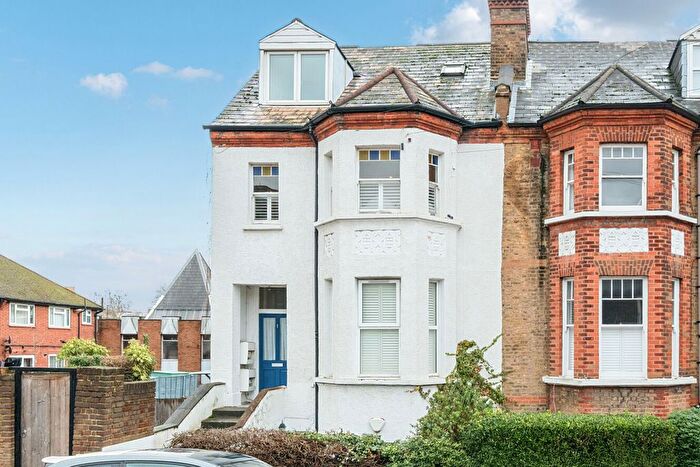
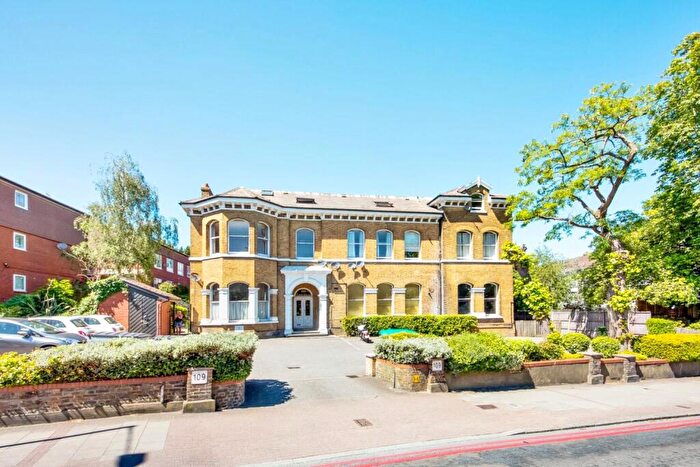
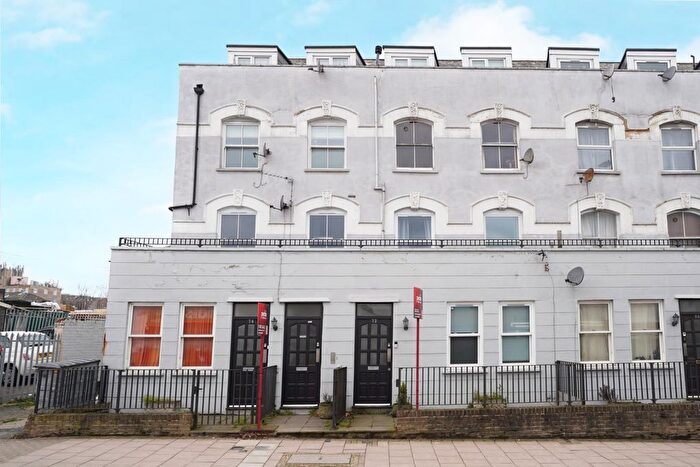
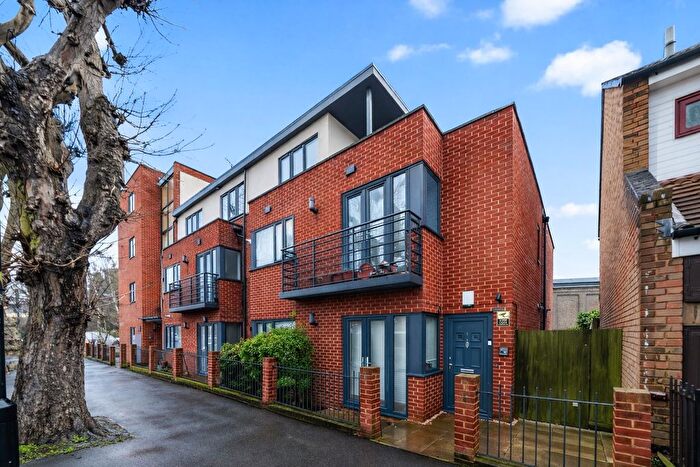
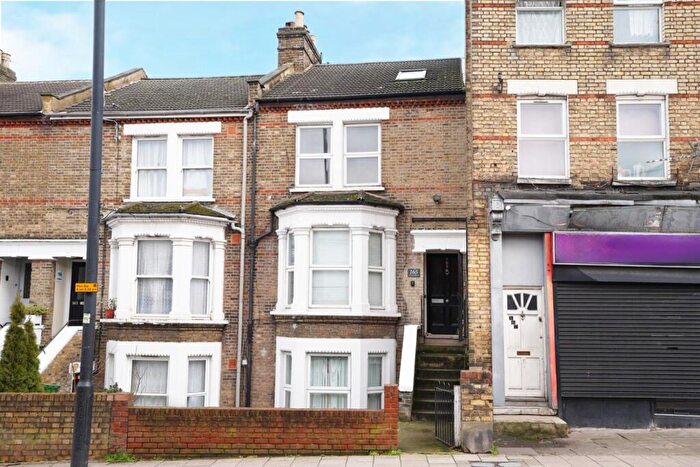
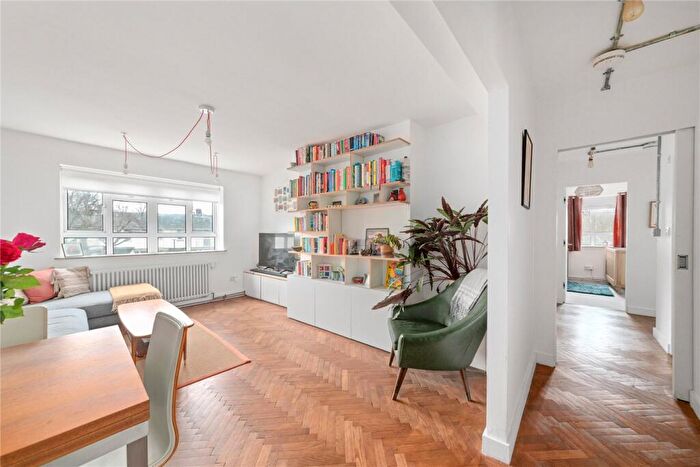
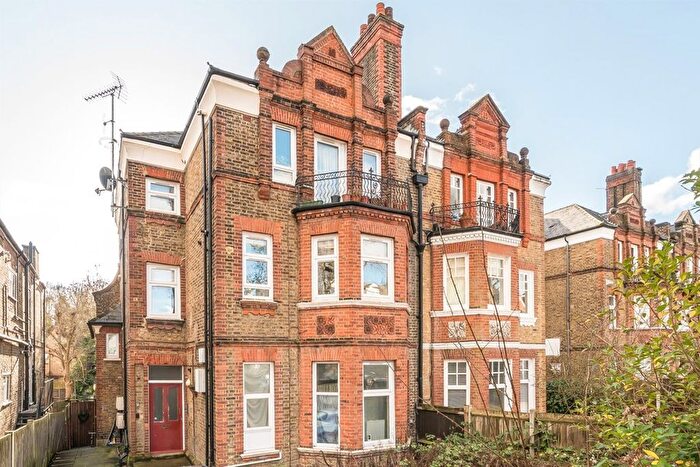
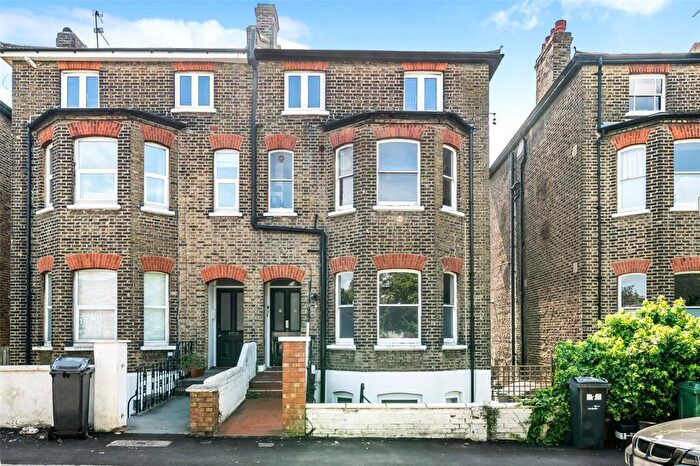
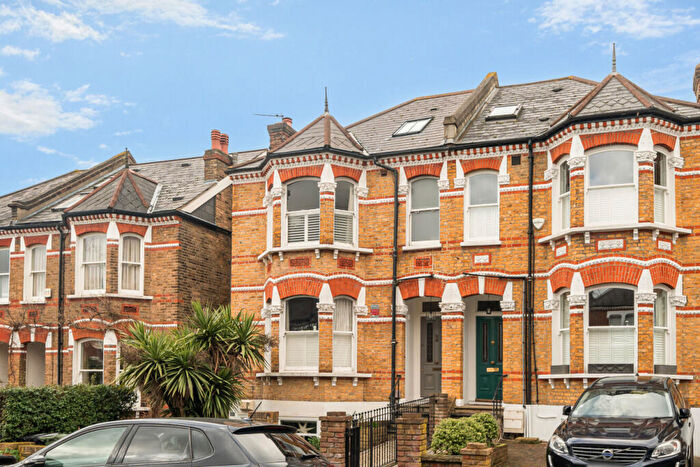
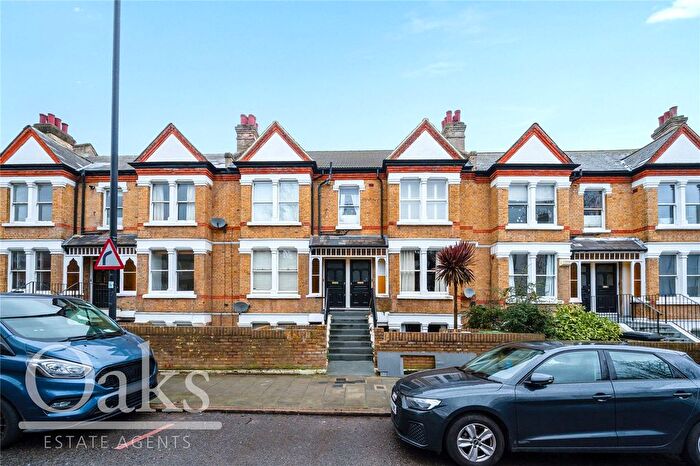
Houses for sale & to rent in Thurlow Park, London
House Prices in Thurlow Park
Properties in this part of Thurlow Park within London have an average house price of £689,458.00 and had 533 Property Transactions within the last 3 years¹. This area has 5,829 households² , where the most expensive property was sold for £3,400,999.00.
Properties for sale in Thurlow Park
Roads and Postcodes in Thurlow Park
Navigate through our locations to find the location of your next house in Thurlow Park, London for sale or to rent.
Transport near Thurlow Park
-
Tulse Hill Station
-
West Dulwich Station
-
West Norwood Station
-
Herne Hill Station
-
Sydenham Hill Station
-
North Dulwich Station
-
Streatham Hill Station
-
Gipsy Hill Station
-
Brixton Station
-
Streatham Station
- FAQ
- Price Paid By Year
- Property Type Price
Frequently asked questions about Thurlow Park
What is the average price for a property for sale in Thurlow Park?
The average price for a property for sale in Thurlow Park is £689,458. This amount is 8% higher than the average price in London. There are 2,588 property listings for sale in Thurlow Park.
What streets have the most expensive properties for sale in Thurlow Park?
The streets with the most expensive properties for sale in Thurlow Park are Ardlui Road at an average of £2,065,000, Eastmearn Road at an average of £1,750,000 and Lovelace Road at an average of £1,493,100.
What streets have the most affordable properties for sale in Thurlow Park?
The streets with the most affordable properties for sale in Thurlow Park are Cedar Close at an average of £144,722, Ebury Mews at an average of £305,000 and Ashurst Gardens at an average of £310,000.
Which train stations are available in or near Thurlow Park?
Some of the train stations available in or near Thurlow Park are Tulse Hill, West Dulwich and West Norwood.
Which tube stations are available in or near Thurlow Park?
The tube station available in or near Thurlow Park is Brixton.
Property Price Paid in Thurlow Park by Year
The average sold property price by year was:
| Year | Average Sold Price | Price Change |
Sold Properties
|
|---|---|---|---|
| 2025 | £692,614 | -2% |
158 Properties |
| 2024 | £703,173 | 5% |
201 Properties |
| 2023 | £670,749 | -3% |
174 Properties |
| 2022 | £688,112 | 5% |
186 Properties |
| 2021 | £652,613 | 2% |
278 Properties |
| 2020 | £641,026 | 6% |
159 Properties |
| 2019 | £601,427 | -5% |
185 Properties |
| 2018 | £630,761 | 12% |
160 Properties |
| 2017 | £552,030 | -9% |
193 Properties |
| 2016 | £603,902 | 12% |
189 Properties |
| 2015 | £532,588 | 10% |
241 Properties |
| 2014 | £481,039 | 16% |
234 Properties |
| 2013 | £403,495 | 0,2% |
238 Properties |
| 2012 | £402,549 | 5% |
193 Properties |
| 2011 | £381,690 | 2% |
181 Properties |
| 2010 | £375,255 | 3% |
172 Properties |
| 2009 | £362,556 | 3% |
117 Properties |
| 2008 | £352,114 | 15% |
156 Properties |
| 2007 | £298,411 | 1% |
347 Properties |
| 2006 | £296,160 | 10% |
328 Properties |
| 2005 | £266,184 | 8% |
268 Properties |
| 2004 | £244,769 | 2% |
282 Properties |
| 2003 | £239,453 | 7% |
240 Properties |
| 2002 | £223,341 | 21% |
339 Properties |
| 2001 | £175,572 | -1% |
297 Properties |
| 2000 | £178,060 | 18% |
295 Properties |
| 1999 | £145,676 | 22% |
317 Properties |
| 1998 | £113,871 | 18% |
292 Properties |
| 1997 | £93,055 | 2% |
357 Properties |
| 1996 | £91,217 | 7% |
238 Properties |
| 1995 | £85,167 | - |
205 Properties |
Property Price per Property Type in Thurlow Park
Here you can find historic sold price data in order to help with your property search.
The average Property Paid Price for specific property types in the last three years are:
| Property Type | Average Sold Price | Sold Properties |
|---|---|---|
| Flat | £457,379.00 | 331 Flats |
| Semi Detached House | £1,388,210.00 | 48 Semi Detached Houses |
| Terraced House | £950,161.00 | 149 Terraced Houses |
| Detached House | £1,576,100.00 | 5 Detached Houses |

