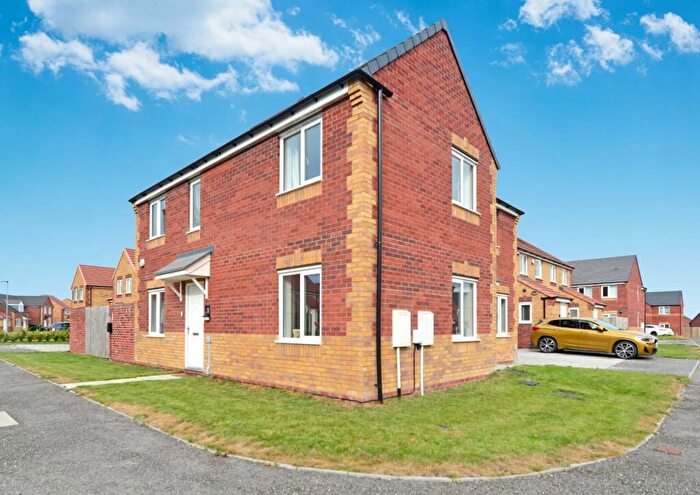
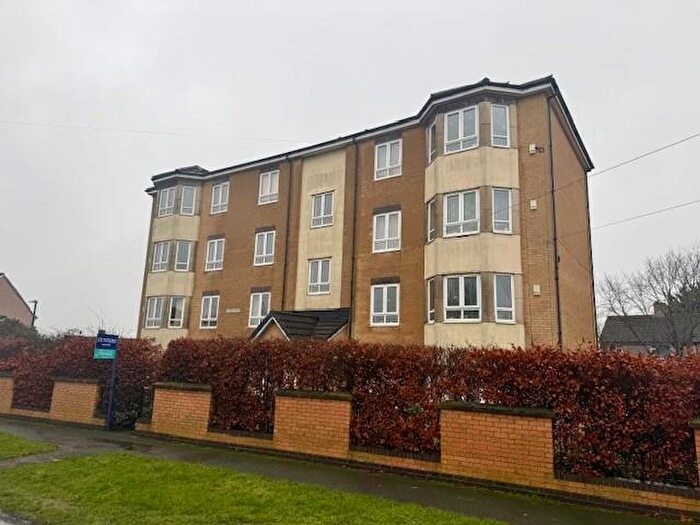
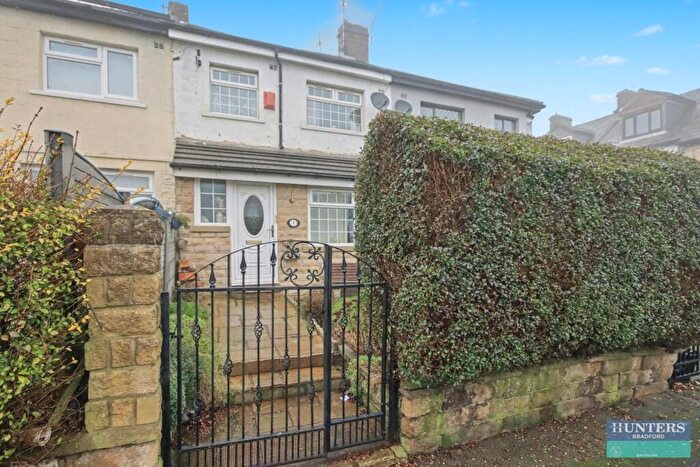
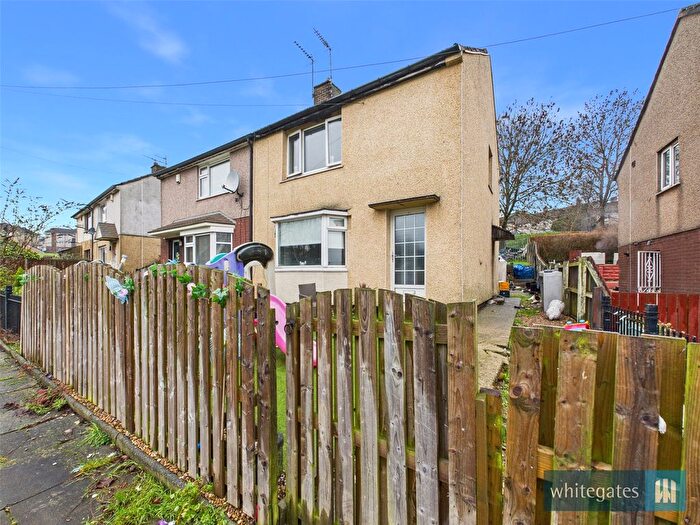
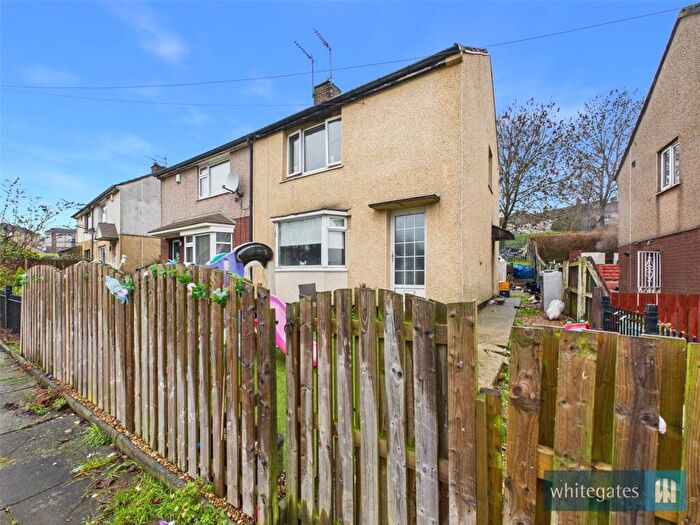
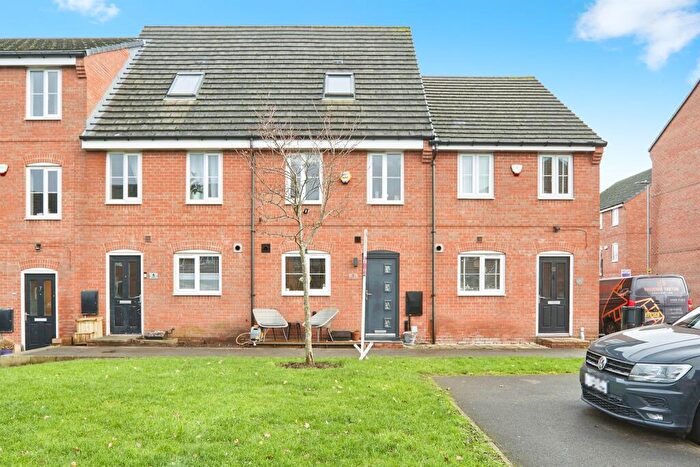
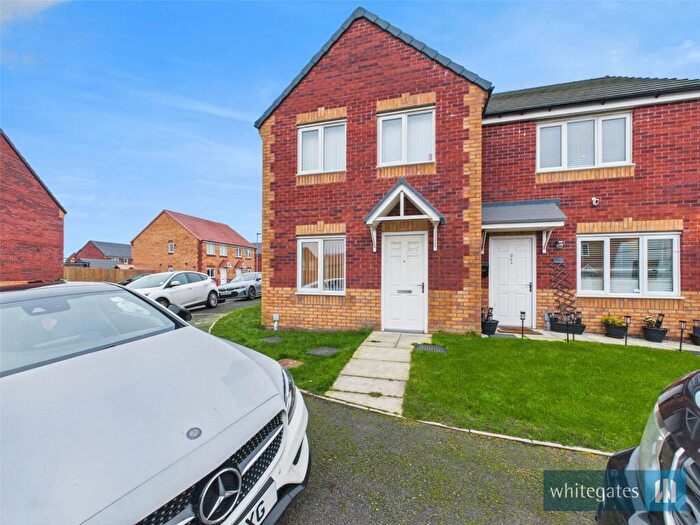
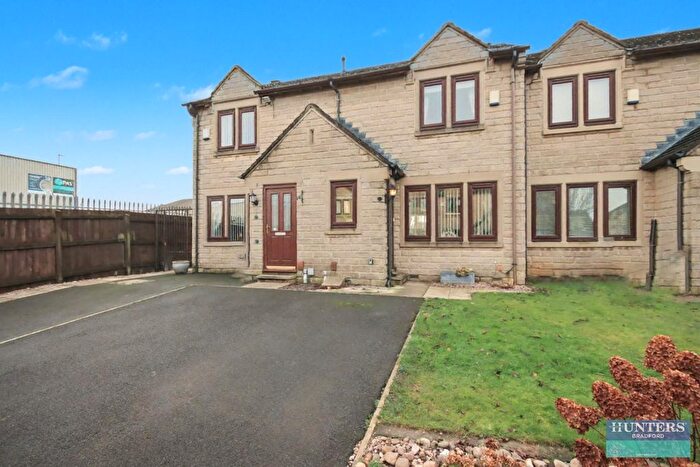
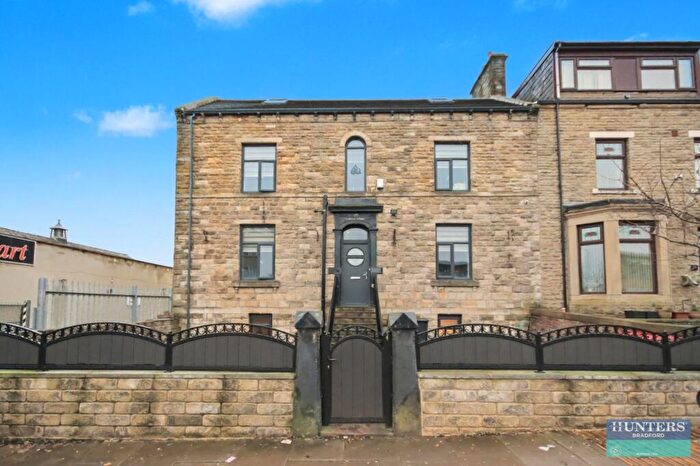
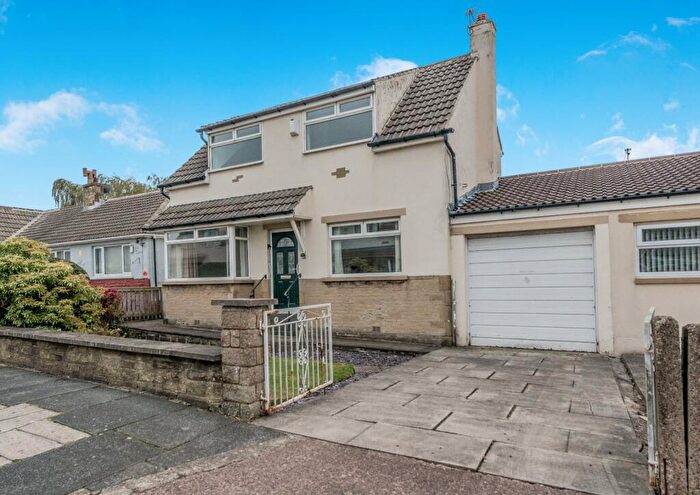
Houses for sale & to rent in Pudsey, Bradford
House Prices in Pudsey
Properties in Pudsey have an average house price of £175,904.00 and had 100 Property Transactions within the last 3 years¹.
Pudsey is an area in Bradford, Leeds with 632 households², where the most expensive property was sold for £608,000.00.
Properties for sale in Pudsey
Roads and Postcodes in Pudsey
Navigate through our locations to find the location of your next house in Pudsey, Bradford for sale or to rent.
| Streets | Postcodes |
|---|---|
| Calverley Crescent | BD4 0BW |
| City Link Industrial Park | BD4 8JP |
| Kitchen Road | BD4 0DD |
| Pudsey View | BD4 0FA |
| Saxton Place | BD4 0FB |
| Stirling Crescent | BD4 0FJ |
| Stroothers Place | BD4 0BN |
| Tempest Square | BD4 0FE |
| Thornton Grove | BD4 0FF |
| Turner Grove | BD4 0FG |
| Tyersal Avenue | BD4 8HH BD4 8HJ BD4 8HL |
| Tyersal Close | BD4 8HE |
| Tyersal Court | BD4 8EN BD4 8EW |
| Tyersal Crescent | BD4 8HA BD4 8HD |
| Tyersal Drive | BD4 8EP |
| Tyersal Fold | BD4 8FA |
| Tyersal Gardens | BD4 8AX |
| Tyersal Garth | BD4 8HB |
| Tyersal Green | BD4 8HQ |
| Tyersal Grove | BD4 8HN |
| Tyersal Lane | BD4 0RE BD4 0FH BD4 0RF |
| Tyersal Mews | BD4 8HF |
| Tyersal Park | BD4 8EY |
| Tyersal Road | BD4 8EL BD4 8ES BD4 8ET BD4 8EU BD4 8EX BD4 8EZ BD4 8HG |
| Tyersal Terrace | BD4 8HP BD4 8HR |
| Tyersal View | BD4 8HS BD4 8HT |
| Tyersal Walk | BD4 8ER |
| Whinney Hill | BD4 8LU |
| BD4 0FD |
Transport near Pudsey
-
New Pudsey Station
-
Bradford Interchange Station
-
Bradford Forster Square Station
-
Bramley (West Yorkshire) Station
- FAQ
- Price Paid By Year
- Property Type Price
Frequently asked questions about Pudsey
What is the average price for a property for sale in Pudsey?
The average price for a property for sale in Pudsey is £175,904. This amount is 26% lower than the average price in Bradford. There are 555 property listings for sale in Pudsey.
What streets have the most expensive properties for sale in Pudsey?
The streets with the most expensive properties for sale in Pudsey are Whinney Hill at an average of £608,000, Tyersal Lane at an average of £260,000 and Turner Grove at an average of £216,250.
What streets have the most affordable properties for sale in Pudsey?
The streets with the most affordable properties for sale in Pudsey are Tyersal Drive at an average of £125,000, Tyersal Crescent at an average of £141,248 and Tyersal Garth at an average of £147,666.
Which train stations are available in or near Pudsey?
Some of the train stations available in or near Pudsey are New Pudsey, Bradford Interchange and Bradford Forster Square.
Property Price Paid in Pudsey by Year
The average sold property price by year was:
| Year | Average Sold Price | Price Change |
Sold Properties
|
|---|---|---|---|
| 2025 | £203,370 | 18% |
27 Properties |
| 2024 | £166,166 | 1% |
38 Properties |
| 2023 | £165,289 | 12% |
35 Properties |
| 2022 | £145,760 | -1% |
50 Properties |
| 2021 | £146,844 | 6% |
54 Properties |
| 2020 | £137,540 | 5% |
45 Properties |
| 2019 | £131,350 | 3% |
58 Properties |
| 2018 | £127,087 | 3% |
56 Properties |
| 2017 | £122,797 | -0,4% |
44 Properties |
| 2016 | £123,232 | 11% |
17 Properties |
| 2015 | £109,726 | 6% |
24 Properties |
| 2014 | £103,450 | -6% |
19 Properties |
| 2013 | £109,430 | 12% |
21 Properties |
| 2012 | £96,681 | -15% |
22 Properties |
| 2011 | £111,055 | -5% |
17 Properties |
| 2010 | £116,666 | 8% |
18 Properties |
| 2009 | £107,745 | -11% |
12 Properties |
| 2008 | £119,323 | -22% |
17 Properties |
| 2007 | £146,009 | 18% |
35 Properties |
| 2006 | £120,273 | 10% |
36 Properties |
| 2005 | £108,795 | 4% |
26 Properties |
| 2004 | £104,256 | 30% |
38 Properties |
| 2003 | £72,781 | 20% |
36 Properties |
| 2002 | £58,507 | 8% |
44 Properties |
| 2001 | £53,840 | -7% |
26 Properties |
| 2000 | £57,830 | 10% |
27 Properties |
| 1999 | £52,104 | 10% |
31 Properties |
| 1998 | £46,868 | -3% |
19 Properties |
| 1997 | £48,409 | 7% |
21 Properties |
| 1996 | £45,076 | -2% |
13 Properties |
| 1995 | £46,145 | - |
26 Properties |
Property Price per Property Type in Pudsey
Here you can find historic sold price data in order to help with your property search.
The average Property Paid Price for specific property types in the last three years are:
| Property Type | Average Sold Price | Sold Properties |
|---|---|---|
| Semi Detached House | £166,748.00 | 63 Semi Detached Houses |
| Detached House | £242,127.00 | 18 Detached Houses |
| Terraced House | £148,722.00 | 18 Terraced Houses |
| Flat | £50,000.00 | 1 Flat |

