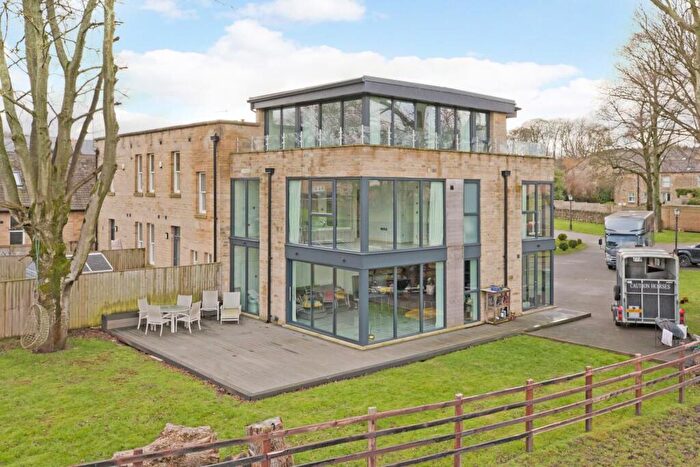
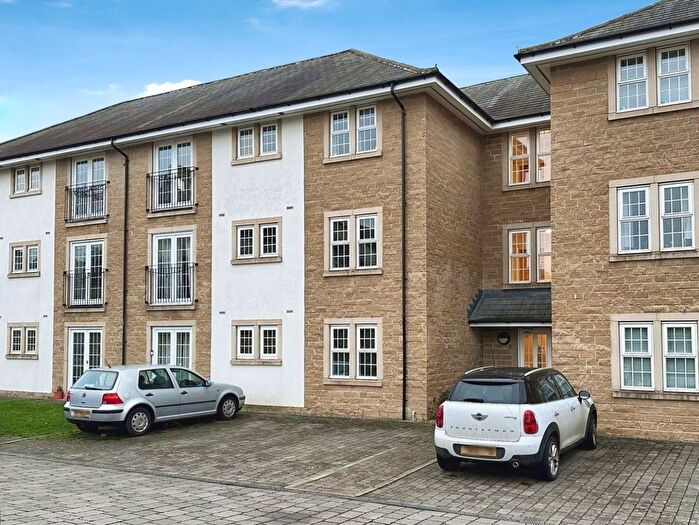
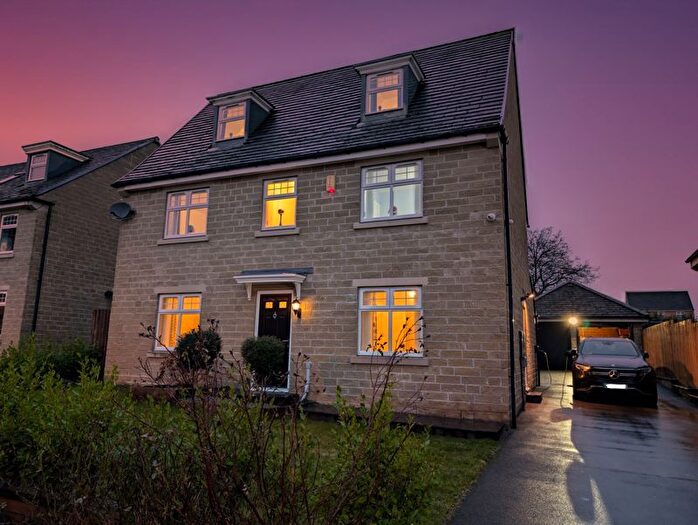
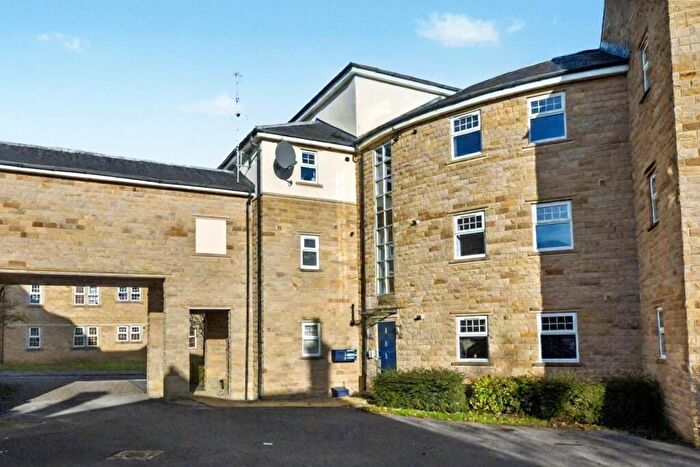
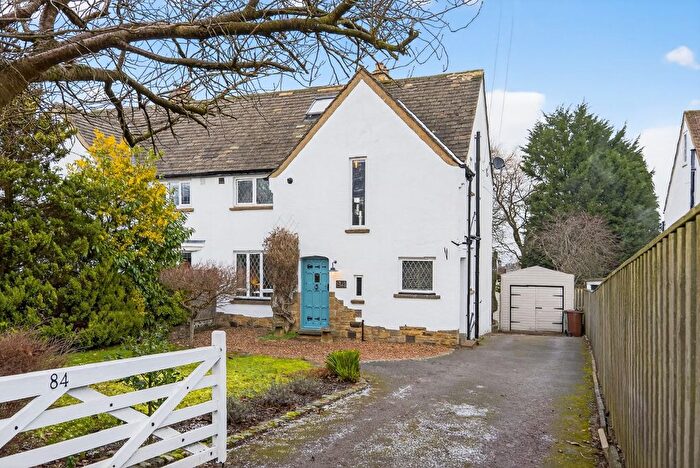
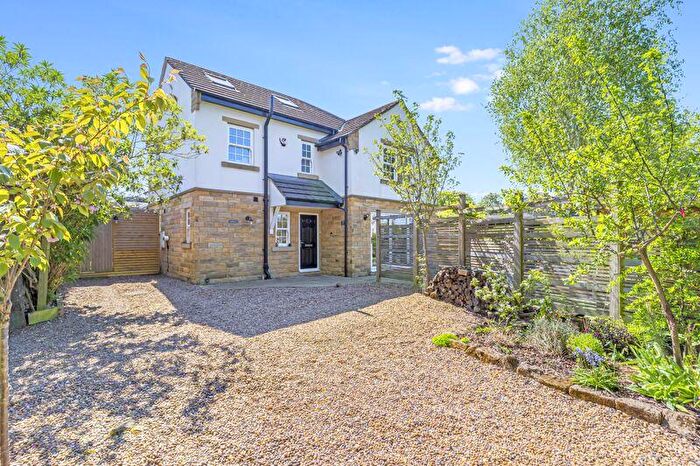
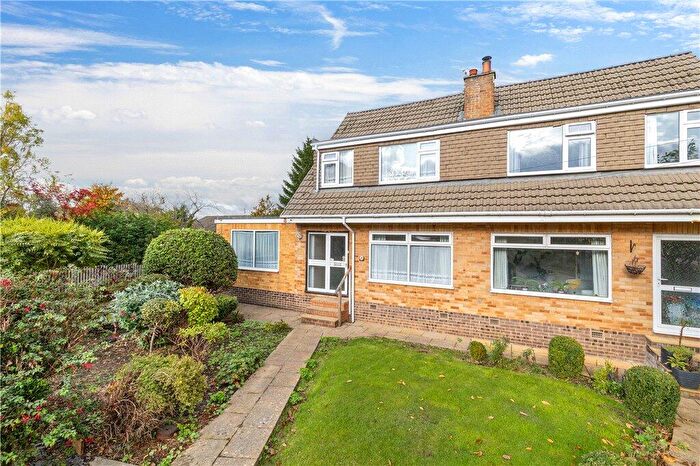
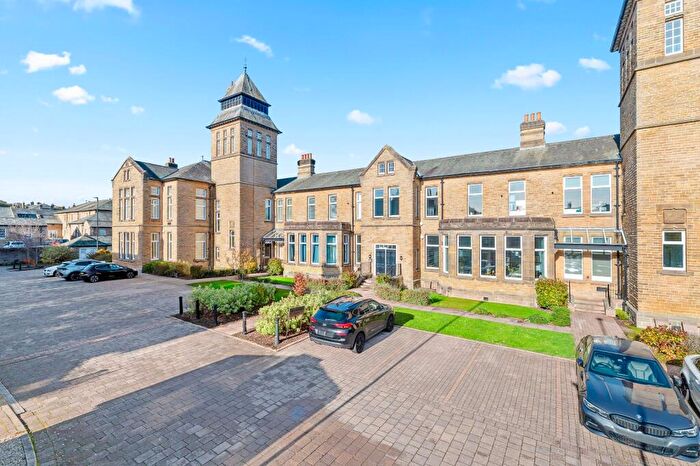
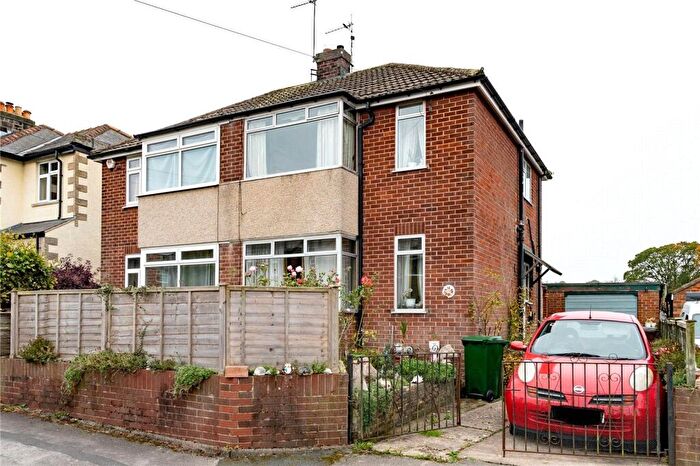
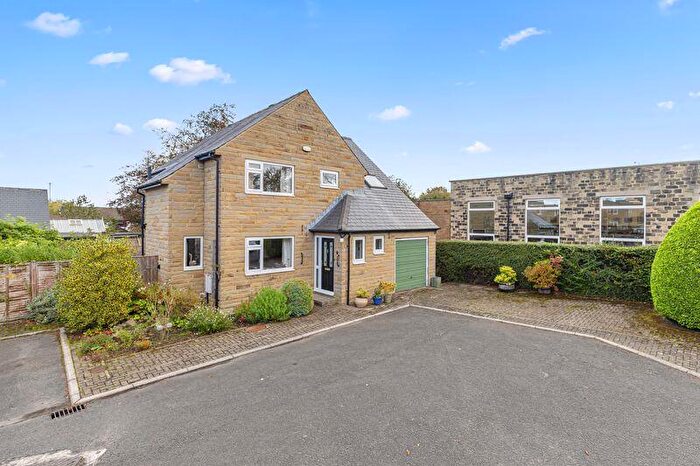
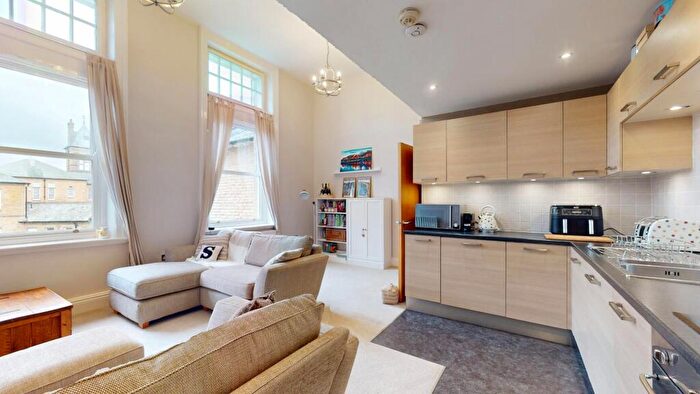
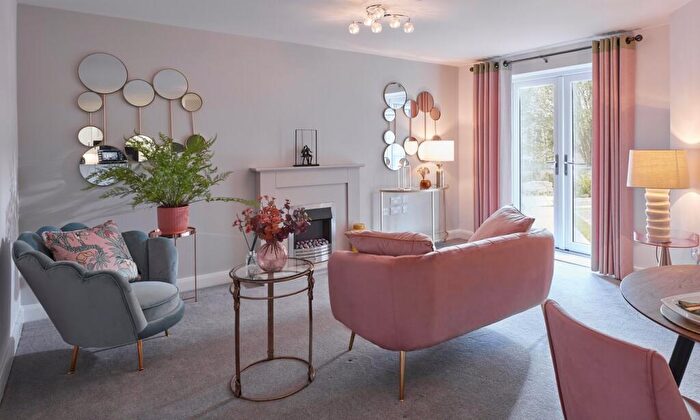
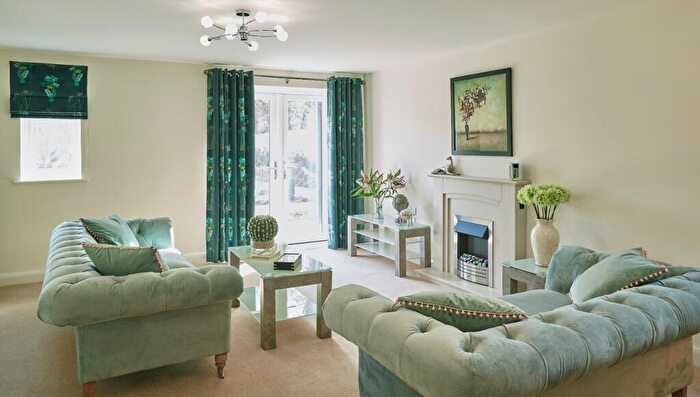
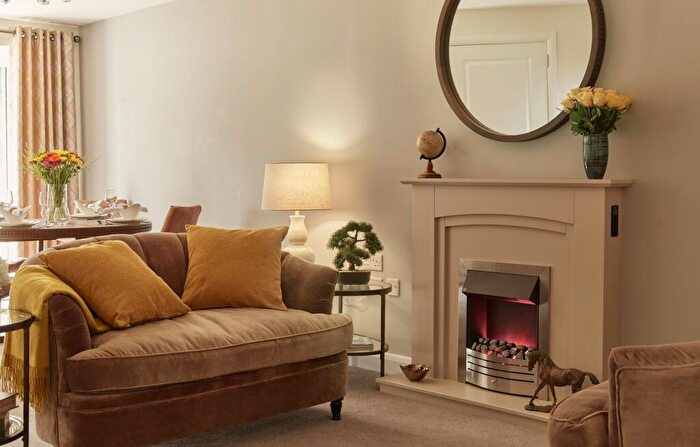
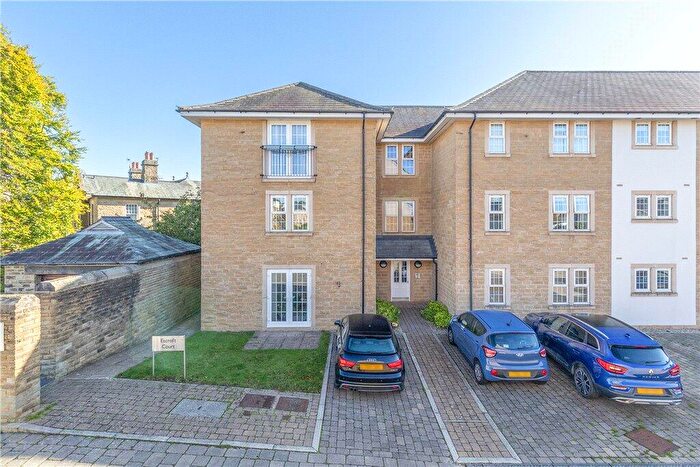
Houses for sale & to rent in Guiseley And Rawdon, Ilkley
House Prices in Guiseley And Rawdon
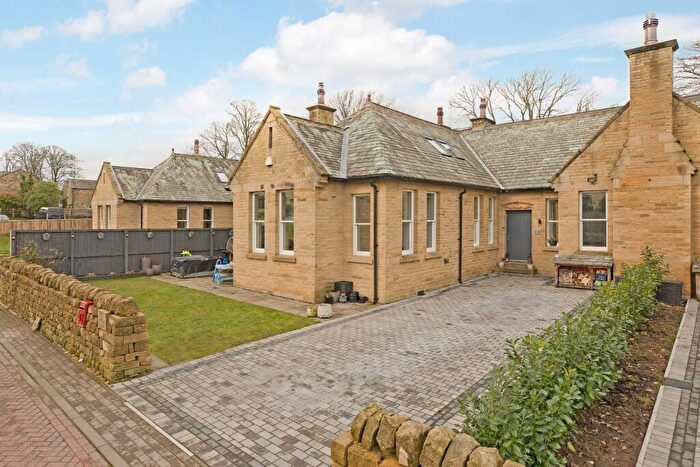
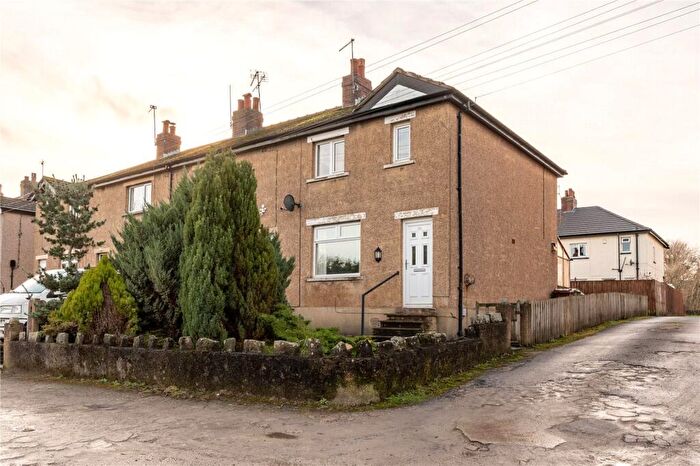
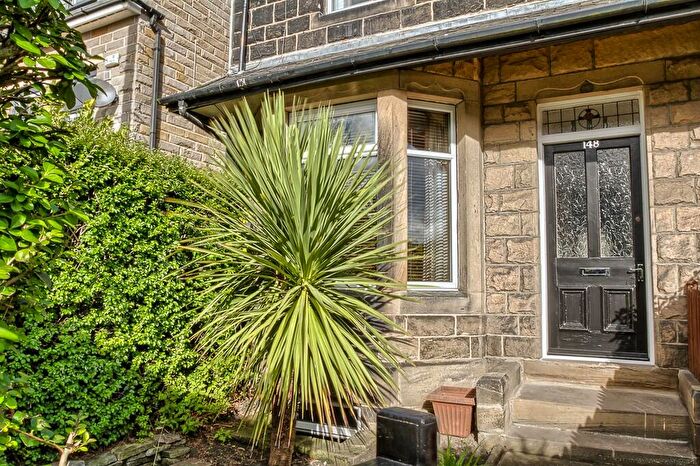
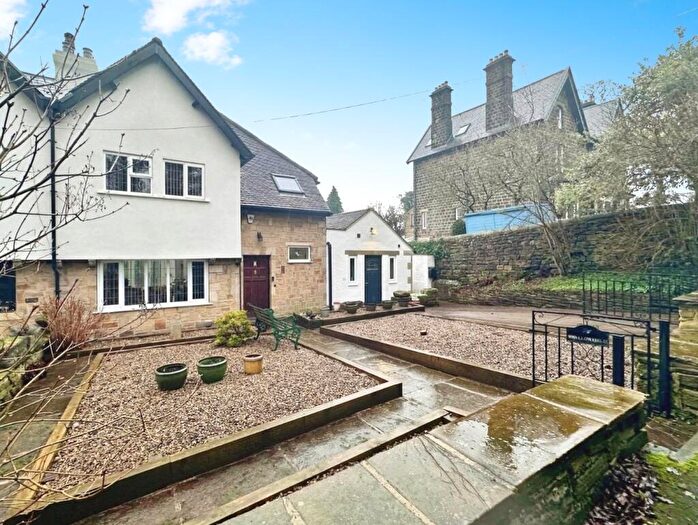
Properties in Guiseley And Rawdon have an average house price of £287,806.00 and had 62 Property Transactions within the last 3 years¹.
Guiseley And Rawdon is an area in Ilkley, Leeds with 396 households², where the most expensive property was sold for £625,000.00.
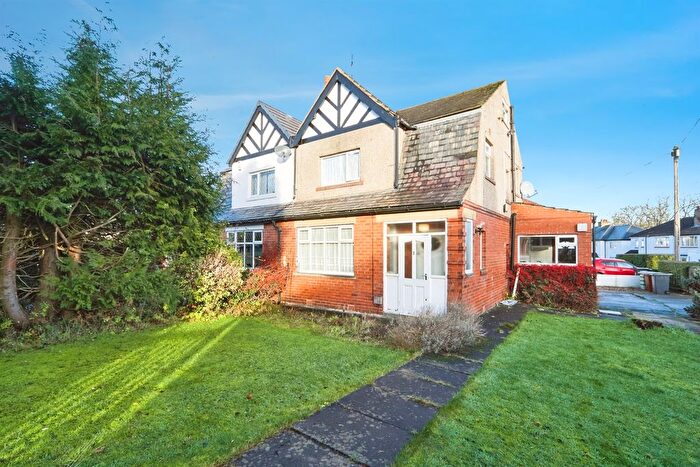
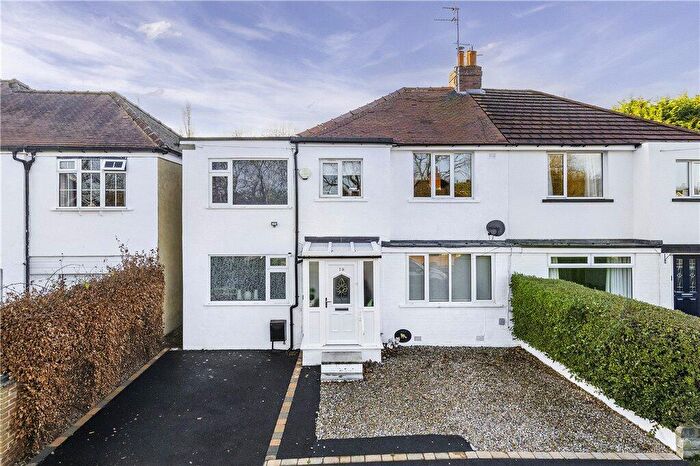
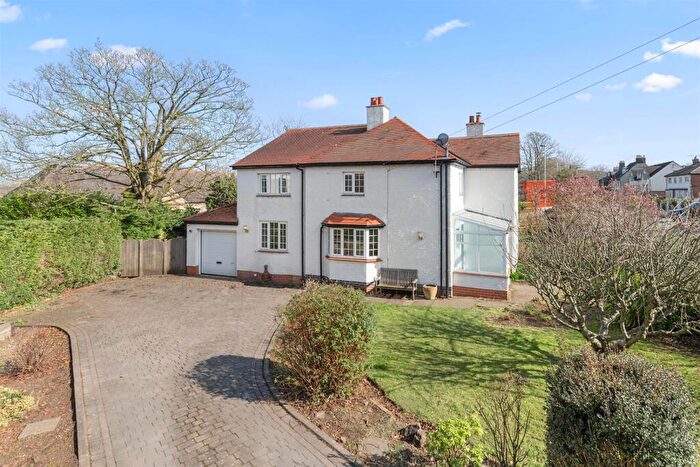
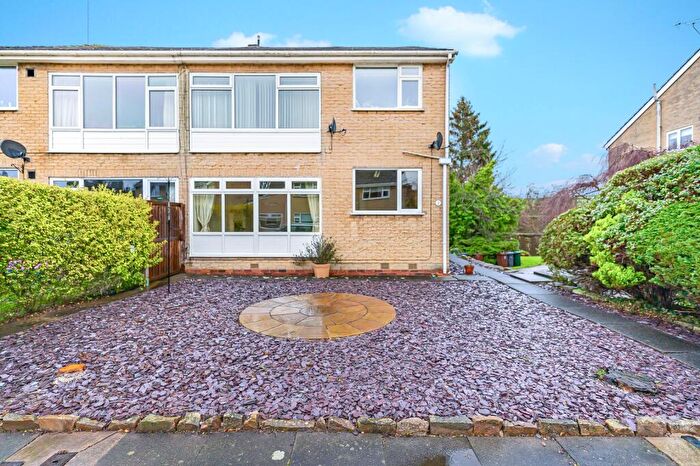
Properties for sale in Guiseley And Rawdon
Roads and Postcodes in Guiseley And Rawdon
Navigate through our locations to find the location of your next house in Guiseley And Rawdon, Ilkley for sale or to rent.
| Streets | Postcodes |
|---|---|
| Beamsley Close | LS29 6FG |
| Beamsley Court | LS29 6FL |
| Beamsley Croft | LS29 6FT |
| Beamsley Walk | LS29 6FJ |
| Bingley Road | LS29 6BB |
| Bradford Road | LS29 6AE |
| Burnstall Close | LS29 6FR |
| Burnstall Crescent | LS29 6FS |
| Chevin End | LS29 6BN LS29 6BP LS29 6BW |
| Clifford Drive | LS29 6FA LS29 6FE LS29 6FF LS29 6FX LS29 6FY LS29 6FZ |
| High Royds Drive | LS29 6QP LS29 6QY |
| Home Farm Mews | LS29 6BF |
| Ingle Lane | LS29 6QR |
| Jackson Walk | LS29 6AJ LS29 6BS LS29 6BT LS29 6FB LS29 6FD |
| Kingsdale Avenue | LS29 6QL |
| Kingsdale Close | LS29 6QU |
| Kingsdale Drive | LS29 6QN |
| Moorland Crescent | LS29 6AF |
| Newby Close | LS29 6QT |
| Newby Court | LS29 6QS |
| Norwood Avenue | LS29 6FW |
| Norwood Court | LS29 6FQ |
| Norwood Drive | LS29 6GE |
| Wharfedale Avenue | LS29 6RP |
| Wharfedale Court | LS29 6RJ |
| Wharfedale Croft | LS29 6RN |
| Wharfedale Fold | LS29 6RL |
Transport near Guiseley And Rawdon
- FAQ
- Price Paid By Year
- Property Type Price
Frequently asked questions about Guiseley And Rawdon
What is the average price for a property for sale in Guiseley And Rawdon?
The average price for a property for sale in Guiseley And Rawdon is £287,806. This amount is 1% lower than the average price in Ilkley. There are 754 property listings for sale in Guiseley And Rawdon.
What streets have the most expensive properties for sale in Guiseley And Rawdon?
The streets with the most expensive properties for sale in Guiseley And Rawdon are Kingsdale Avenue at an average of £463,666, Bradford Road at an average of £430,000 and Moorland Crescent at an average of £422,666.
What streets have the most affordable properties for sale in Guiseley And Rawdon?
The streets with the most affordable properties for sale in Guiseley And Rawdon are Burnstall Crescent at an average of £187,816, Jackson Walk at an average of £193,300 and Clifford Drive at an average of £220,284.
Which train stations are available in or near Guiseley And Rawdon?
Some of the train stations available in or near Guiseley And Rawdon are Menston, Guiseley and Burley-In-Wharfedale.
Property Price Paid in Guiseley And Rawdon by Year
The average sold property price by year was:
| Year | Average Sold Price | Price Change |
Sold Properties
|
|---|---|---|---|
| 2025 | £338,696 | 18% |
17 Properties |
| 2024 | £276,103 | 8% |
29 Properties |
| 2023 | £254,946 | -8% |
16 Properties |
| 2022 | £276,164 | -27% |
38 Properties |
| 2021 | £350,544 | 10% |
52 Properties |
| 2020 | £316,162 | -18% |
35 Properties |
| 2019 | £372,664 | 17% |
38 Properties |
| 2018 | £307,521 | 14% |
41 Properties |
| 2017 | £264,818 | 17% |
44 Properties |
| 2016 | £218,754 | -44% |
55 Properties |
| 2015 | £314,418 | 33% |
50 Properties |
| 2014 | £209,894 | -70% |
46 Properties |
| 2013 | £356,575 | 7% |
54 Properties |
| 2012 | £331,203 | 13% |
48 Properties |
| 2011 | £288,574 | 21% |
48 Properties |
| 2010 | £227,174 | 16% |
31 Properties |
| 2009 | £189,748 | -4% |
51 Properties |
| 2008 | £196,560 | -4% |
44 Properties |
| 2007 | £205,375 | -39% |
85 Properties |
| 2006 | £286,260 | 35% |
41 Properties |
| 2005 | £187,250 | -58% |
2 Properties |
| 2004 | £296,384 | 34% |
13 Properties |
| 2003 | £197,071 | 20% |
7 Properties |
| 2002 | £158,125 | 42% |
4 Properties |
| 2001 | £91,300 | -57% |
5 Properties |
| 2000 | £143,711 | -31% |
5 Properties |
| 1999 | £188,625 | 59% |
4 Properties |
| 1998 | £77,000 | 17% |
5 Properties |
| 1997 | £64,100 | -7% |
5 Properties |
| 1996 | £68,750 | -19% |
6 Properties |
| 1995 | £81,500 | - |
1 Property |
Property Price per Property Type in Guiseley And Rawdon
Here you can find historic sold price data in order to help with your property search.
The average Property Paid Price for specific property types in the last three years are:
| Property Type | Average Sold Price | Sold Properties |
|---|---|---|
| Detached House | £504,500.00 | 4 Detached Houses |
| Terraced House | £375,607.00 | 13 Terraced Houses |
| Semi Detached House | £433,333.00 | 6 Semi Detached Houses |
| Flat | £213,925.00 | 39 Flats |

