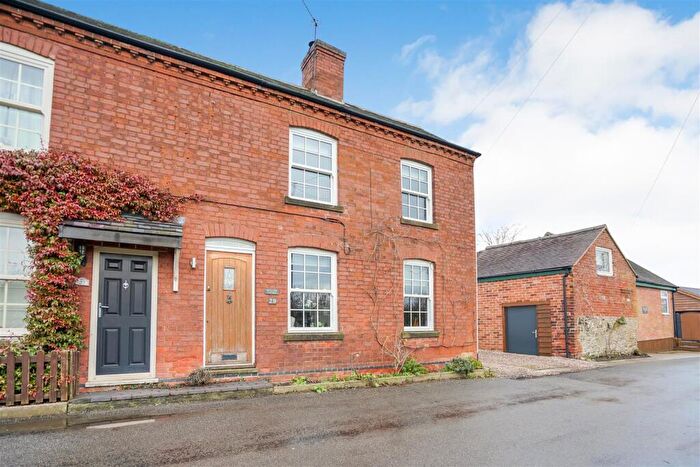
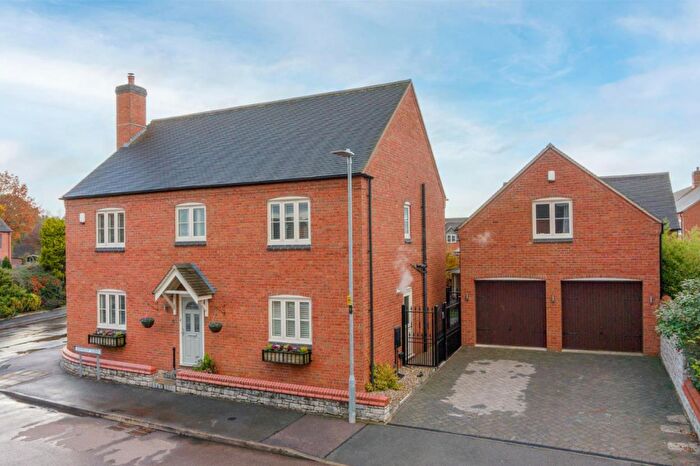
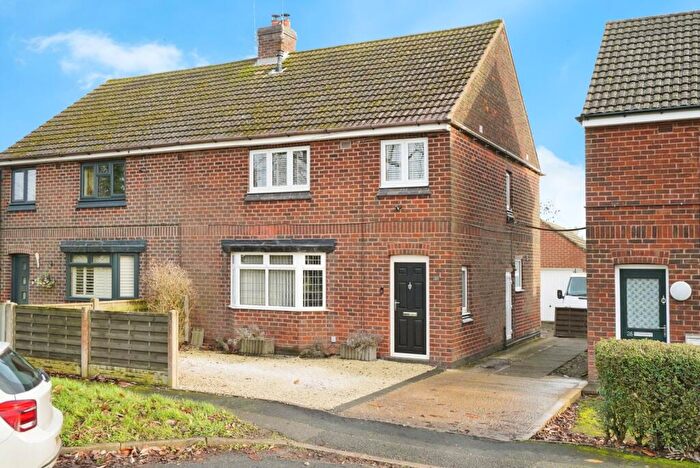
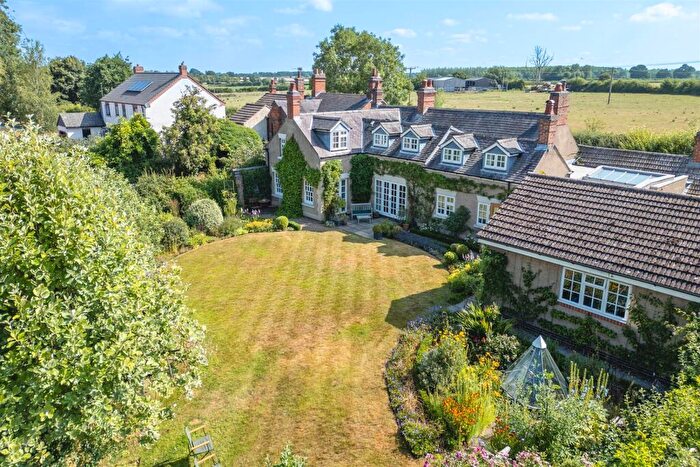
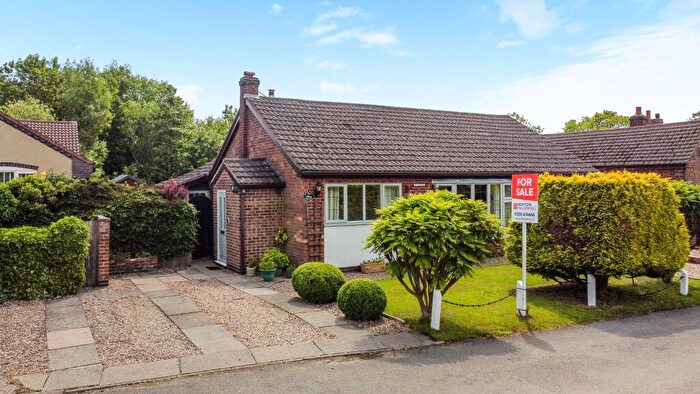
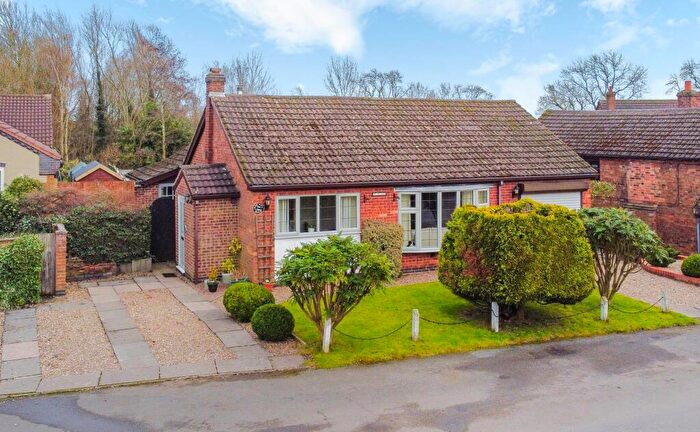
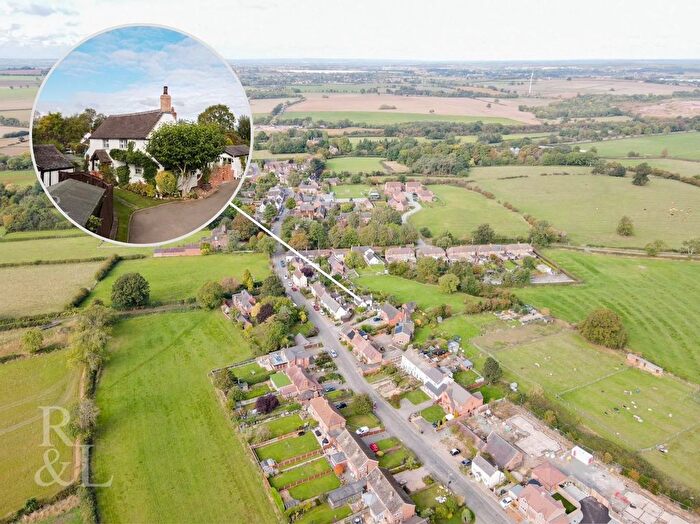
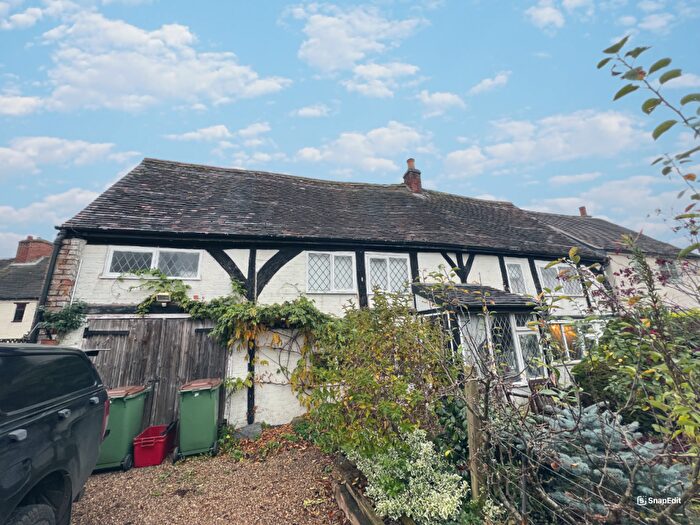
Houses for sale & to rent in Appleby, Coalville
House Prices in Appleby
Properties in Appleby have an average house price of £394,958.00 and had 12 Property Transactions within the last 3 years¹.
Appleby is an area in Coalville, Leicestershire with 262 households², where the most expensive property was sold for £627,500.00.
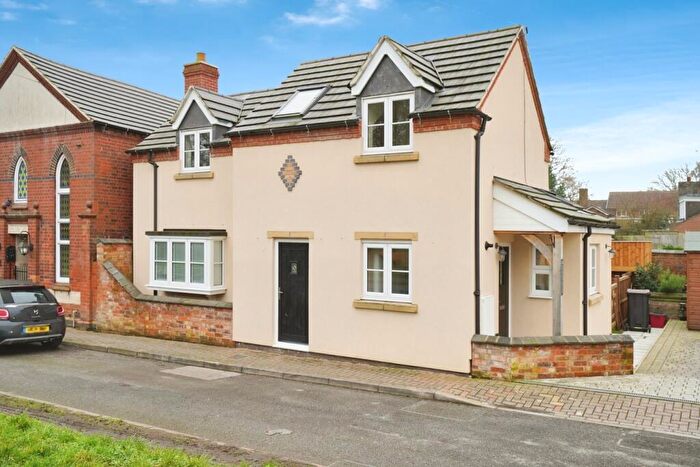
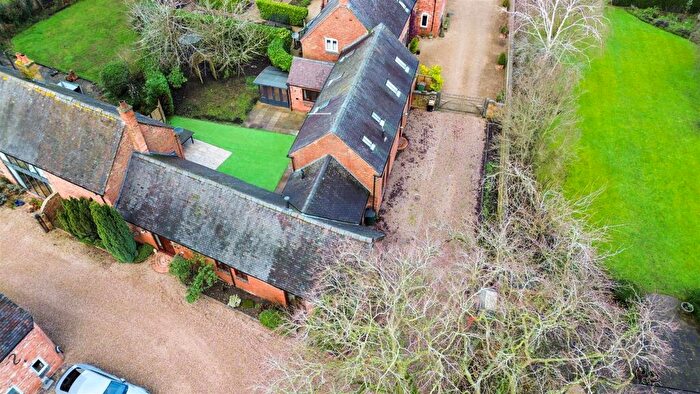
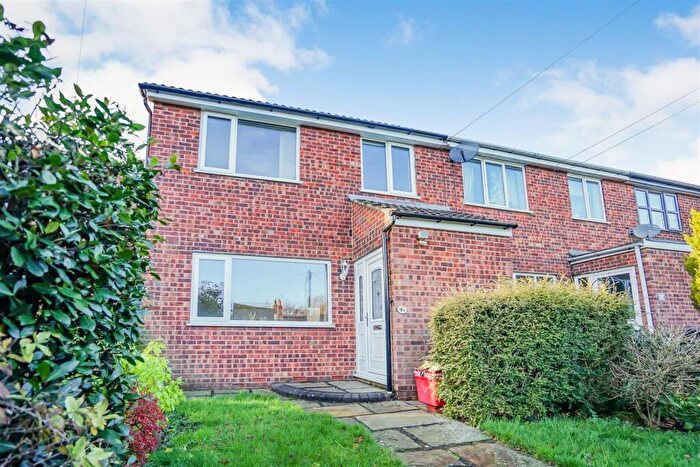
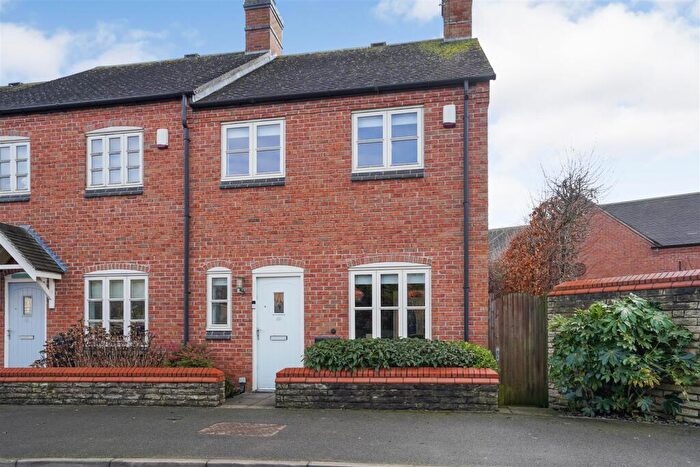
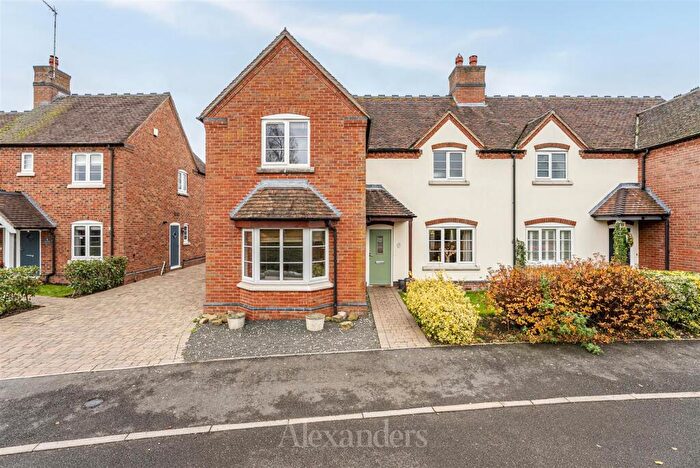
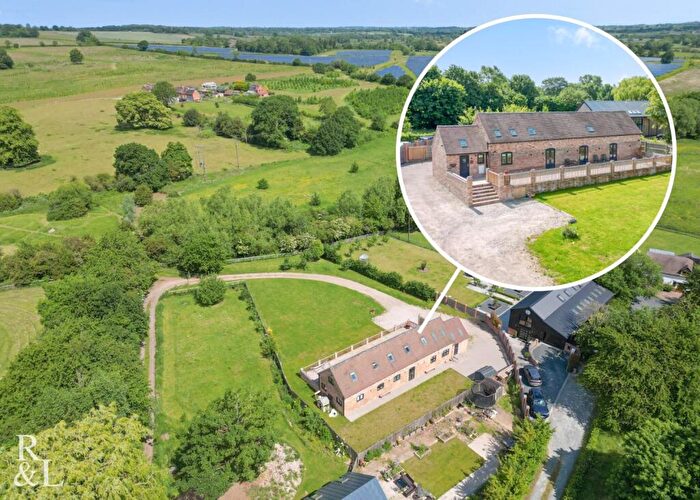
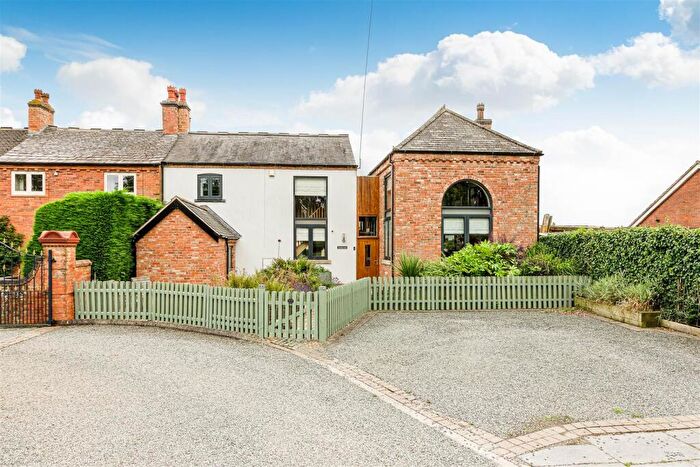
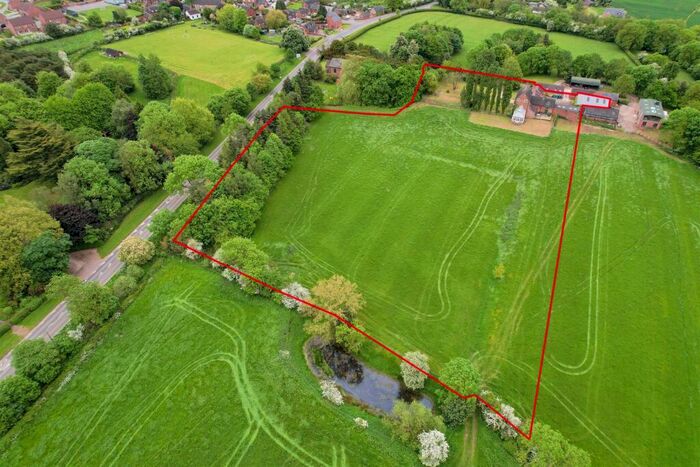
Properties for sale in Appleby
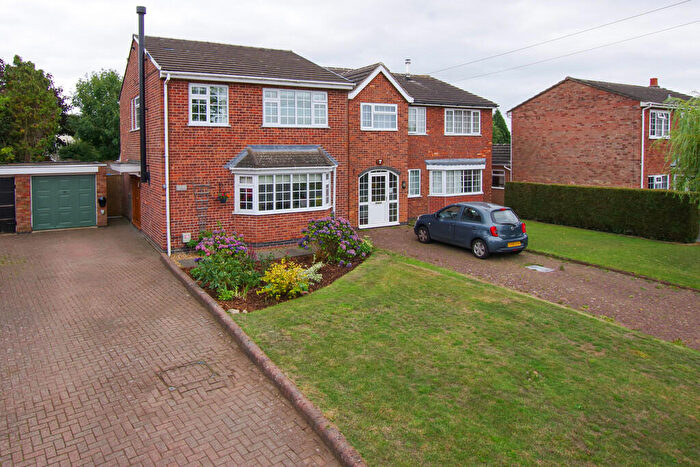
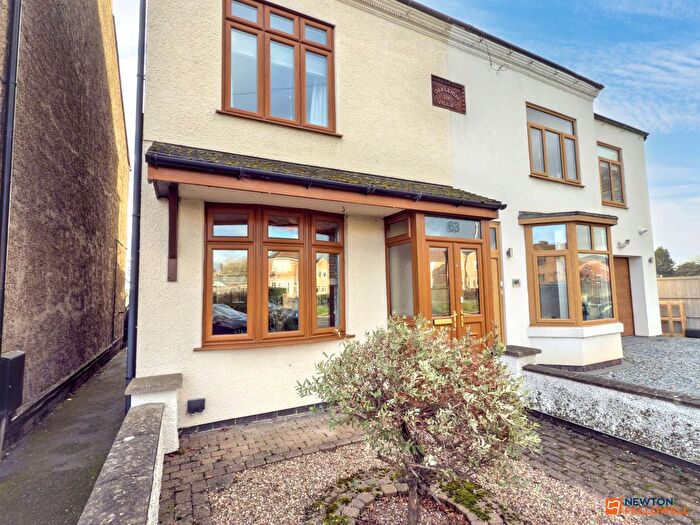
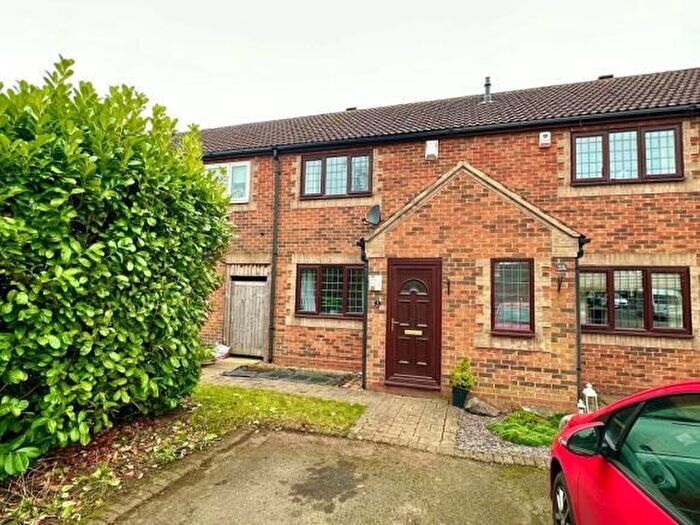
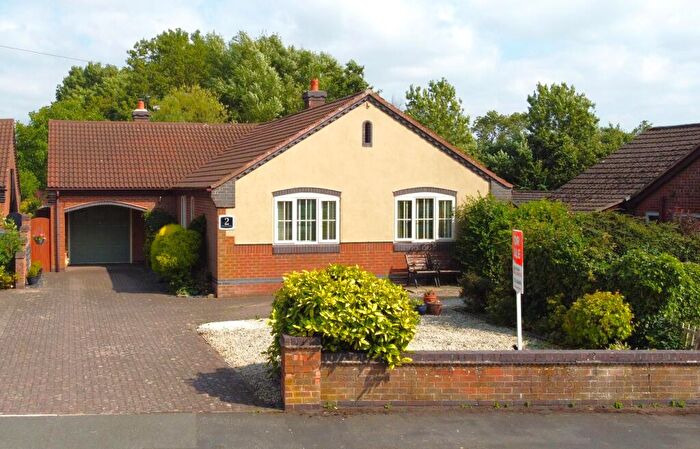
Previously listed properties in Appleby
Roads and Postcodes in Appleby
Navigate through our locations to find the location of your next house in Appleby, Coalville for sale or to rent.
| Streets | Postcodes |
|---|---|
| Ashby Road | B79 0PJ |
| Church Street | LE67 2SA |
| Dames Lane | LE67 2SB |
| Francis Lane | LE67 2SD |
| Jubilee Croft | LE67 2SW |
| Main Street | LE67 2SE LE67 2SF LE67 2SG |
| Meadow Close | LE67 2DX |
| Nethercote | LE67 2ST |
| Newton Road | LE67 2SH LE67 2SX |
| Normanton Lane | LE67 2TD |
| School Lane | LE67 2SL |
| Shackerstone Lane | LE67 2SJ |
| Snarestone Road | LE67 2SN |
| The Dairy | LE67 2RS |
| The Green | LE67 2SS |
| The Pinfold | LE67 2SP LE67 2SQ |
| Tuckers Holt Lane | LE67 2SR |
Transport near Appleby
-
Polesworth Station
-
Atherstone Station
-
Tamworth Low Level Station
-
Wilnecote Station
-
Nuneaton Station
-
Hinckley Station
-
Burton-On-Trent Station
-
Bermuda Park Station
-
Willington Station
-
Loughborough Station
- FAQ
- Price Paid By Year
- Property Type Price
Frequently asked questions about Appleby
What is the average price for a property for sale in Appleby?
The average price for a property for sale in Appleby is £394,958. This amount is 56% higher than the average price in Coalville. There are 124 property listings for sale in Appleby.
What streets have the most expensive properties for sale in Appleby?
The streets with the most expensive properties for sale in Appleby are Jubilee Croft at an average of £580,000, Main Street at an average of £462,900 and The Pinfold at an average of £417,500.
What streets have the most affordable properties for sale in Appleby?
The streets with the most affordable properties for sale in Appleby are School Lane at an average of £201,250, Snarestone Road at an average of £215,000 and Meadow Close at an average of £405,000.
Which train stations are available in or near Appleby?
Some of the train stations available in or near Appleby are Polesworth, Atherstone and Tamworth Low Level.
Property Price Paid in Appleby by Year
The average sold property price by year was:
| Year | Average Sold Price | Price Change |
Sold Properties
|
|---|---|---|---|
| 2025 | £305,000 | -40% |
2 Properties |
| 2024 | £425,642 | 10% |
7 Properties |
| 2023 | £383,333 | -17% |
3 Properties |
| 2022 | £448,833 | -1% |
12 Properties |
| 2021 | £453,325 | 11% |
10 Properties |
| 2020 | £401,942 | 9% |
7 Properties |
| 2019 | £367,000 | 19% |
7 Properties |
| 2018 | £295,931 | -6% |
8 Properties |
| 2017 | £314,745 | 3% |
10 Properties |
| 2016 | £305,583 | 25% |
6 Properties |
| 2015 | £230,545 | -61% |
11 Properties |
| 2014 | £370,777 | 32% |
9 Properties |
| 2013 | £250,571 | -68% |
7 Properties |
| 2012 | £421,991 | 28% |
6 Properties |
| 2011 | £305,520 | -11% |
10 Properties |
| 2010 | £338,596 | 33% |
15 Properties |
| 2009 | £226,888 | 15% |
9 Properties |
| 2008 | £193,937 | -73% |
8 Properties |
| 2007 | £335,722 | 6% |
9 Properties |
| 2006 | £316,981 | 17% |
8 Properties |
| 2005 | £263,655 | 8% |
8 Properties |
| 2004 | £241,783 | 19% |
12 Properties |
| 2003 | £195,363 | 8% |
19 Properties |
| 2002 | £179,525 | 30% |
12 Properties |
| 2001 | £125,416 | -21% |
9 Properties |
| 2000 | £151,500 | 6% |
3 Properties |
| 1999 | £141,800 | 5% |
13 Properties |
| 1998 | £135,015 | 27% |
10 Properties |
| 1997 | £98,750 | -10% |
10 Properties |
| 1996 | £108,909 | -9% |
11 Properties |
| 1995 | £118,909 | - |
11 Properties |
Property Price per Property Type in Appleby
Here you can find historic sold price data in order to help with your property search.
The average Property Paid Price for specific property types in the last three years are:
| Property Type | Average Sold Price | Sold Properties |
|---|---|---|
| Semi Detached House | £384,900.00 | 5 Semi Detached Houses |
| Detached House | £441,666.00 | 6 Detached Houses |
| Terraced House | £165,000.00 | 1 Terraced House |

