
Houses for sale & to rent in Bardon, Coalville
House Prices in Bardon
Properties in Bardon have an average house price of £245k and had 178 Property Transactions within the last 3 years¹.
Bardon is an area in Coalville, Leicestershire with 1,243 households², where the most expensive property was sold for £445k.
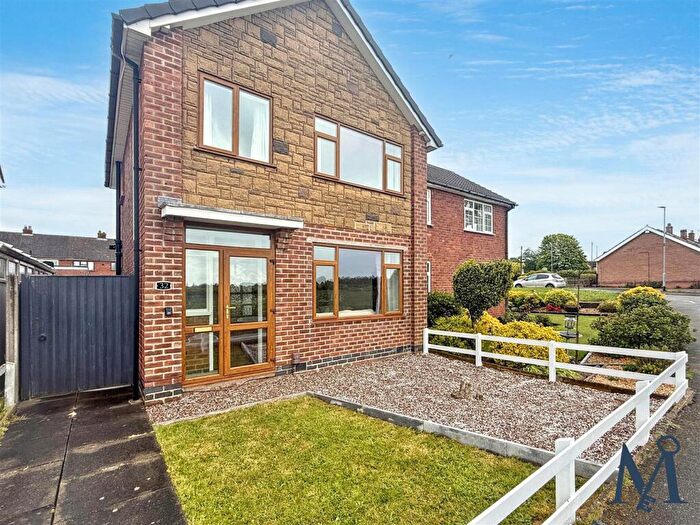
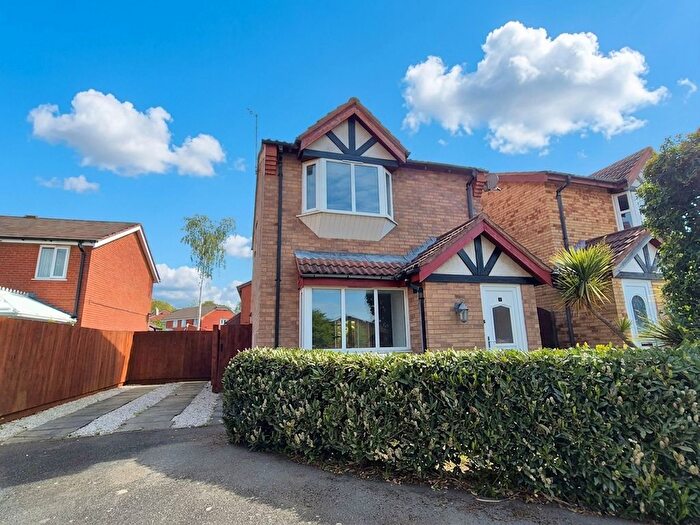
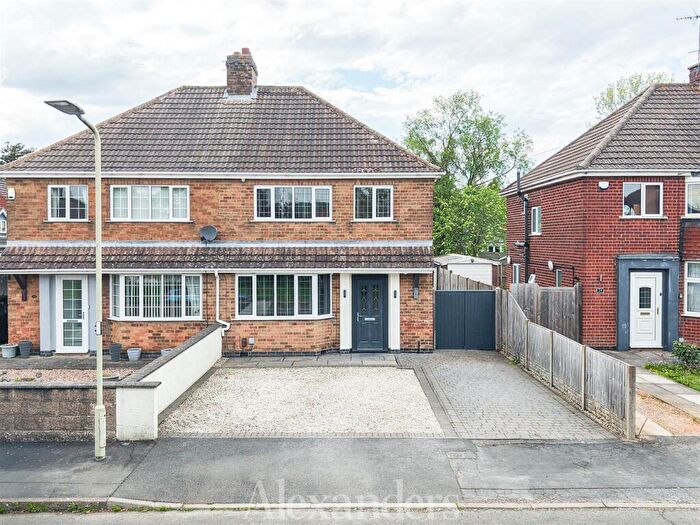
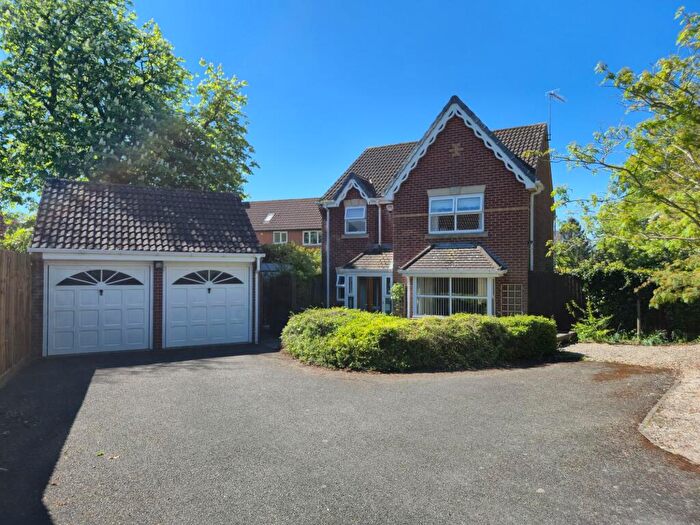
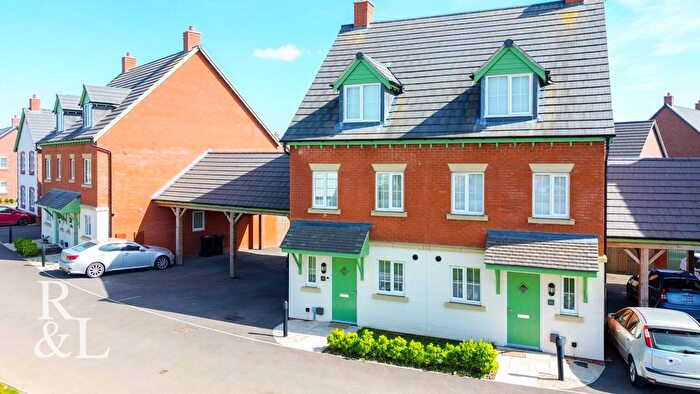
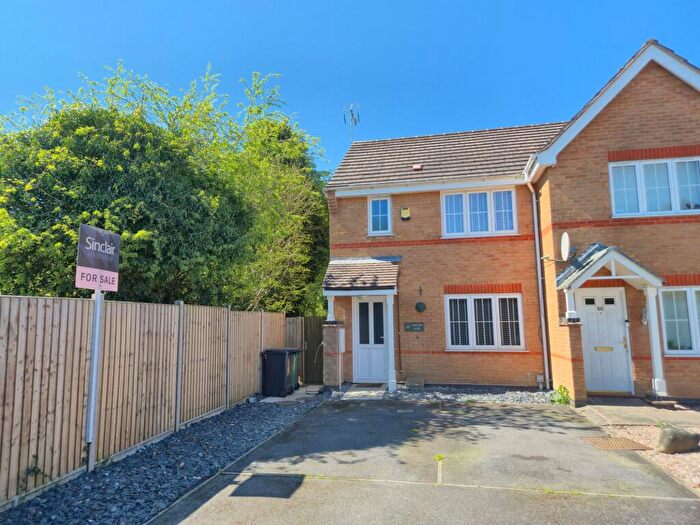
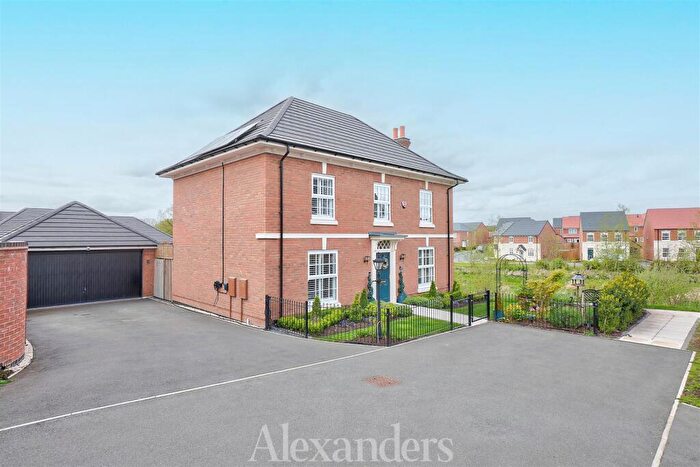
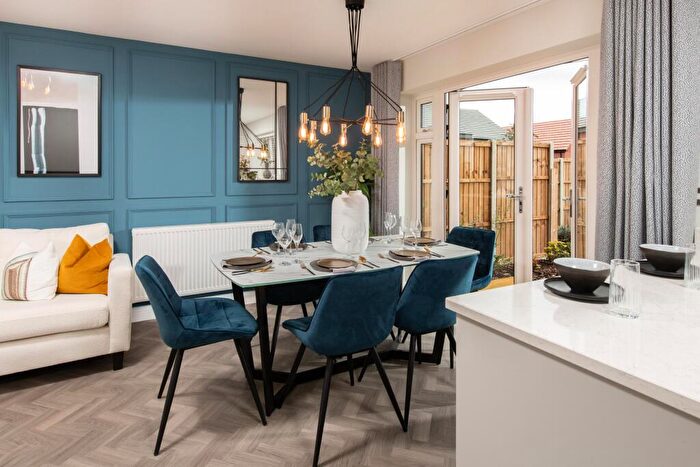
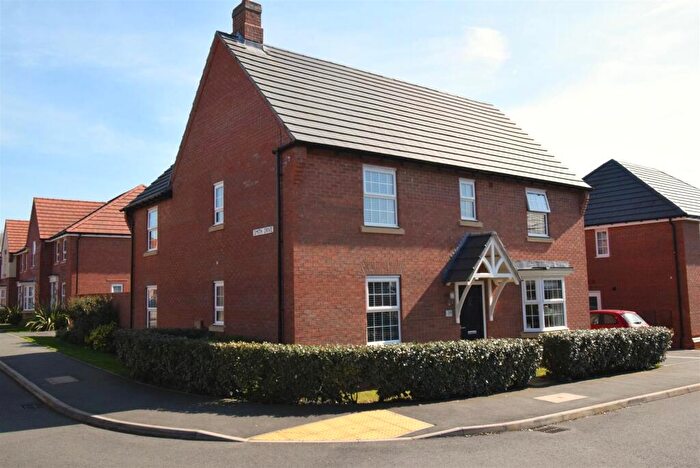
Properties for sale in Bardon
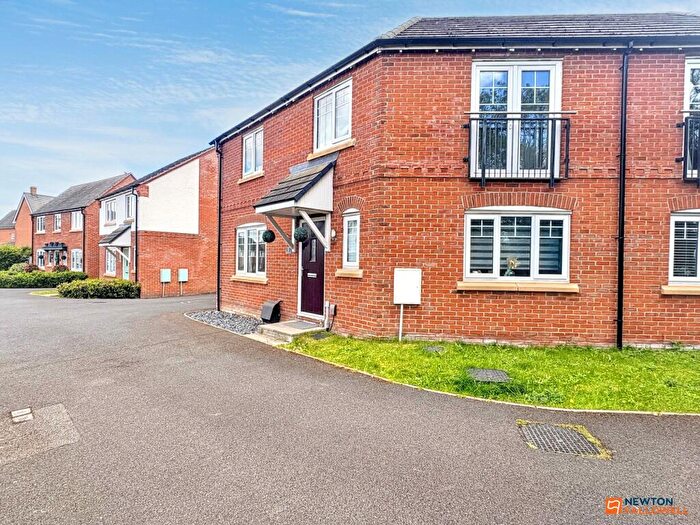
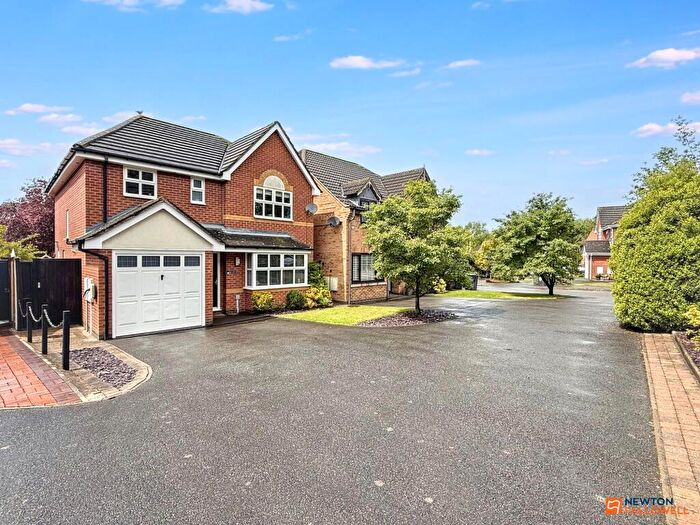
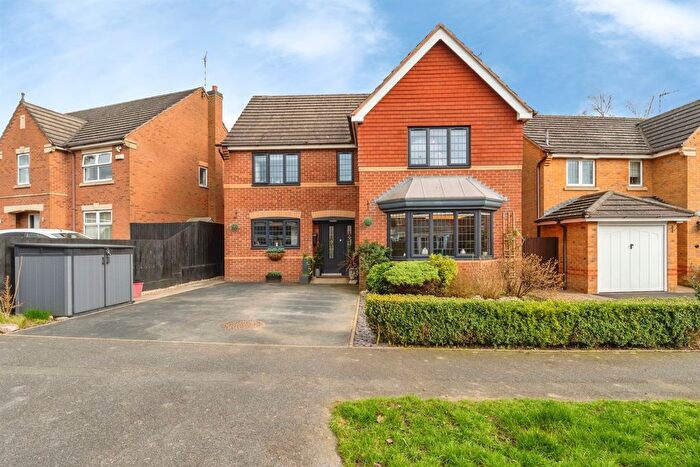
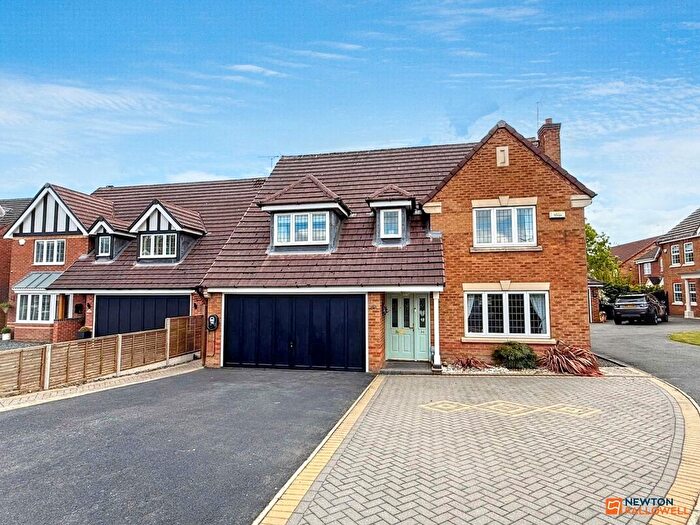
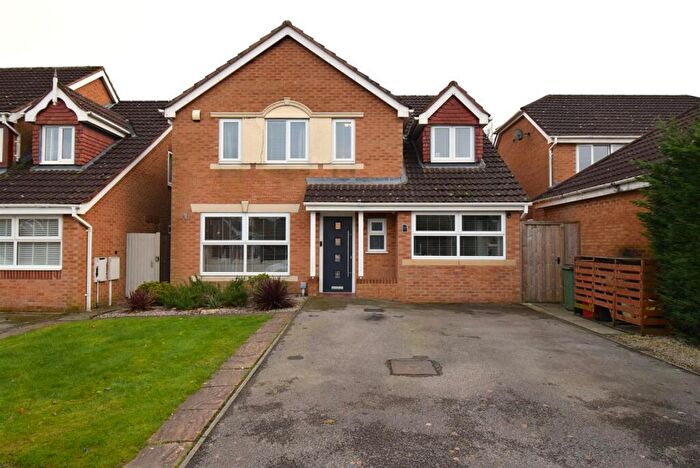
![]()
If you are looking to sell your house, let it out, or receive a property valuation, an expert can help you.
Click the button below to get started.


Roads and Postcodes in Bardon
Navigate through our locations to find the location of your next house in Bardon, Coalville for sale or to rent.
| Streets | Postcodes |
|---|---|
| Ascot Drive | LE67 4DF |
| Balmoral Road | LE67 4PE |
| Bancroft Road | LE67 4ET |
| Bardon Close | LE67 4BS |
| Bardon Hill | LE67 1TL |
| Bardon Road | LE67 1TD LE67 4BF LE67 4BG LE67 4BJ LE67 4BL |
| Beech Tree Road | LE67 4JN |
| Beeney Close | LE67 4AW |
| Botts Way | LE67 4BT |
| Brooker Close | LE67 4GJ |
| Broom Leys Road | LE67 4DB |
| Brouder Close | LE67 4GF |
| Buckingham Road | LE67 4PA LE67 4PB |
| Buttercup Drive | LE67 4AY |
| Cave Crescent | LE67 4AT |
| Clarence Drive | LE67 4PF |
| Curlew Close | LE67 4BD |
| Daisy Close | LE67 4AZ |
| Dove Road | LE67 4BY |
| Flannagan Way | LE67 4GD |
| Fort Close | LE67 4EX |
| Foxglove Road | LE67 4BA |
| Garganey Close | LE67 4QB |
| Gatcombe Drive | LE67 4DG |
| Glen Way | LE67 4BW |
| Grange Road | LE67 1TH |
| Grant Court | LE67 4EU |
| Hampton Close | LE67 4DH |
| Harding Close | LE67 4EW |
| Harker Drive | LE67 4GG |
| Headingley Close | LE67 4EF |
| Heron Way | LE67 4LD |
| Highgrove Close | LE67 4DW |
| Honeysuckle Close | LE67 4BB |
| John Cooper Way | LE67 4AP LE67 4AQ LE67 4EQ |
| John Starbuck Close | LE67 4ES |
| Kay Close | LE67 4GE |
| Kensington Road | LE67 4PG |
| Lords Close | LE67 4ED |
| Merganser Way | LE67 4QA |
| Muscovey Road | LE67 4LE |
| Nene Way | LE67 4BX |
| Oak Close | LE67 4JU |
| Page Close | LE67 4GH |
| Palmer Close | LE67 4AU |
| Poppy Close | LE67 4AX |
| Robin Road | LE67 4LB |
| Sandringham Road | LE67 4PD |
| Saunders Drive | LE67 4ER |
| School Drive | LE67 4AN |
| Shaw Lane | LE67 1SY |
| Staples Drive | LE67 4GB LE67 4GN |
| Summerfield Road | LE67 4AS |
| Sunningdale Road | LE67 4DS |
| Swan Way | LE67 4BU |
| Sycamore Road | LE67 4JS |
| Teal Close | LE67 4LF |
| The Crescent | LE67 1TS |
| The Oval | LE67 4EA LE67 4EB |
| Trent Bridge | LE67 4EE |
| Waterworks Road | LE67 4GL LE67 4JJ LE67 4HZ |
| Welland Close | LE67 4BZ |
Transport near Bardon
-
 Loughborough Station
 -
Barrow-Upon-Soar Station
-
Sileby Station
-
East Midlands Parkway Station
-
Leicester Station
-
Syston Station
-
Narborough Station
-
Long Eaton Station
-
Hinckley Station
-
Polesworth Station
- FAQ
- Price Paid By Year
- Property Type Price
Frequently asked questions about Bardon
What is the average price for a property for sale in Bardon?
The average price for a property for sale in Bardon is £245,019. This amount is 3% lower than the average price in Coalville. There are 879 property listings for sale in Bardon.
What streets have the most expensive properties for sale in Bardon?
The streets with the most expensive properties for sale in Bardon are Buckingham Road at an average of £425,500, Balmoral Road at an average of £405,000 and Ascot Drive at an average of £405,000.
What streets have the most affordable properties for sale in Bardon?
The streets with the most affordable properties for sale in Bardon are Waterworks Road at an average of £162,272, Flannagan Way at an average of £171,800 and Kay Close at an average of £177,500.
Which train stations are available in or near Bardon?
Some of the train stations available in or near Bardon are Loughborough, Barrow-Upon-Soar and Sileby.
Property Price Paid in Bardon by Year
The average sold property price by year was:
| Year | Average Sold Price | Price Change |
Sold Properties
|
|---|---|---|---|
| 2026 | £227,000 | -12% |
5 Properties |
| 2025 | £253,722 | 5% |
67 Properties |
| 2024 | £241,740 | 1% |
63 Properties |
| 2023 | £238,359 | -3% |
43 Properties |
| 2022 | £246,545 | 7% |
72 Properties |
| 2021 | £229,201 | 9% |
80 Properties |
| 2020 | £208,734 | 4% |
64 Properties |
| 2019 | £200,581 | -0,5% |
72 Properties |
| 2018 | £201,552 | 3% |
149 Properties |
| 2017 | £195,177 | 9% |
161 Properties |
| 2016 | £177,421 | 15% |
111 Properties |
| 2015 | £151,386 | -2% |
74 Properties |
| 2014 | £153,840 | -2% |
83 Properties |
| 2013 | £157,506 | 4% |
51 Properties |
| 2012 | £151,202 | 7% |
38 Properties |
| 2011 | £140,821 | -16% |
50 Properties |
| 2010 | £162,666 | -4% |
51 Properties |
| 2009 | £169,734 | 9% |
42 Properties |
| 2008 | £154,439 | -7% |
75 Properties |
| 2007 | £165,267 | 2% |
130 Properties |
| 2006 | £162,655 | 10% |
181 Properties |
| 2005 | £146,725 | 3% |
169 Properties |
| 2004 | £141,616 | 2% |
112 Properties |
| 2003 | £139,403 | 15% |
102 Properties |
| 2002 | £118,336 | 13% |
172 Properties |
| 2001 | £102,741 | 10% |
147 Properties |
| 2000 | £92,551 | 16% |
161 Properties |
| 1999 | £77,709 | -2% |
179 Properties |
| 1998 | £79,022 | 23% |
114 Properties |
| 1997 | £61,013 | 4% |
110 Properties |
| 1996 | £58,789 | 8% |
81 Properties |
| 1995 | £53,950 | - |
46 Properties |
Property Price per Property Type in Bardon
Here you can find historic sold price data in order to help with your property search.
The average Property Paid Price for specific property types in the last three years are:
| Property Type | Average Sold Price | Sold Properties |
|---|---|---|
| Semi Detached House | £220,098.00 | 70 Semi Detached Houses |
| Detached House | £299,383.00 | 68 Detached Houses |
| Terraced House | £206,374.00 | 36 Terraced Houses |
| Flat | £104,750.00 | 4 Flats |