
Houses for sale & to rent in Snibston, Coalville
House Prices in Snibston
Properties in Snibston have an average house price of £210k and had 277 Property Transactions within the last 3 years¹.
Snibston is an area in Coalville, Leicestershire with 2,211 households², where the most expensive property was sold for £520k.
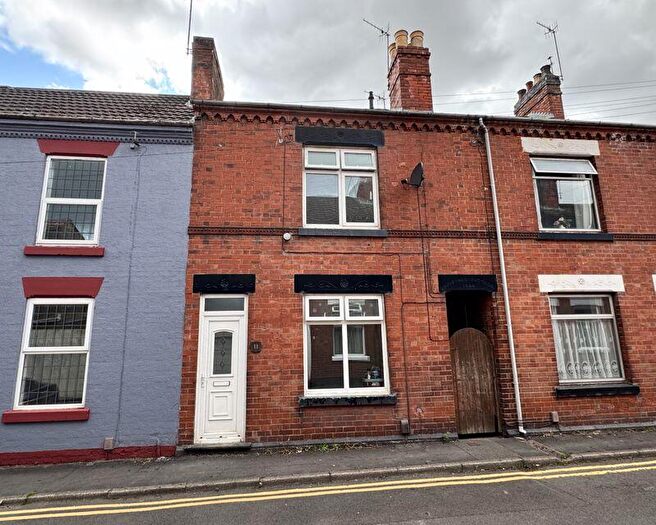
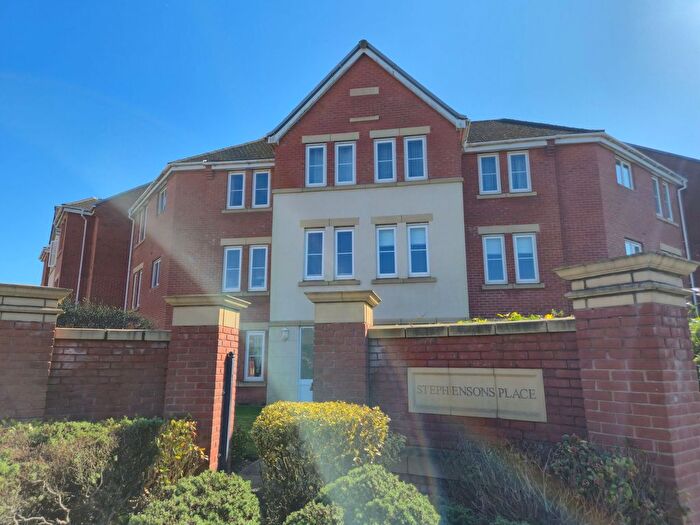
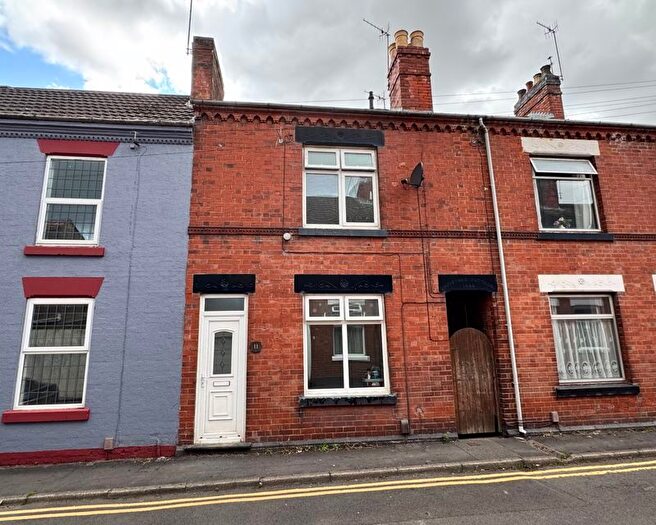
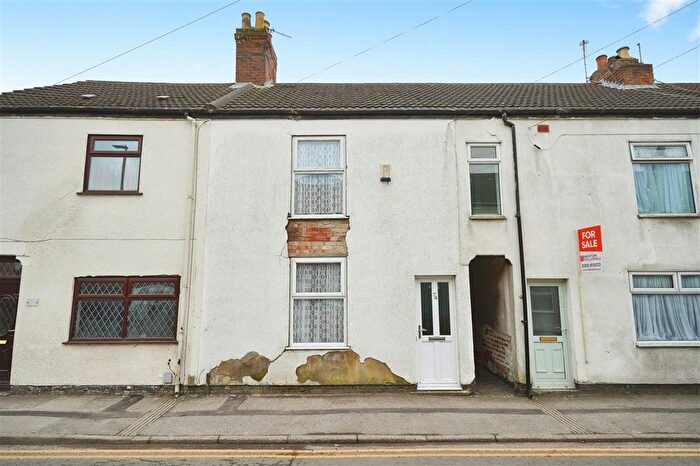
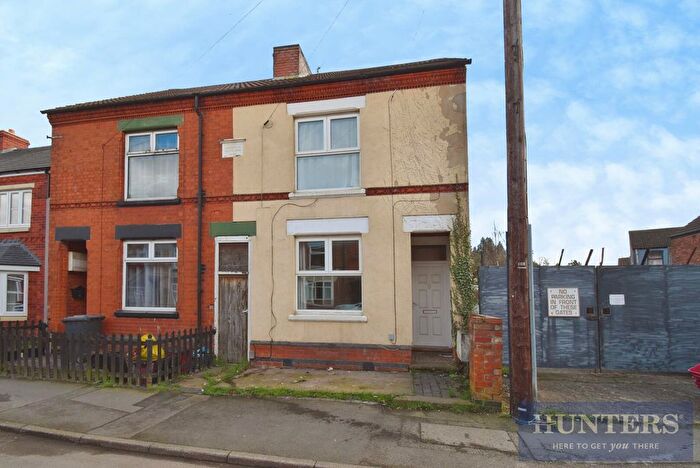
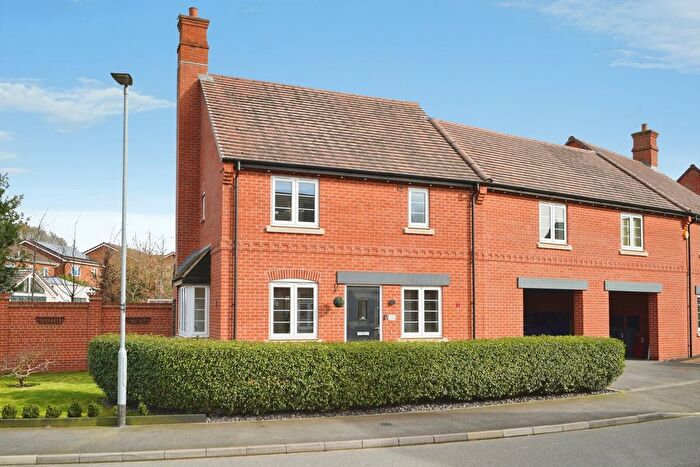
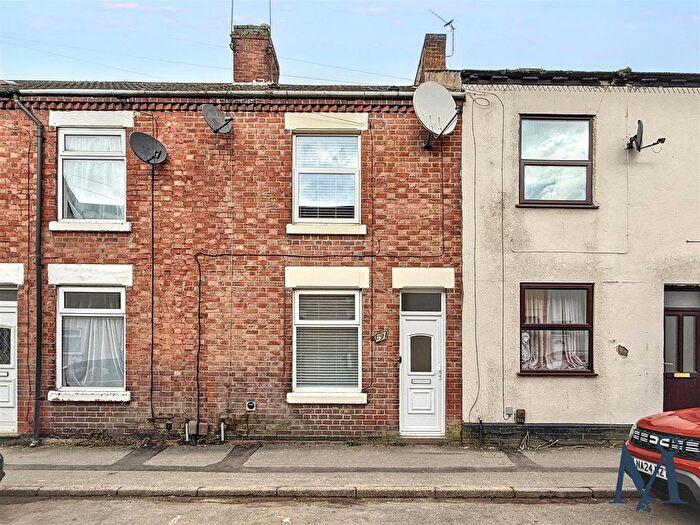
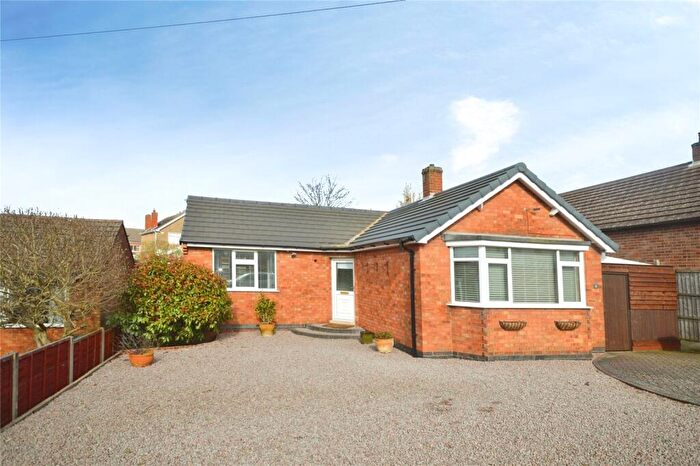
Properties for sale in Snibston
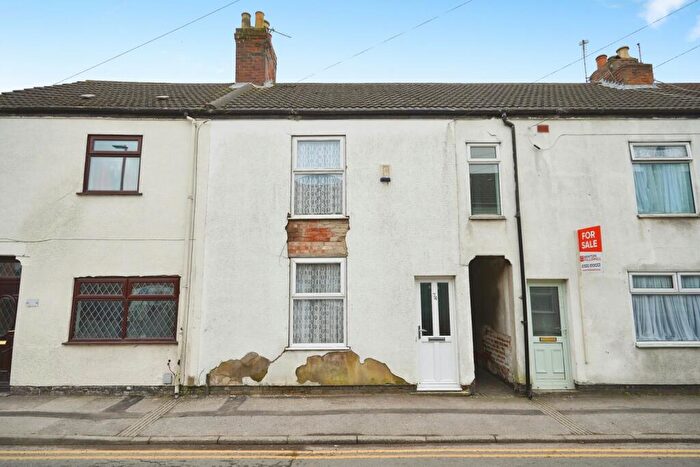

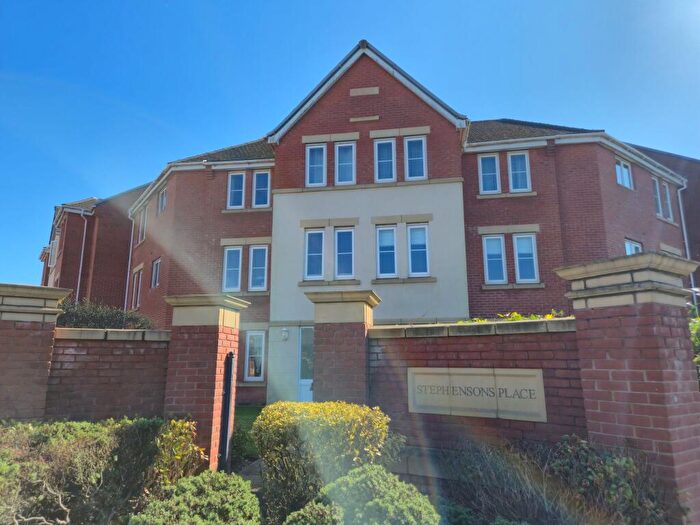
![]()
If you are looking to sell your house, let it out, or receive a property valuation, an expert can help you.
Click the button below to get started.


Roads and Postcodes in Snibston
Navigate through our locations to find the location of your next house in Snibston, Coalville for sale or to rent.
| Streets | Postcodes |
|---|---|
| All Saints Close | LE67 3LL |
| Ash Tree Road | LE67 2XG |
| Ashby Road | LE67 3EJ LE67 3JZ LE67 3LA LE67 3LB LE67 3LD LE67 3LE LE67 3LG LE67 3LH LE67 3LJ |
| Ashland Drive | LE67 3NH |
| Aspen Close | LE67 2JS |
| Bakehouse Close | LE67 2DF |
| Bedale Close | LE67 3BE |
| Bellway Close | LE67 3ND |
| Belmont Drive | LE67 3LQ |
| Belvoir Road | LE67 3PN LE67 3PP LE67 3PQ LE67 3PR |
| Berry Close | LE67 2NU |
| Bloom Close | LE67 2NT |
| Boylan Road | LE67 3JG |
| Bracken Close | LE67 2GP |
| Brambles Road | LE67 2GH |
| Briar Close | LE67 2GN |
| Brunel Way | LE67 3HF |
| Buckthorn Road | LE67 3QB |
| Burgess Road | LE67 3PX |
| Camelford Road | LE67 2HZ |
| Cavendish Crescent | LE67 2GY |
| Central Road | LE67 2FL LE67 2FN |
| Chapel Close | LE67 2JT |
| Charles Street | LE67 3LS |
| Chiswell Drive | LE67 3DZ LE67 3JX |
| Claremont Drive | LE67 2ND |
| Clutsom Road | LE67 3QF |
| Coalville Lane | LE67 2LR |
| Coppice Close | LE67 2NS |
| Copse Close | LE67 2GL |
| Crescent Road | LE67 2BB LE67 2BD LE67 2BE LE67 2BF |
| Dayton Close | LE67 3RG |
| Degens Way | LE67 2XD |
| Discovery Close | LE67 3AW |
| Fairfield Road | LE67 2HG |
| Floret Close | LE67 2NY |
| Fordice Close | LE67 2HY |
| Formans Way | LE67 2NX |
| Fulton Drive | LE67 3NN |
| Garfield Road | LE67 2HU |
| Glebe View | LE67 3NJ |
| Gorse Road | LE67 2GQ |
| Gutteridge Street | LE67 3BG LE67 3BH LE67 3BJ |
| Harrison Place | LE67 3NY |
| Headstock Close | LE67 3BY |
| Hedge Road | LE67 2GJ |
| Hemlock Road | LE67 3NZ |
| Highfield Street | LE67 3BL LE67 3BN LE67 3BP LE67 3BQ LE67 3BR LE67 3BS LE67 3BT |
| Jacks Walk | LE67 2XA |
| Jackson Street | LE67 3NP |
| James Street | LE67 3BW LE67 3BX |
| Kemp Road | LE67 3QL |
| Kendrick Close | LE67 3LR |
| Larch Drive | LE67 3NL |
| Launceston Drive | LE67 2HW |
| Marsden Close | LE67 2JU |
| Oak Tree Road | LE67 2XB |
| Orchard Close | LE67 2JW |
| Pollard Way | LE67 2NJ |
| Ravenstone Road | LE67 3NA LE67 3NB |
| Snipe Close | LE67 2XE |
| Spruce Drive | LE67 3NT |
| St Faiths Drive | LE67 3DQ |
| St Saviours Road | LE67 3DF |
| St Vincents Close | LE67 3DR |
| Stadium Close | LE67 3NX |
| Standard Hill | LE67 3HJ LE67 3HL LE67 3HN |
| Swannington Road | LE67 3NE |
| Tavistock Close | LE67 2HX |
| Telford Way | LE67 3HE |
| The Limes | LE67 2NW |
| The Spinney | LE67 2GS |
| Thorntree Close | LE67 2JY |
| Totnes Close | LE67 2GZ |
| Vaughan Street | LE67 3GG LE67 3GH |
| Wentworth Road | LE67 3DJ LE67 3DL |
| Western Avenue | LE67 3NG |
| Woods Close | LE67 2GR |
| Zetland Close | LE67 3DN |
Transport near Snibston
-
 Loughborough Station
 -
Barrow-Upon-Soar Station
-
East Midlands Parkway Station
-
Sileby Station
-
Polesworth Station
-
Willington Station
-
Long Eaton Station
-
Atherstone Station
-
Burton-On-Trent Station
-
Leicester Station
- FAQ
- Price Paid By Year
- Property Type Price
Frequently asked questions about Snibston
What is the average price for a property for sale in Snibston?
The average price for a property for sale in Snibston is £209,730. This amount is 17% lower than the average price in Coalville. There are 978 property listings for sale in Snibston.
What streets have the most expensive properties for sale in Snibston?
The streets with the most expensive properties for sale in Snibston are St Faiths Drive at an average of £520,000, Glebe View at an average of £450,000 and Degens Way at an average of £350,000.
What streets have the most affordable properties for sale in Snibston?
The streets with the most affordable properties for sale in Snibston are Belvoir Road at an average of £130,666, James Street at an average of £143,040 and Central Road at an average of £144,428.
Which train stations are available in or near Snibston?
Some of the train stations available in or near Snibston are Loughborough, Barrow-Upon-Soar and East Midlands Parkway.
Property Price Paid in Snibston by Year
The average sold property price by year was:
| Year | Average Sold Price | Price Change |
Sold Properties
|
|---|---|---|---|
| 2026 | £161,166 | -32% |
3 Properties |
| 2025 | £211,977 | -2% |
75 Properties |
| 2024 | £216,536 | 7% |
112 Properties |
| 2023 | £200,704 | -1% |
87 Properties |
| 2022 | £202,465 | 4% |
121 Properties |
| 2021 | £194,447 | 13% |
128 Properties |
| 2020 | £169,955 | 4% |
97 Properties |
| 2019 | £163,171 | 6% |
110 Properties |
| 2018 | £154,175 | 1% |
151 Properties |
| 2017 | £152,384 | -1% |
141 Properties |
| 2016 | £153,377 | 10% |
128 Properties |
| 2015 | £138,130 | -1% |
146 Properties |
| 2014 | £140,006 | 5% |
144 Properties |
| 2013 | £133,617 | 5% |
106 Properties |
| 2012 | £126,369 | 1% |
125 Properties |
| 2011 | £125,061 | -4% |
78 Properties |
| 2010 | £129,534 | 4% |
81 Properties |
| 2009 | £124,688 | -3% |
53 Properties |
| 2008 | £128,392 | -9% |
85 Properties |
| 2007 | £140,103 | 10% |
151 Properties |
| 2006 | £126,436 | 5% |
166 Properties |
| 2005 | £119,954 | -3% |
115 Properties |
| 2004 | £123,210 | 22% |
173 Properties |
| 2003 | £95,679 | 15% |
146 Properties |
| 2002 | £81,247 | 15% |
199 Properties |
| 2001 | £69,448 | 11% |
264 Properties |
| 2000 | £62,034 | 13% |
170 Properties |
| 1999 | £53,894 | 10% |
121 Properties |
| 1998 | £48,523 | -1% |
100 Properties |
| 1997 | £48,776 | -1% |
139 Properties |
| 1996 | £49,252 | -9% |
152 Properties |
| 1995 | £53,763 | - |
139 Properties |
Property Price per Property Type in Snibston
Here you can find historic sold price data in order to help with your property search.
The average Property Paid Price for specific property types in the last three years are:
| Property Type | Average Sold Price | Sold Properties |
|---|---|---|
| Semi Detached House | £210,168.00 | 102 Semi Detached Houses |
| Detached House | £284,466.00 | 71 Detached Houses |
| Terraced House | £158,206.00 | 101 Terraced Houses |
| Flat | £160,666.00 | 3 Flats |