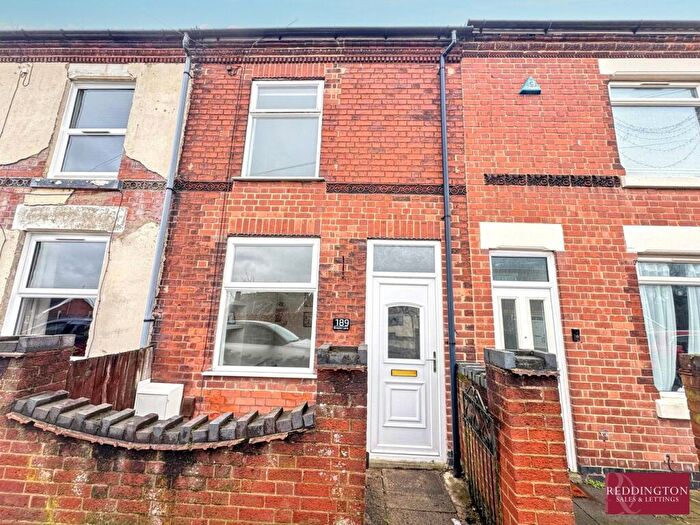
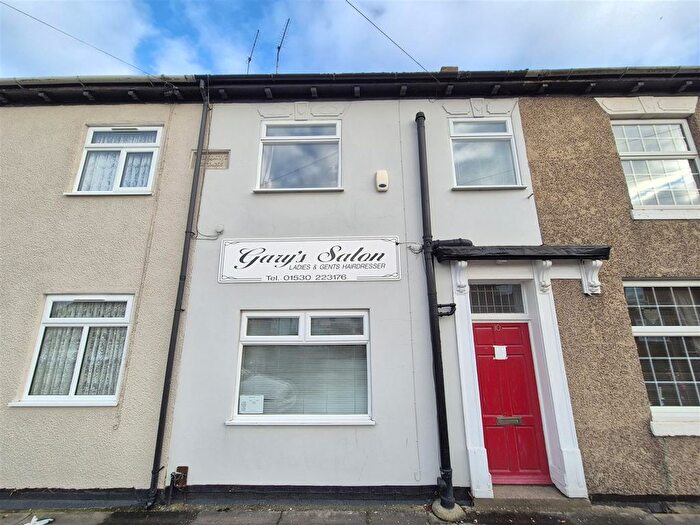
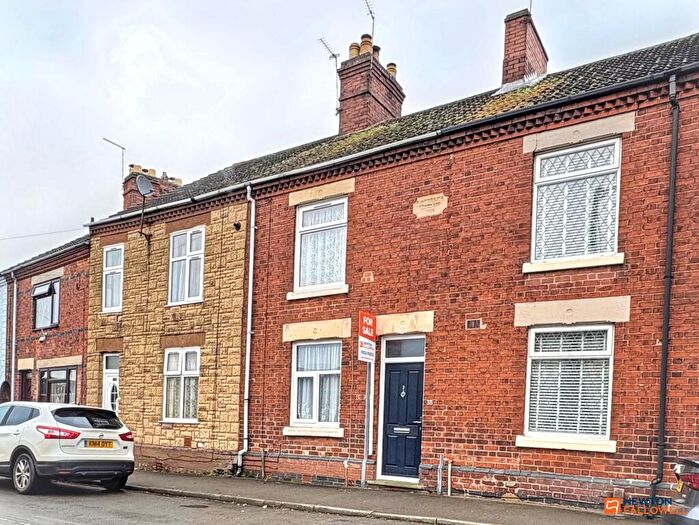
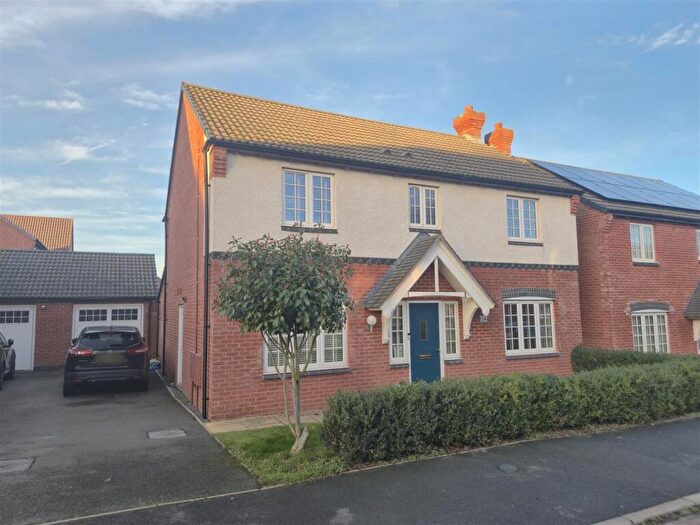
Houses for sale & to rent in Thringstone, Coalville
House Prices in Thringstone
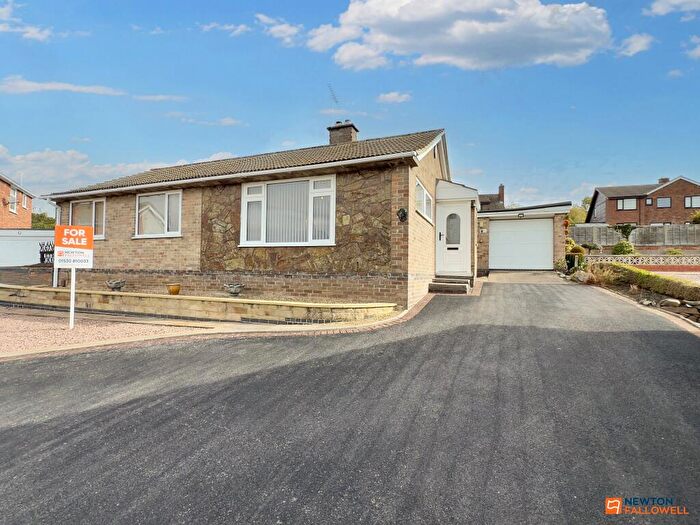
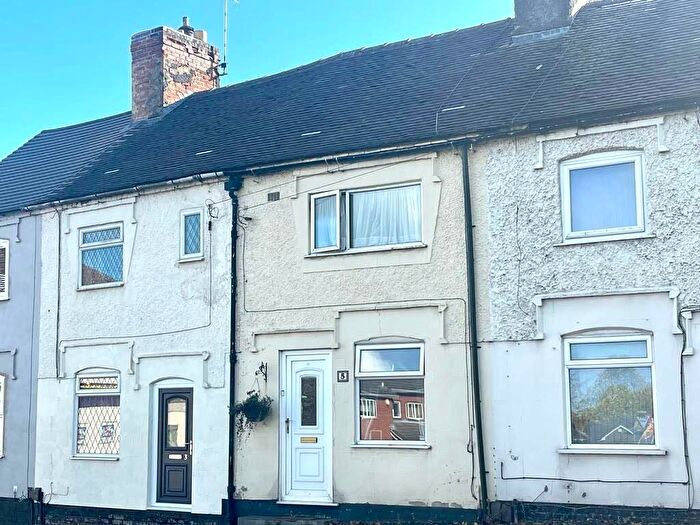
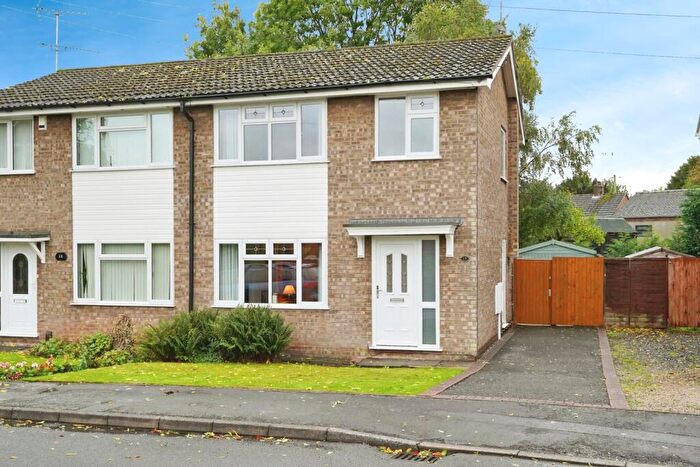
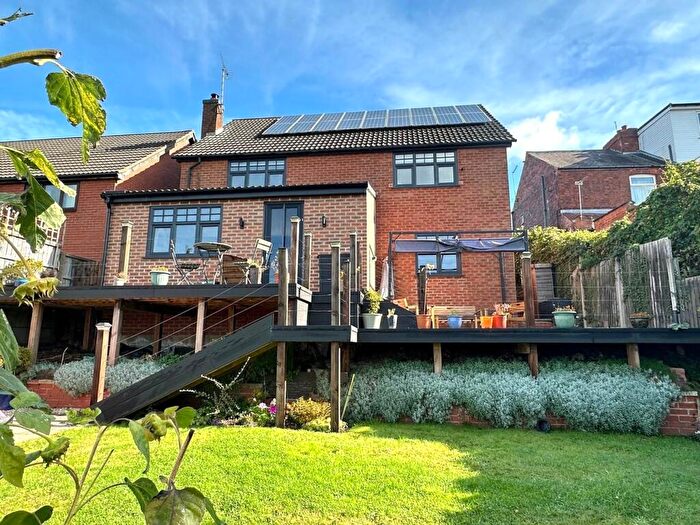
Properties in Thringstone have an average house price of £240,147.00 and had 168 Property Transactions within the last 3 years¹.
Thringstone is an area in Coalville, Leicestershire with 1,823 households², where the most expensive property was sold for £568,000.00.
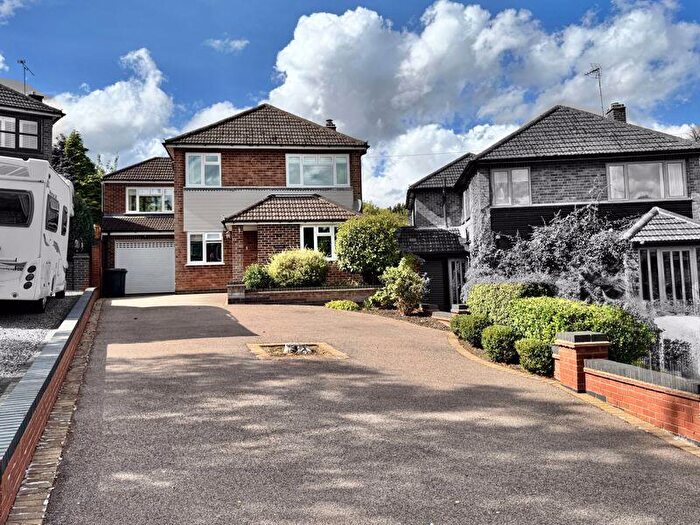
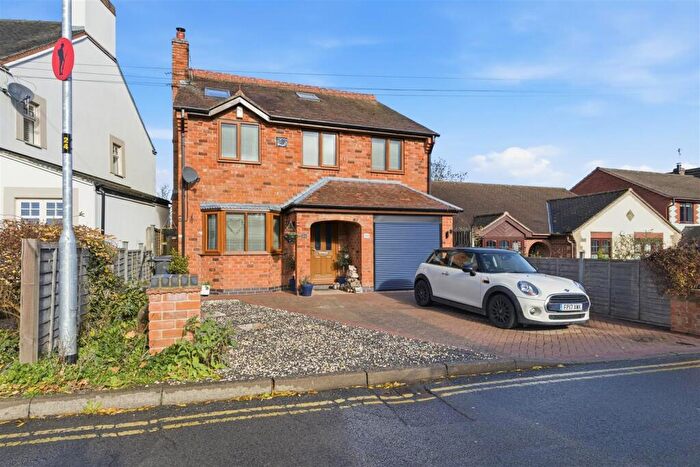
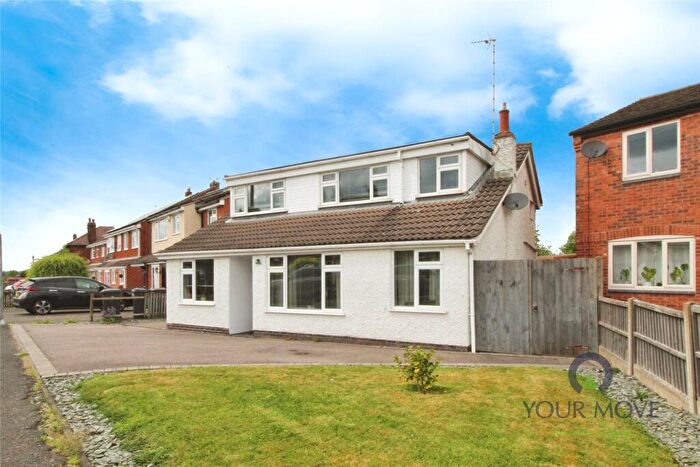
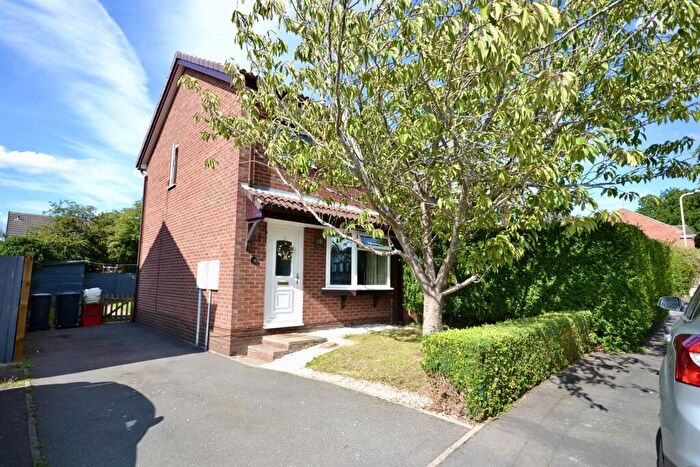
Properties for sale in Thringstone
Roads and Postcodes in Thringstone
Navigate through our locations to find the location of your next house in Thringstone, Coalville for sale or to rent.
| Streets | Postcodes |
|---|---|
| Ash Dale | LE67 8LW |
| Aspens Hollow | LE67 8PX |
| Badgers Croft | LE67 8JB |
| Bishop Dale | LE67 8LX |
| Booth Road | LE67 8LA LE67 8LB |
| Bridle Road | LE67 3GB |
| Brook Lane | LE67 8DD |
| Brooks Lane | LE67 5DE LE67 5DF LE67 5DG LE67 5DZ |
| Carr Hill Road | LE67 5AF |
| Carter Dale | LE67 5AJ |
| Church Lane | LE67 5DL LE67 5DQ |
| Clover Place | LE67 8LD |
| Clyde Court | LE67 8LE |
| Cooper Close | LE67 5JZ |
| Coverdale | LE67 5BP |
| Cragdale | LE67 5BJ |
| Dalkeith Walk | LE67 8LF |
| Dumps Road | LE67 5AL |
| Elgin Walk | LE67 8LG |
| Farndale | LE67 5BQ |
| Field Close | LE67 8PU |
| Field View | LE67 5DR |
| Fortnam Close | LE67 8NQ |
| Gee Lane | LE67 8AF |
| Glebe Road | LE67 8NU LE67 8NW |
| Grace Dieu Road | LE67 5AN LE67 5AP |
| Griffin Road | LE67 8AA |
| Heathfield | LE67 8LU |
| Hensons Lane | LE67 8LH LE67 8LJ |
| Holcombe Close | LE67 5BR |
| Homestead Road | LE67 8LL |
| Howe Road | LE67 5ER |
| John Street | LE67 8LN |
| Johnson Close | LE67 8JQ |
| Jones Close | LE67 8AE |
| Land Lying To The West Of | LE67 5AX |
| Langton Close | LE67 5BS |
| Loughborough Road | LE67 8LP LE67 8LQ LE67 8LR LE67 8LS |
| Main Street | LE67 8NA LE67 8NB LE67 8ND LE67 8NE |
| Martin Close | LE67 5DY |
| Melrose Road | LE67 8NF LE67 8NG LE67 8NH LE67 8PT |
| Millhouse Estate | LE67 8NJ |
| Mossdale | LE67 5BL |
| Old Bakery Close | LE67 8AB |
| Priory Close | LE67 8NX |
| Rennocks Place | LE67 8AD |
| Robinson Road | LE67 5EZ |
| Rosedale | LE67 5BH |
| Rumsey Close | LE67 8NY |
| School Lane | LE67 5HE |
| Shrewsbury Walk | LE67 8NN |
| Spring Lane | LE67 3TG |
| Springfield | LE67 8LT |
| St Andrews Close | LE67 8NP |
| Swallowdale | LE67 8LY |
| Talbot Lane | LE67 5NQ |
| Talbot Street | LE67 5AW LE67 5AY LE67 5AZ |
| The Elms | LE67 5HU |
| The Green | LE67 8NR |
| The Orchards | LE67 8AL |
| Thornborough Road | LE67 3TJ LE67 3TL LE67 3TN |
| Tithe Close | LE67 8LZ |
| Valley Way | LE67 5ES |
| Whitwick Moor | LE67 8NS |
Transport near Thringstone
- FAQ
- Price Paid By Year
- Property Type Price
Frequently asked questions about Thringstone
What is the average price for a property for sale in Thringstone?
The average price for a property for sale in Thringstone is £240,147. This amount is 5% lower than the average price in Coalville. There are 309 property listings for sale in Thringstone.
What streets have the most expensive properties for sale in Thringstone?
The streets with the most expensive properties for sale in Thringstone are Grace Dieu Road at an average of £375,000, Rumsey Close at an average of £370,000 and Griffin Road at an average of £345,000.
What streets have the most affordable properties for sale in Thringstone?
The streets with the most affordable properties for sale in Thringstone are Elgin Walk at an average of £128,000, Bridle Road at an average of £150,000 and John Street at an average of £153,500.
Which train stations are available in or near Thringstone?
Some of the train stations available in or near Thringstone are Loughborough, East Midlands Parkway and Barrow-Upon-Soar.
Property Price Paid in Thringstone by Year
The average sold property price by year was:
| Year | Average Sold Price | Price Change |
Sold Properties
|
|---|---|---|---|
| 2025 | £233,649 | -3% |
46 Properties |
| 2024 | £240,562 | -2% |
64 Properties |
| 2023 | £244,844 | 1% |
58 Properties |
| 2022 | £243,402 | 7% |
70 Properties |
| 2021 | £226,439 | 12% |
86 Properties |
| 2020 | £198,450 | 5% |
47 Properties |
| 2019 | £189,130 | -15% |
65 Properties |
| 2018 | £217,666 | 9% |
102 Properties |
| 2017 | £197,961 | 6% |
103 Properties |
| 2016 | £186,100 | 3% |
69 Properties |
| 2015 | £179,834 | 11% |
69 Properties |
| 2014 | £160,773 | 8% |
70 Properties |
| 2013 | £148,657 | 5% |
44 Properties |
| 2012 | £141,485 | -2% |
54 Properties |
| 2011 | £143,998 | -18% |
45 Properties |
| 2010 | £170,227 | 26% |
38 Properties |
| 2009 | £125,775 | -34% |
36 Properties |
| 2008 | £168,178 | 7% |
38 Properties |
| 2007 | £157,104 | -2% |
86 Properties |
| 2006 | £160,567 | 5% |
92 Properties |
| 2005 | £153,190 | 4% |
56 Properties |
| 2004 | £147,692 | 8% |
88 Properties |
| 2003 | £136,025 | 28% |
82 Properties |
| 2002 | £98,540 | 22% |
85 Properties |
| 2001 | £76,976 | 13% |
91 Properties |
| 2000 | £66,739 | 11% |
54 Properties |
| 1999 | £59,532 | 6% |
66 Properties |
| 1998 | £55,882 | -2% |
58 Properties |
| 1997 | £57,220 | 5% |
105 Properties |
| 1996 | £54,573 | -19% |
83 Properties |
| 1995 | £64,989 | - |
50 Properties |
Property Price per Property Type in Thringstone
Here you can find historic sold price data in order to help with your property search.
The average Property Paid Price for specific property types in the last three years are:
| Property Type | Average Sold Price | Sold Properties |
|---|---|---|
| Semi Detached House | £222,114.00 | 62 Semi Detached Houses |
| Detached House | £309,120.00 | 62 Detached Houses |
| Terraced House | £168,369.00 | 44 Terraced Houses |

