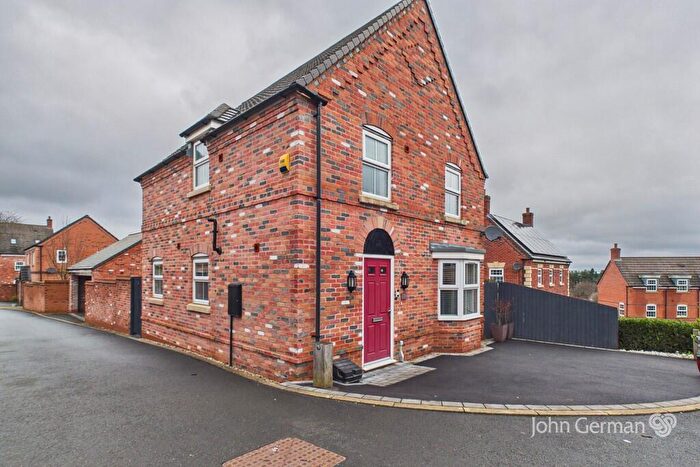
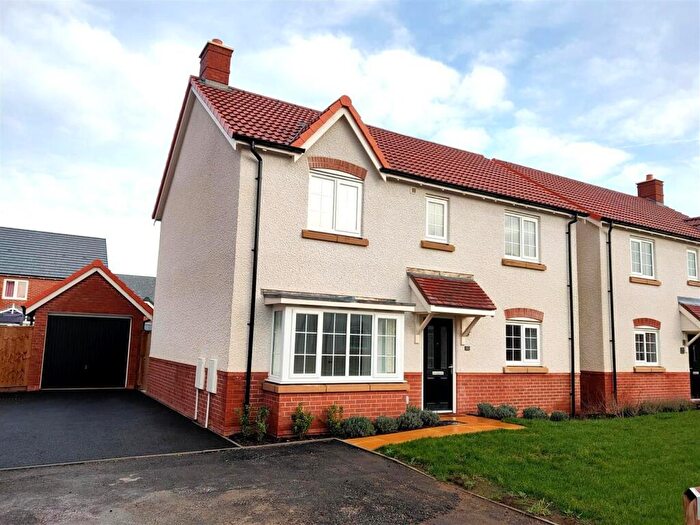
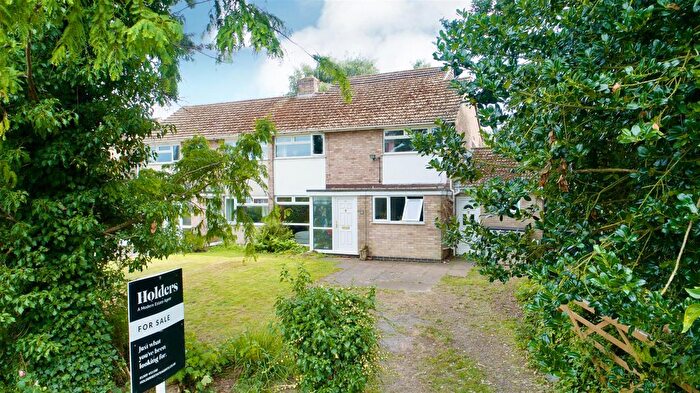
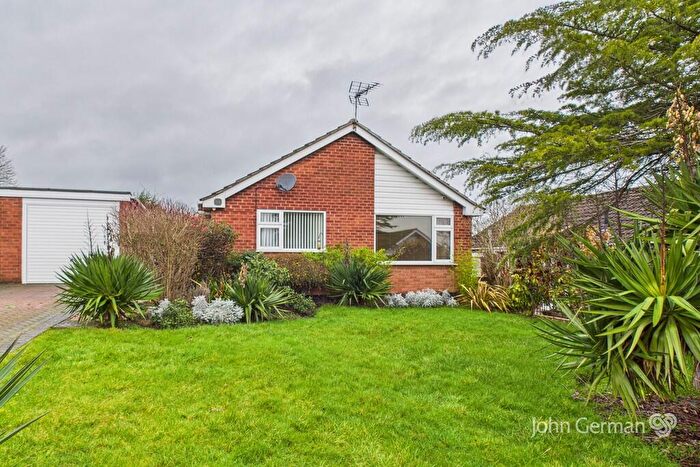
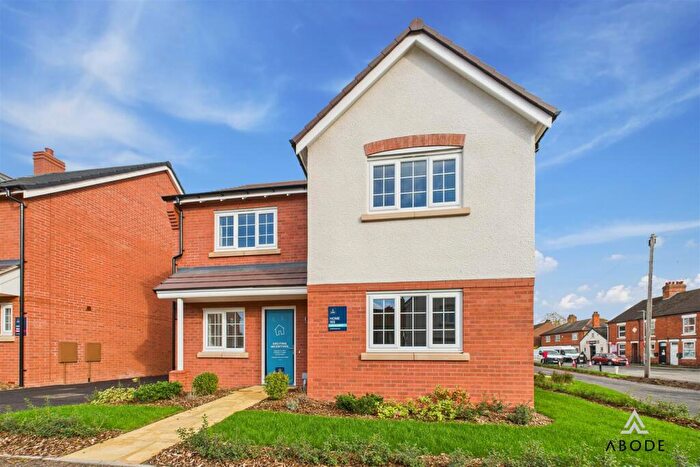
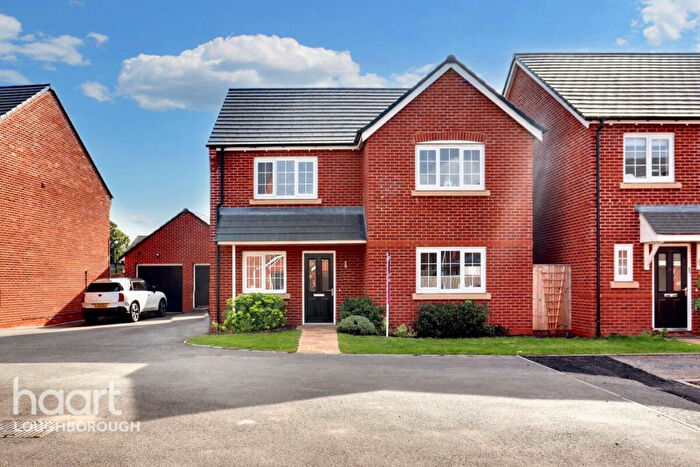
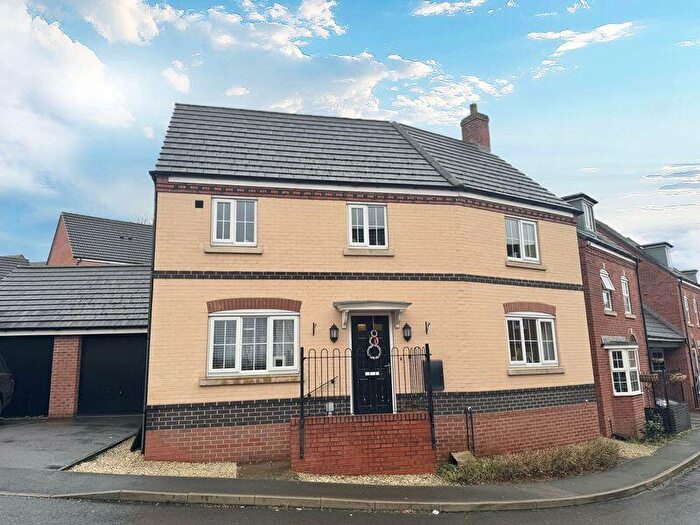
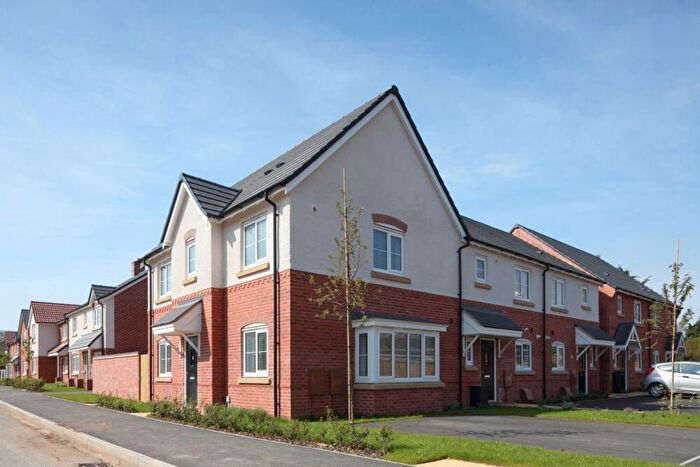
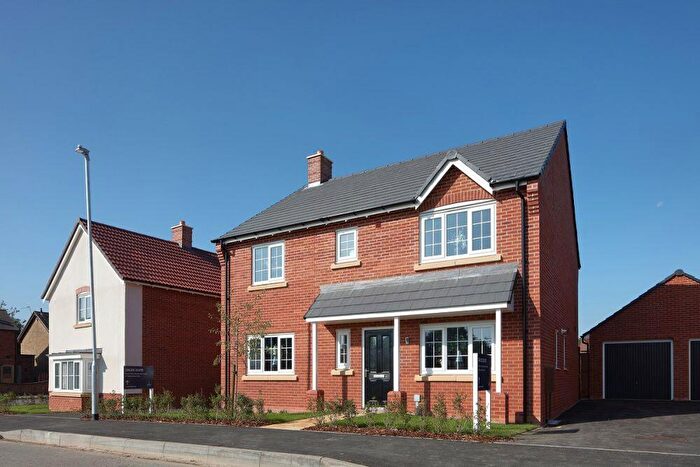
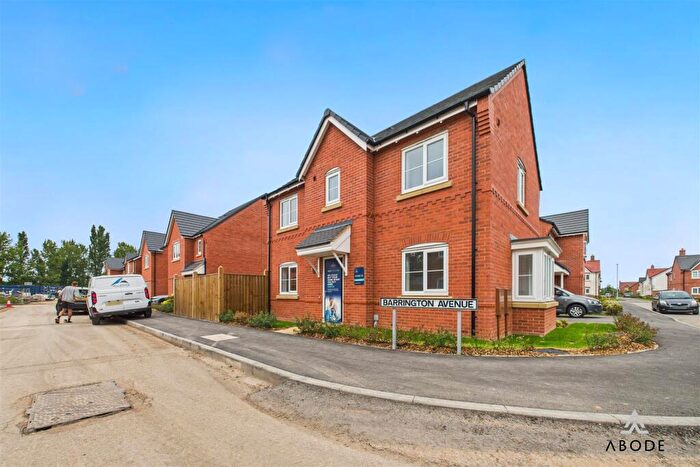
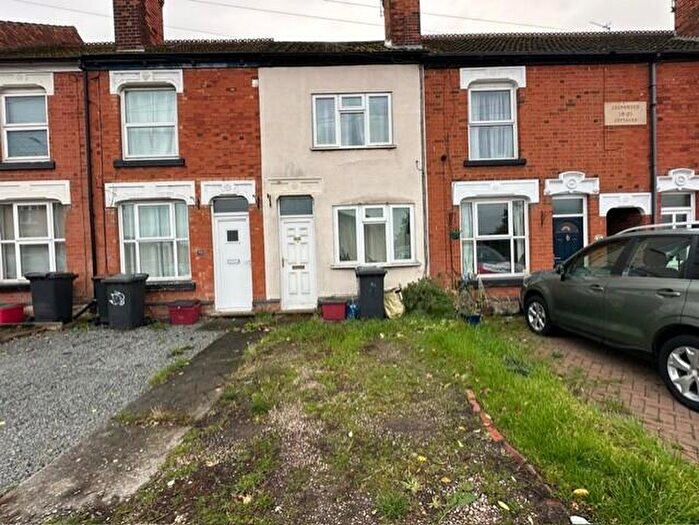
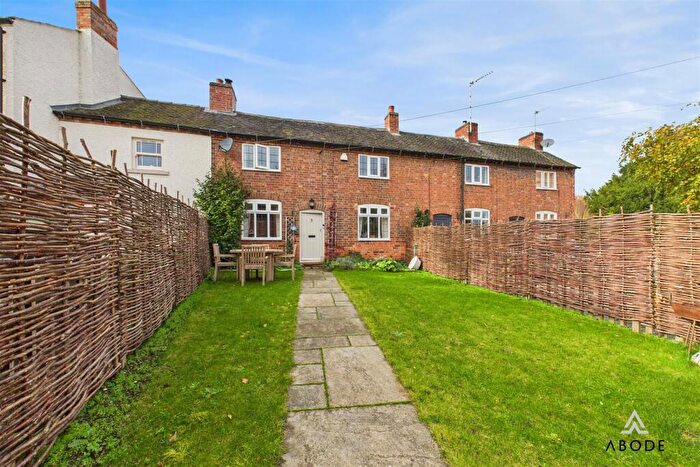
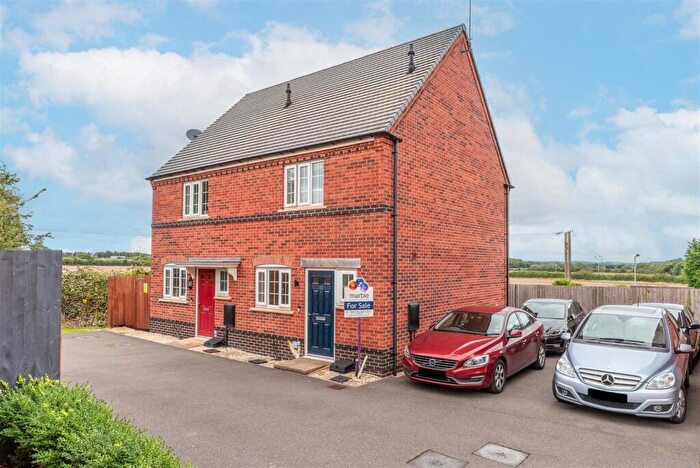
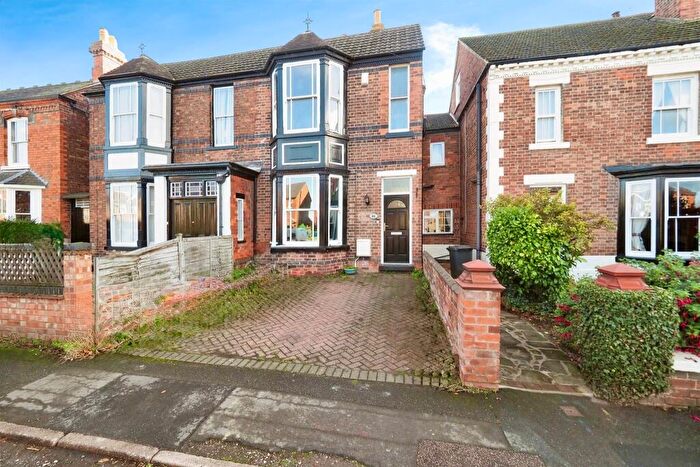
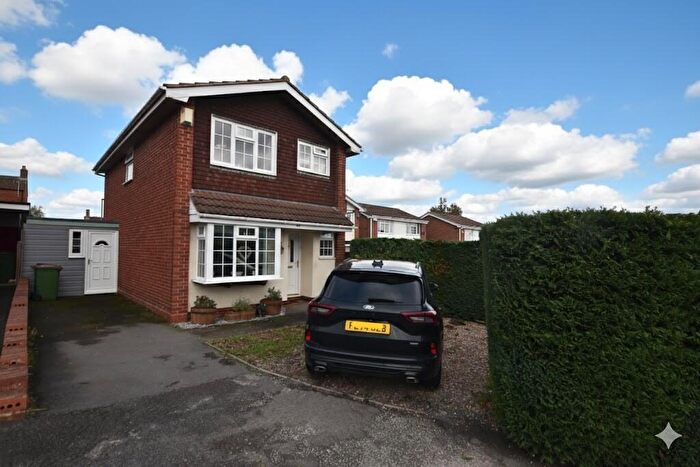
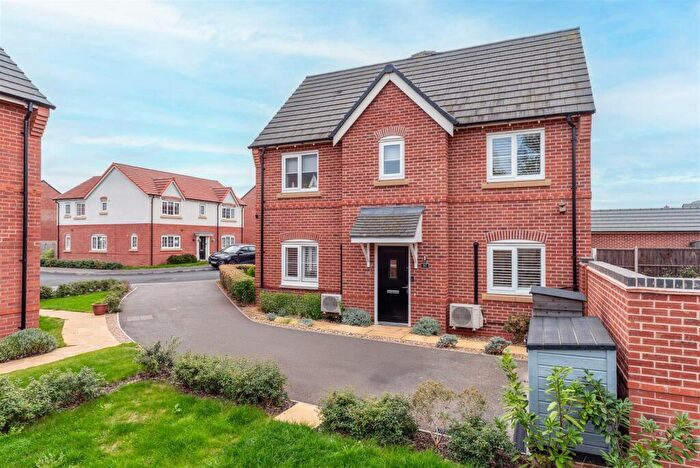
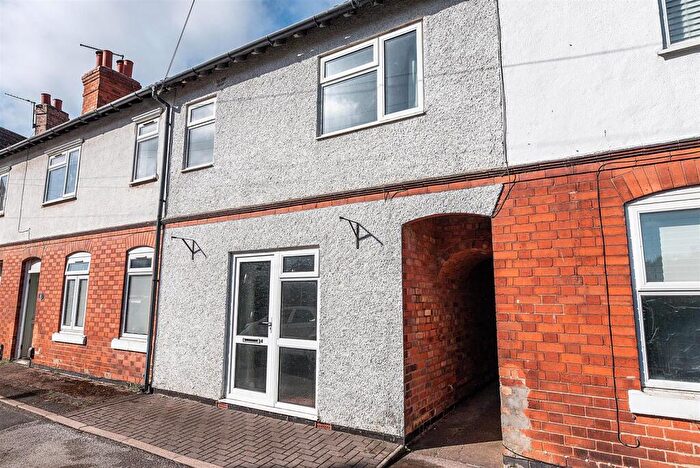
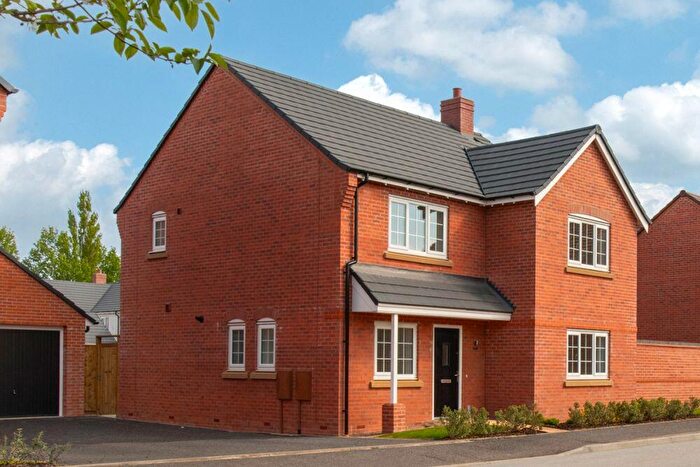
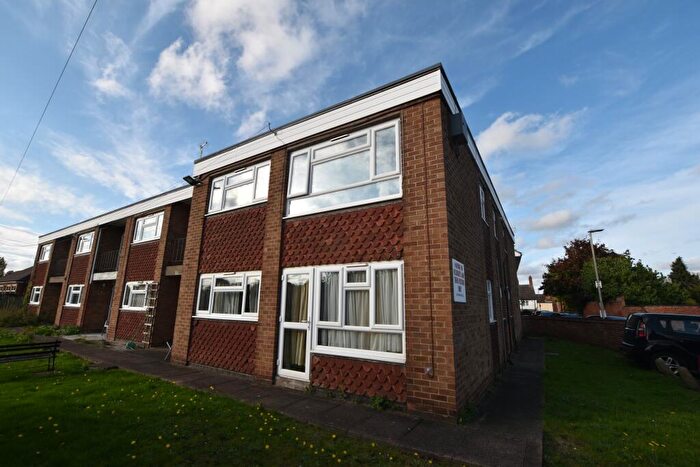
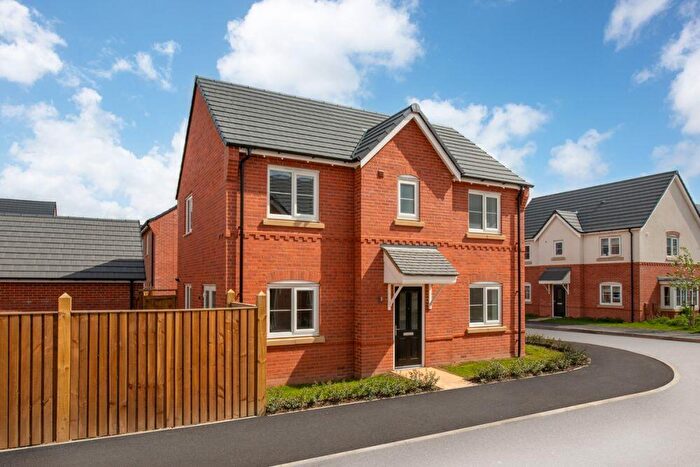
Houses for sale & to rent in Kegworth And Whatton, Derby
House Prices in Kegworth And Whatton
Properties in Kegworth And Whatton have an average house price of £268,507.00 and had 180 Property Transactions within the last 3 years¹.
Kegworth And Whatton is an area in Derby, Leicestershire with 1,447 households², where the most expensive property was sold for £820,000.00.
Properties for sale in Kegworth And Whatton
Roads and Postcodes in Kegworth And Whatton
Navigate through our locations to find the location of your next house in Kegworth And Whatton, Derby for sale or to rent.
| Streets | Postcodes |
|---|---|
| Ashby Road | DE74 2DH DE74 2DJ |
| Bedford Close | DE74 2EA |
| Borough Street | DE74 2FF |
| Borrowell | DE74 2FP |
| Bridge Fields | DE74 2FW |
| Broadhill Road | DE74 2DQ |
| Bulstrode Place | DE74 2DS |
| Burley Rise | DE74 2DZ |
| Church Gate | DE74 2ED |
| Derby Road | DE74 2EN |
| Dragwell | DE74 2EL |
| Foxhills | DE74 2FD |
| Frederick Avenue | DE74 2FN |
| Gerrard Crescent | DE74 2HQ |
| Green Lane | DE74 2GB |
| Heafield Drive | DE74 2GG |
| High Street | DE74 2DA |
| Hillside | DE74 2EB |
| Hollands Way | DE74 2GQ |
| Howard Drive | DE74 2AG |
| Hoyte Drive | DE74 2AQ |
| Kirby Drive | DE74 2HT |
| Kirk Avenue | DE74 2FY |
| Langley Drive | DE74 2DN |
| Leatherlands | DE74 2GJ |
| London Road | DE74 2EU DE74 2EY |
| Long Lane | DE74 2GA |
| Market Place | DE74 2EE |
| Mill Lane | DE74 2EJ DE74 2FX DE74 2GD |
| Moore Avenue | DE74 2FZ |
| Mulberry Gardens | DE74 2EW |
| Munnmoore Close | DE74 2DG |
| New Brickyard Lane | DE74 2EX |
| New Street | DE74 2FT |
| Nineacres | DE74 2TA |
| Nottingham Road | DE74 2EH DE74 2FH |
| Oldershaw Avenue | DE74 2DR |
| Packington Hill | DE74 2DF |
| Peppers Drive | DE74 2TE |
| Pleasant Place | DE74 2DD |
| Plummer Lane | DE74 2DB |
| Pritchard Drive | DE74 2AY DE74 2AZ |
| Queens Road | DE74 2FG |
| Roberts Close | DE74 2HR |
| Shepherd Walk | DE74 2HS |
| Sibson Drive | DE74 2HU |
| Sideley | DE74 2FJ |
| Springfield | DE74 2DP |
| St Andrews Rise | DE74 2DW |
| Staffords Acre | DE74 2HY |
| Station Road | DE74 2FQ DE74 2FR |
| Stonehills | DE74 2TD |
| Suthers Road | DE74 2DE |
| Sutton Road | DE74 2DX |
| The Croft | DE74 2EG |
| The Ropewalk | DE74 2TB |
| Thomas Road | DE74 2DY |
| West Bank Mews | DE74 2TX |
| Whatton Road | DE74 2DT DE74 2EZ |
| Whiteholmes Grove | DE74 2AW |
| Windmill Way | DE74 2FA |
| Wood Drive | DE74 2AA |
| Wyvelle Crescent | DE74 2ES |
Transport near Kegworth And Whatton
-
East Midlands Parkway Station
-
Long Eaton Station
-
Attenborough Station
-
Loughborough Station
-
Beeston Station
-
Spondon Station
-
Barrow-Upon-Soar Station
-
Peartree Station
-
Derby Station
-
Nottingham Station
- FAQ
- Price Paid By Year
- Property Type Price
Frequently asked questions about Kegworth And Whatton
What is the average price for a property for sale in Kegworth And Whatton?
The average price for a property for sale in Kegworth And Whatton is £268,507. This amount is 7% lower than the average price in Derby. There are 502 property listings for sale in Kegworth And Whatton.
What streets have the most expensive properties for sale in Kegworth And Whatton?
The streets with the most expensive properties for sale in Kegworth And Whatton are Whiteholmes Grove at an average of £473,750, Oldershaw Avenue at an average of £423,750 and London Road at an average of £422,916.
What streets have the most affordable properties for sale in Kegworth And Whatton?
The streets with the most affordable properties for sale in Kegworth And Whatton are Munnmoore Close at an average of £171,666, Borrowell at an average of £179,600 and Frederick Avenue at an average of £187,400.
Which train stations are available in or near Kegworth And Whatton?
Some of the train stations available in or near Kegworth And Whatton are East Midlands Parkway, Long Eaton and Attenborough.
Property Price Paid in Kegworth And Whatton by Year
The average sold property price by year was:
| Year | Average Sold Price | Price Change |
Sold Properties
|
|---|---|---|---|
| 2025 | £256,057 | -2% |
56 Properties |
| 2024 | £260,267 | -11% |
66 Properties |
| 2023 | £289,904 | -1% |
58 Properties |
| 2022 | £291,791 | 11% |
66 Properties |
| 2021 | £258,459 | 15% |
78 Properties |
| 2020 | £219,515 | 7% |
74 Properties |
| 2019 | £204,500 | -7% |
83 Properties |
| 2018 | £219,562 | 3% |
80 Properties |
| 2017 | £211,978 | 0,4% |
85 Properties |
| 2016 | £211,068 | 8% |
94 Properties |
| 2015 | £194,735 | -0,2% |
92 Properties |
| 2014 | £195,087 | -4% |
126 Properties |
| 2013 | £202,305 | 10% |
101 Properties |
| 2012 | £181,171 | 16% |
49 Properties |
| 2011 | £153,057 | -11% |
44 Properties |
| 2010 | £169,763 | 10% |
44 Properties |
| 2009 | £153,288 | -16% |
53 Properties |
| 2008 | £177,335 | -13% |
50 Properties |
| 2007 | £199,587 | 19% |
105 Properties |
| 2006 | £162,034 | 6% |
116 Properties |
| 2005 | £152,880 | -3% |
84 Properties |
| 2004 | £156,745 | 15% |
80 Properties |
| 2003 | £133,567 | 12% |
78 Properties |
| 2002 | £117,341 | 30% |
80 Properties |
| 2001 | £82,685 | 4% |
79 Properties |
| 2000 | £79,154 | 8% |
79 Properties |
| 1999 | £73,025 | 5% |
77 Properties |
| 1998 | £69,144 | 3% |
70 Properties |
| 1997 | £67,365 | 19% |
88 Properties |
| 1996 | £54,863 | -48% |
60 Properties |
| 1995 | £81,276 | - |
70 Properties |
Property Price per Property Type in Kegworth And Whatton
Here you can find historic sold price data in order to help with your property search.
The average Property Paid Price for specific property types in the last three years are:
| Property Type | Average Sold Price | Sold Properties |
|---|---|---|
| Semi Detached House | £234,664.00 | 56 Semi Detached Houses |
| Detached House | £351,707.00 | 71 Detached Houses |
| Terraced House | £203,108.00 | 46 Terraced Houses |
| Flat | £125,125.00 | 7 Flats |

