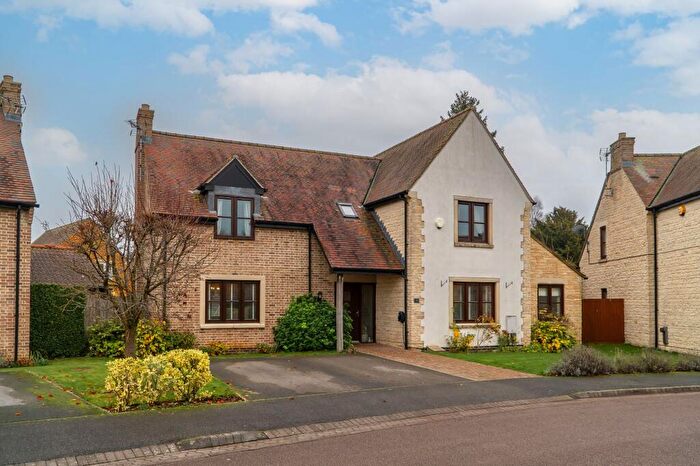
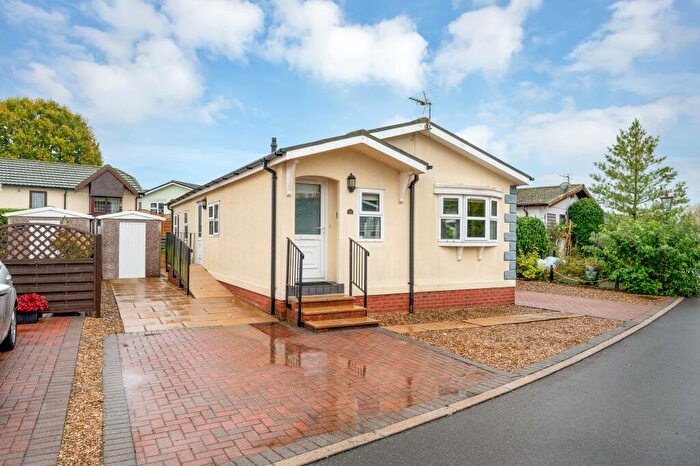
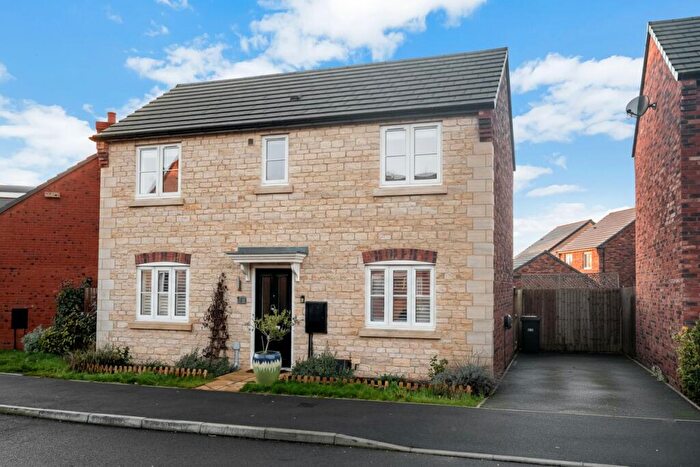
Houses for sale & to rent in Wymondham, Melton Mowbray
House Prices in Wymondham
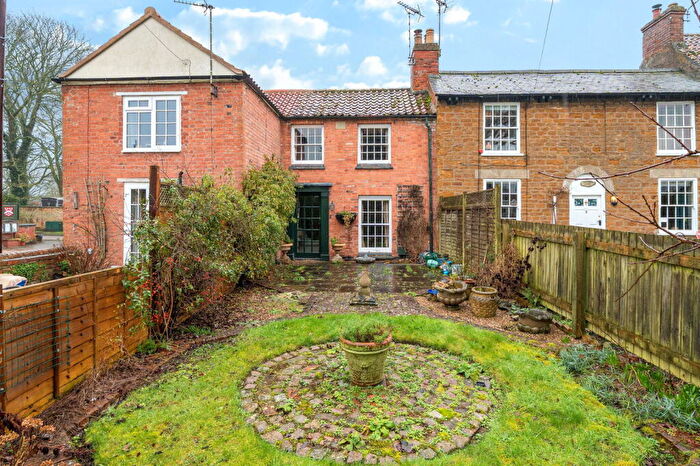
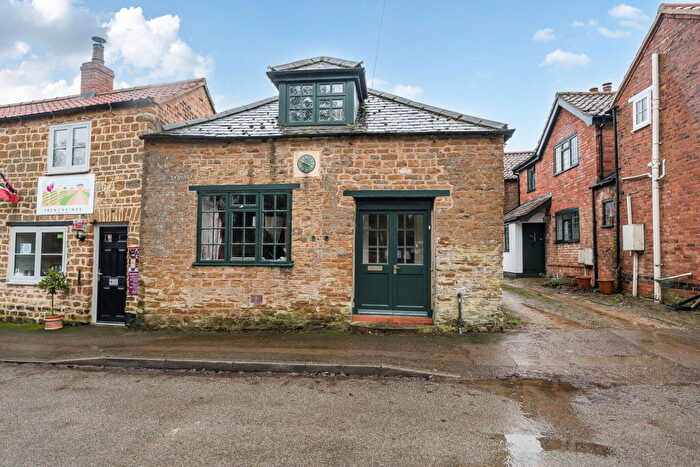
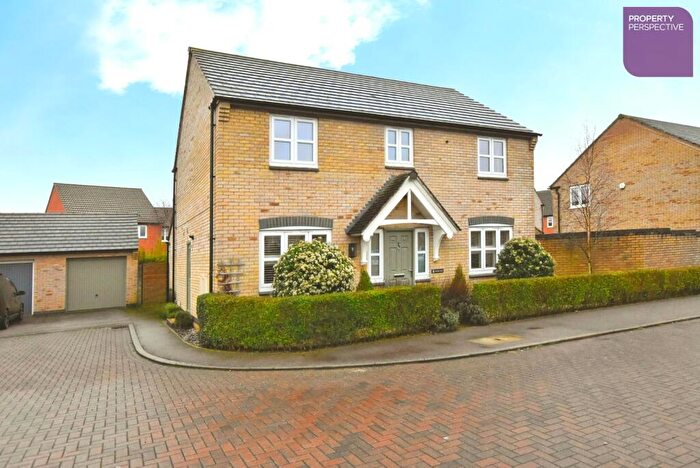
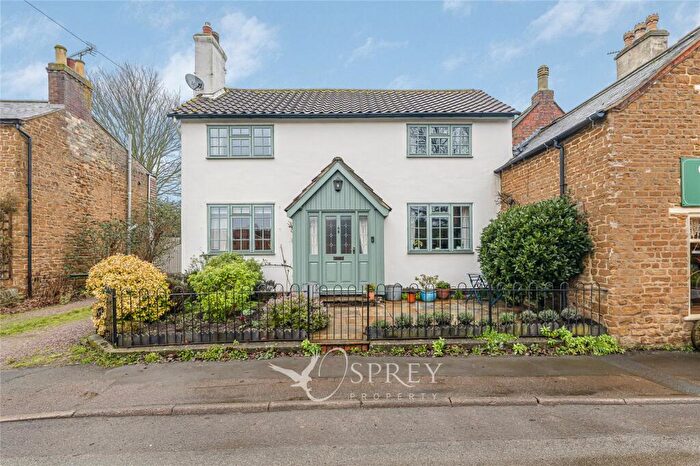
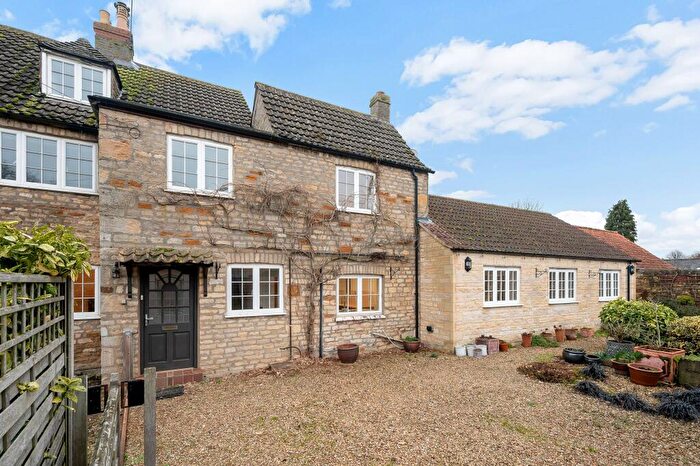
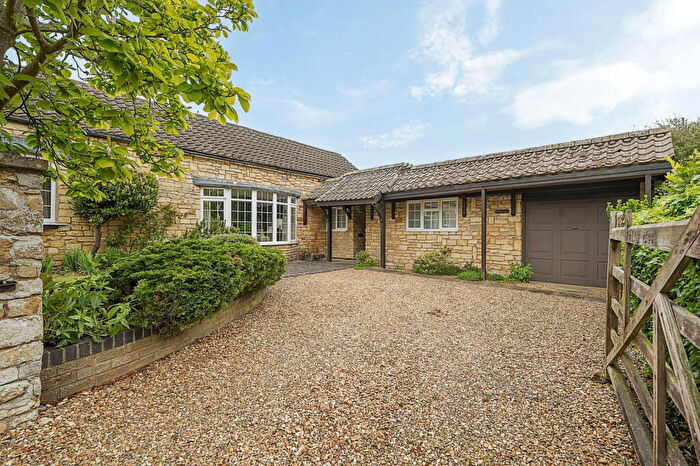
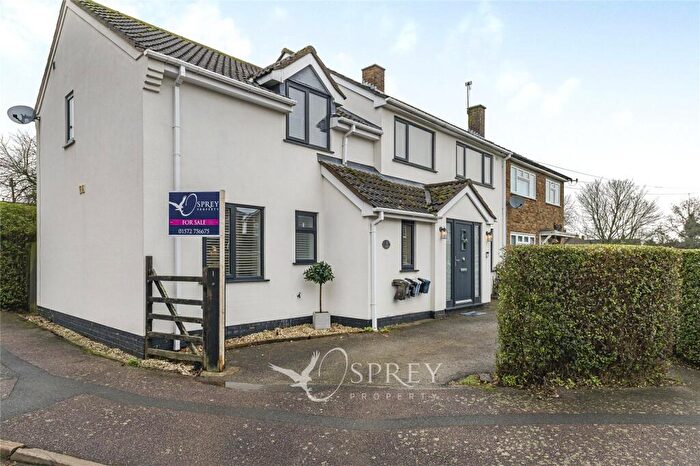
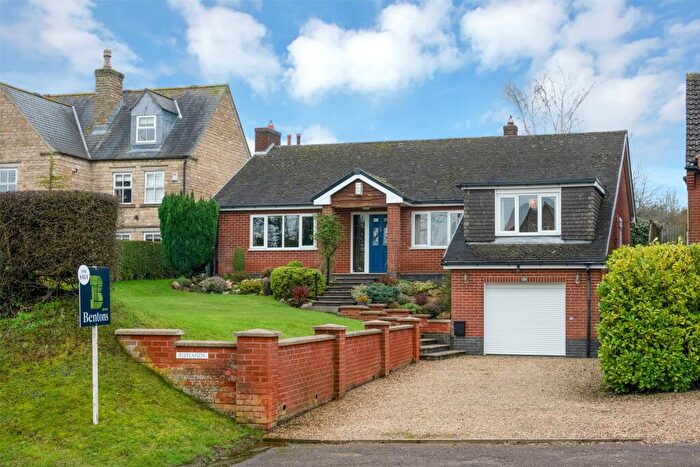
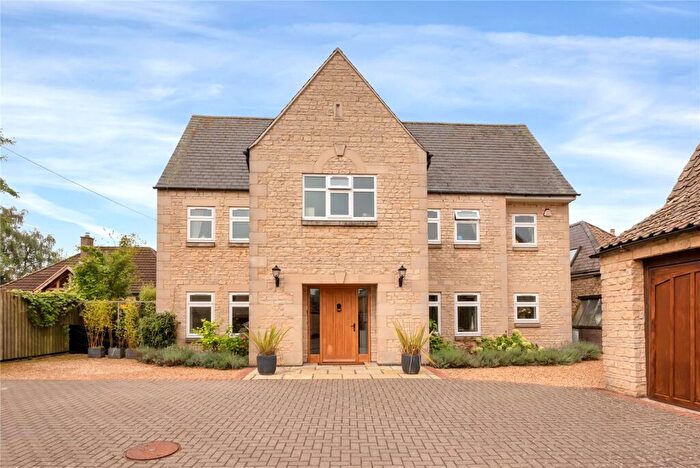
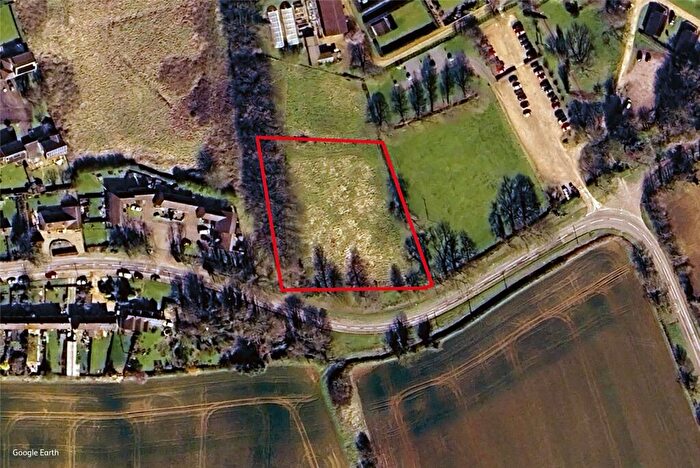
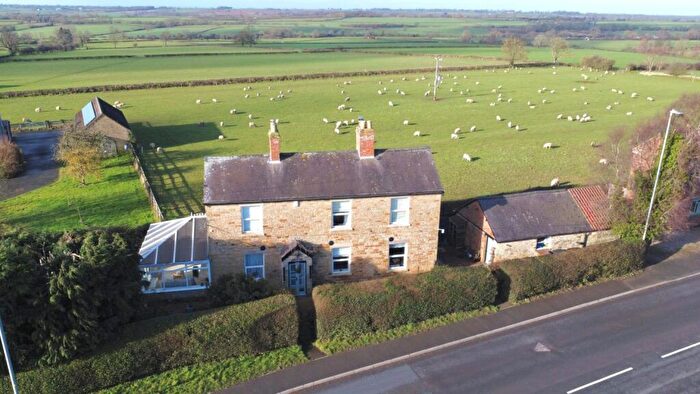
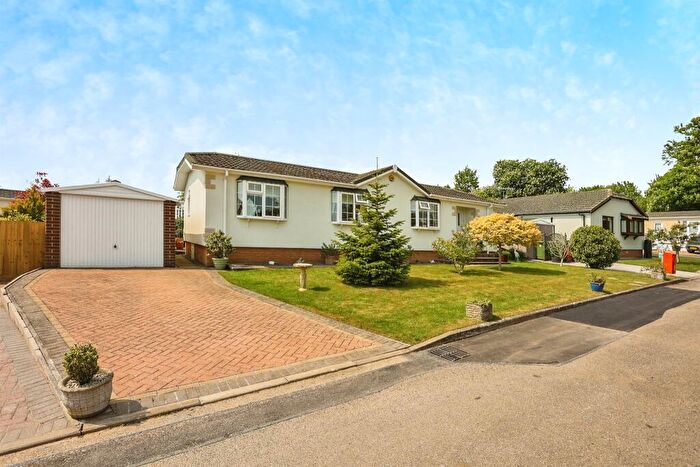
Properties in Wymondham have an average house price of £425,467.00 and had 31 Property Transactions within the last 3 years¹.
Wymondham is an area in Melton Mowbray, Leicestershire with 508 households², where the most expensive property was sold for £1,660,000.00.
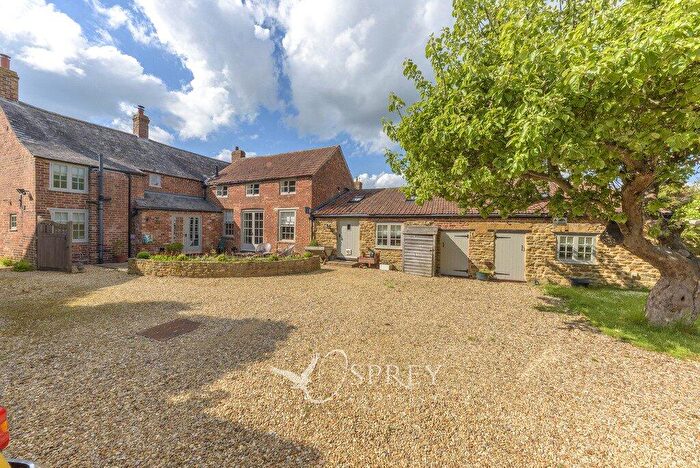
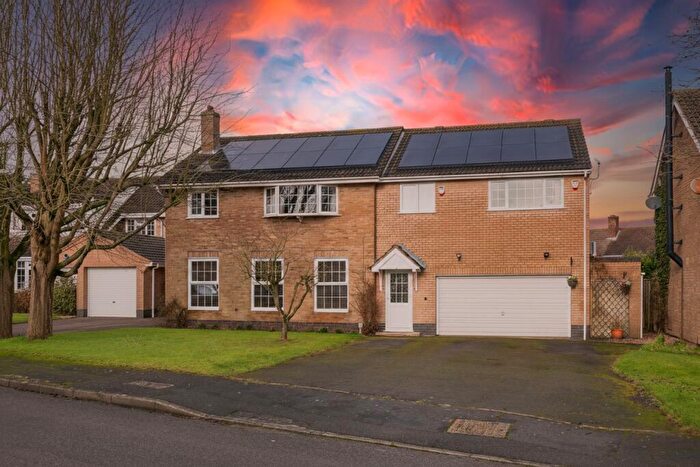
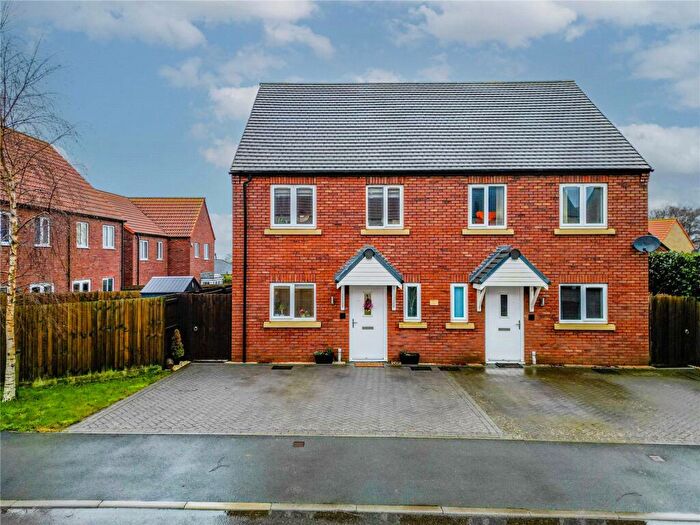
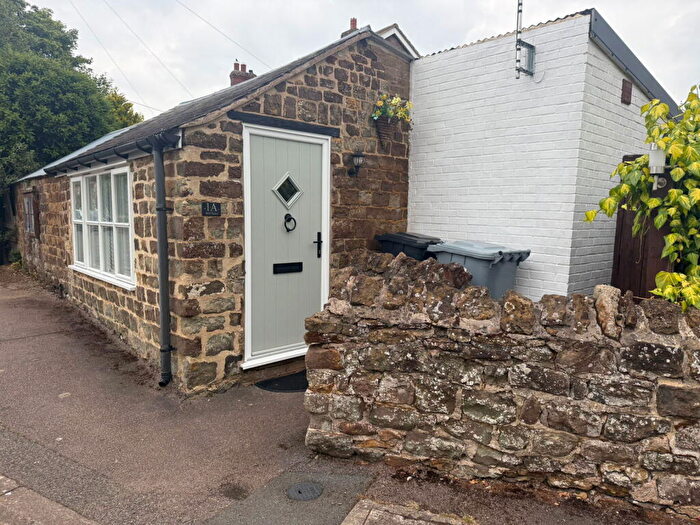
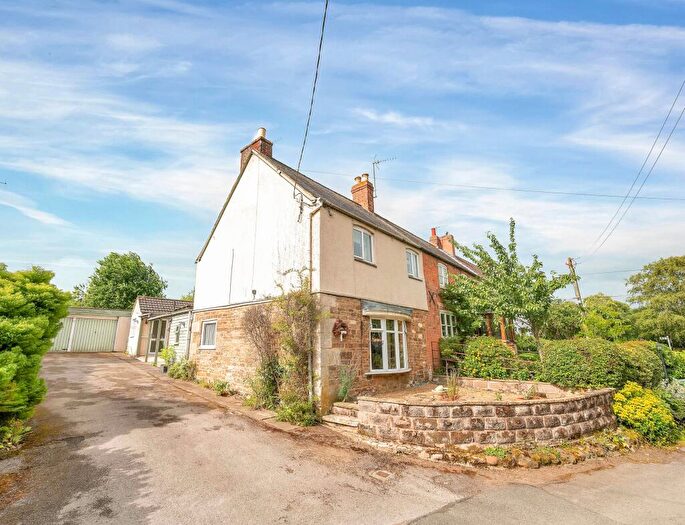
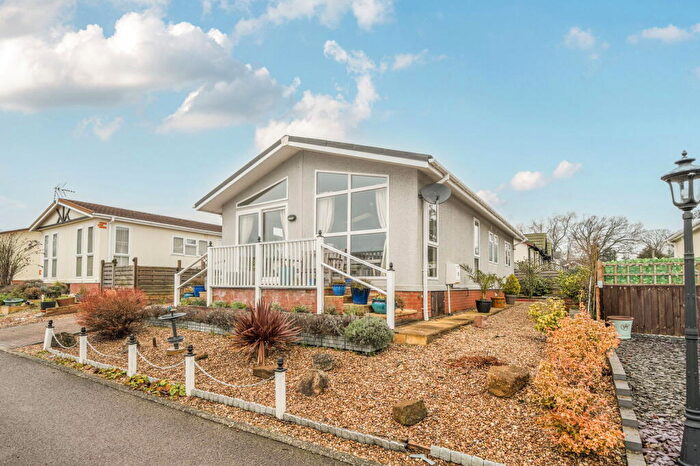
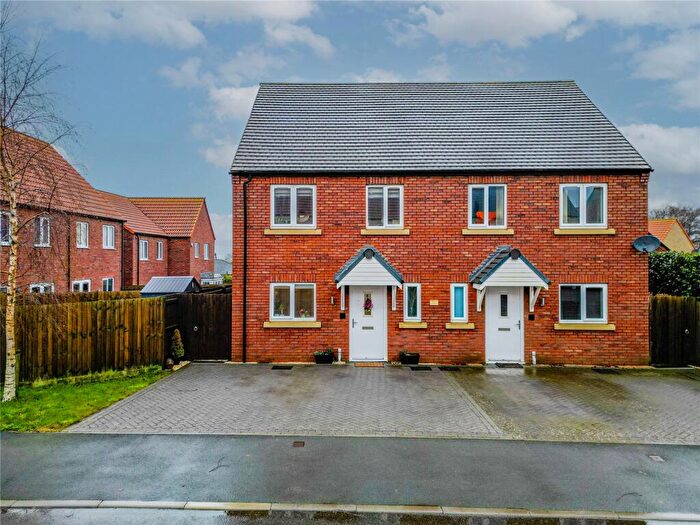
Properties for sale in Wymondham
Roads and Postcodes in Wymondham
Navigate through our locations to find the location of your next house in Wymondham, Melton Mowbray for sale or to rent.
| Streets | Postcodes |
|---|---|
| Bede Houses | LE14 2SF |
| Buckminster Road | LE14 2RP LE14 4PX LE14 2BN |
| Bursnells Lane | LE14 2BD |
| Butt Lane | LE14 2BU |
| Chapel Lane | LE14 2AA |
| Church Lane | LE14 2AB LE14 4PZ LE14 2RR |
| Cordhill Lane | LE14 2JT |
| Coston Road | LE14 2RS LE14 4QB LE14 2RT |
| Cuckoo Hill | LE14 2XN |
| Dairy Lane | LE14 2JX |
| Edmondthorpe Road | LE14 2AD LE14 2AE |
| Garthorpe Road | LE14 2RU LE14 2BS LE14 2RX |
| Glebe Road | LE14 2AF LE14 2SD |
| Gretton Gardens | LE14 2BB |
| Holygate Road | LE14 2SG |
| Main Road | LE14 4RX LE14 4RY |
| Main Street | LE14 2AG LE14 2AH LE14 2AL LE14 2JU LE14 4QS LE14 2RY LE14 2RZ |
| Meadow Rise | LE14 2AP |
| Melton Road | LE14 2AR |
| Nurses Lane | LE14 2AS |
| Old Manor Gardens | LE14 2AN |
| Rookery Lane | LE14 2AU |
| Saltby Road | LE14 4RA |
| Sawgate Lane | LE14 2XF |
| Saxby Road | LE14 2SB LE14 4SA |
| School Hill | LE14 4RB LE14 4RE |
| Sewstern Road | LE14 2BT |
| Spring Lane | LE14 2AY |
| St Peters Rise | LE14 2AJ |
| Stapleford Road | LE14 2XG LE14 2SY |
| Stonesby Road | LE14 4RH |
| Stow Hill | LE14 4QZ |
| Sycamore Lane | LE14 2AZ |
| Teigh Road | LE14 2JZ |
| The Brickyard | LE14 2BL |
| The Drift | LE14 2JY |
| The Drift Road | LE14 2BW LE14 2BP |
| The Nook | LE14 4QU |
| The Row | LE14 2SA |
| Waltham Road | LE14 2SQ |
| West End | LE14 2AX |
| West Well Gate | LE14 2BE |
| Woodfold Lane | LE14 4SQ |
| Woodwell Head Lane | LE14 2JA |
| Wrights Lane | LE14 2BA |
| Wyfordby Lane | LE14 2SH |
| Wymondham Road | LE14 2SJ LE14 2SL |
| LE14 2EF |
Transport near Wymondham
-
Melton Mowbray Station
-
Oakham Station
-
Grantham Station
-
Bottesford Station
-
Elton and Orston Station
-
Aslockton Station
-
Stamford Station
-
Syston Station
-
Sileby Station
- FAQ
- Price Paid By Year
- Property Type Price
Frequently asked questions about Wymondham
What is the average price for a property for sale in Wymondham?
The average price for a property for sale in Wymondham is £425,467. This amount is 46% higher than the average price in Melton Mowbray. There are 445 property listings for sale in Wymondham.
What streets have the most expensive properties for sale in Wymondham?
The streets with the most expensive properties for sale in Wymondham are Nurses Lane at an average of £1,055,000, Bede Houses at an average of £930,000 and Wrights Lane at an average of £820,000.
What streets have the most affordable properties for sale in Wymondham?
The streets with the most affordable properties for sale in Wymondham are Bursnells Lane at an average of £225,000, School Hill at an average of £242,500 and Main Street at an average of £280,250.
Which train stations are available in or near Wymondham?
Some of the train stations available in or near Wymondham are Melton Mowbray, Oakham and Grantham.
Property Price Paid in Wymondham by Year
The average sold property price by year was:
| Year | Average Sold Price | Price Change |
Sold Properties
|
|---|---|---|---|
| 2025 | £482,977 | 8% |
11 Properties |
| 2024 | £444,375 | 28% |
12 Properties |
| 2023 | £318,031 | -92% |
8 Properties |
| 2022 | £610,526 | 40% |
19 Properties |
| 2021 | £366,764 | -21% |
17 Properties |
| 2020 | £445,400 | 16% |
10 Properties |
| 2019 | £375,625 | 12% |
12 Properties |
| 2018 | £329,352 | -7% |
17 Properties |
| 2017 | £353,728 | 10% |
14 Properties |
| 2016 | £319,575 | -2% |
10 Properties |
| 2015 | £327,150 | -2% |
11 Properties |
| 2014 | £334,546 | 28% |
18 Properties |
| 2013 | £239,230 | -56% |
13 Properties |
| 2012 | £373,222 | 25% |
9 Properties |
| 2011 | £280,655 | -4% |
10 Properties |
| 2010 | £292,299 | -2% |
15 Properties |
| 2009 | £299,000 | 25% |
14 Properties |
| 2008 | £223,200 | -39% |
10 Properties |
| 2007 | £311,043 | 10% |
23 Properties |
| 2006 | £280,857 | 16% |
14 Properties |
| 2005 | £236,599 | -41% |
15 Properties |
| 2004 | £333,313 | 43% |
11 Properties |
| 2003 | £188,920 | 14% |
19 Properties |
| 2002 | £162,014 | 13% |
19 Properties |
| 2001 | £140,150 | -2% |
10 Properties |
| 2000 | £143,030 | 3% |
15 Properties |
| 1999 | £138,363 | 11% |
19 Properties |
| 1998 | £123,679 | 18% |
14 Properties |
| 1997 | £101,717 | -6% |
23 Properties |
| 1996 | £107,434 | 47% |
16 Properties |
| 1995 | £57,017 | - |
14 Properties |
Property Price per Property Type in Wymondham
Here you can find historic sold price data in order to help with your property search.
The average Property Paid Price for specific property types in the last three years are:
| Property Type | Average Sold Price | Sold Properties |
|---|---|---|
| Semi Detached House | £289,214.00 | 7 Semi Detached Houses |
| Detached House | £629,142.00 | 14 Detached Houses |
| Terraced House | £235,700.00 | 10 Terraced Houses |

