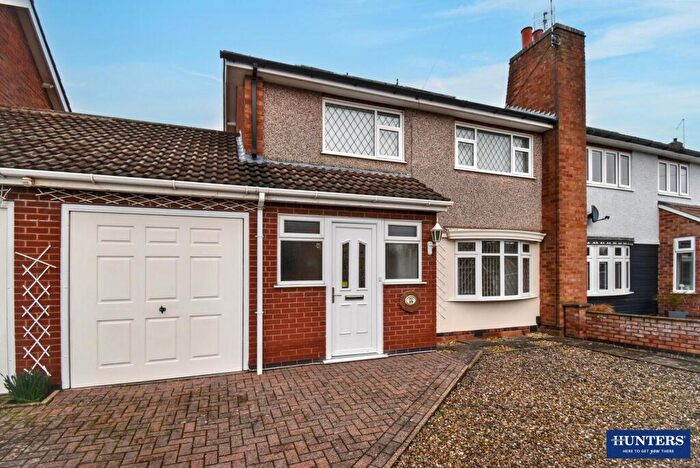
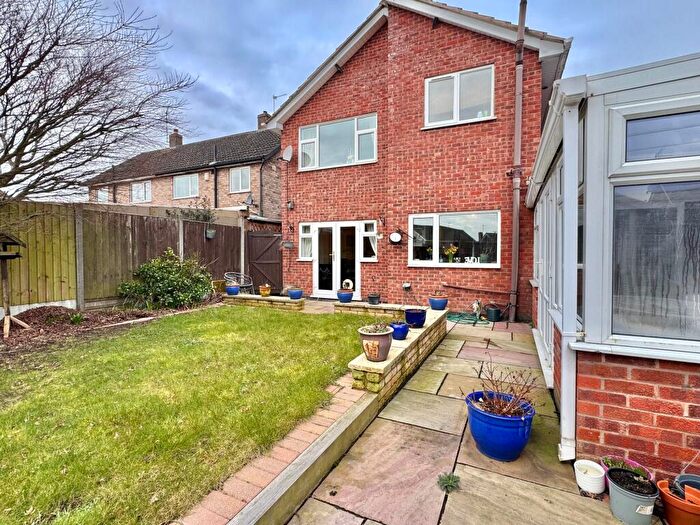
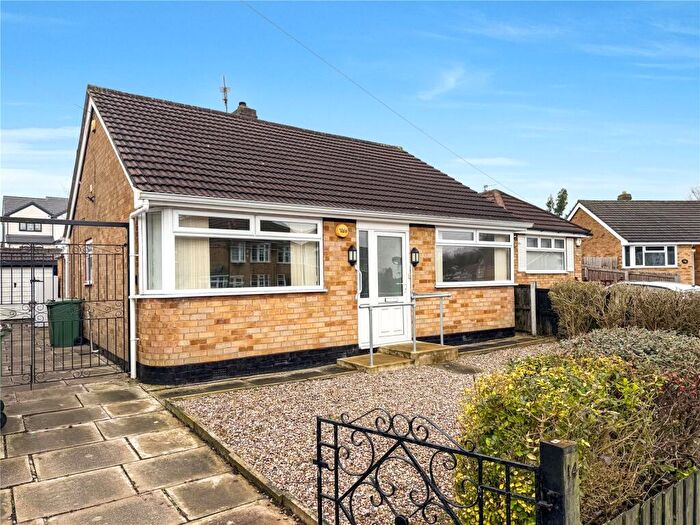
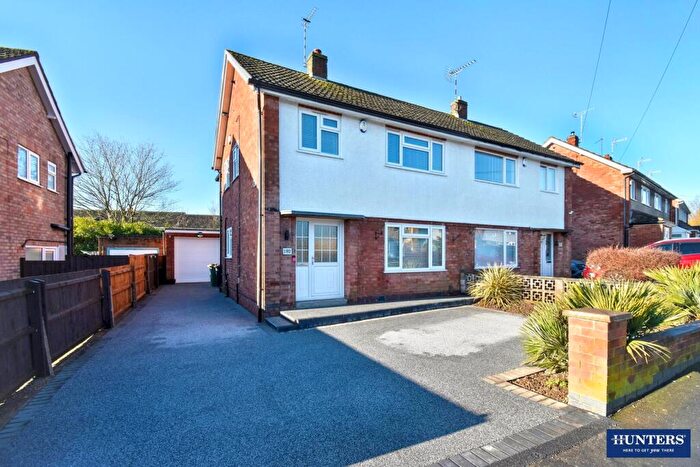
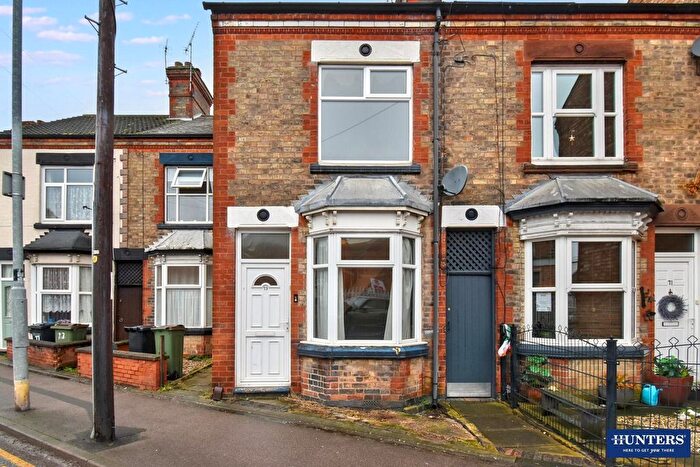
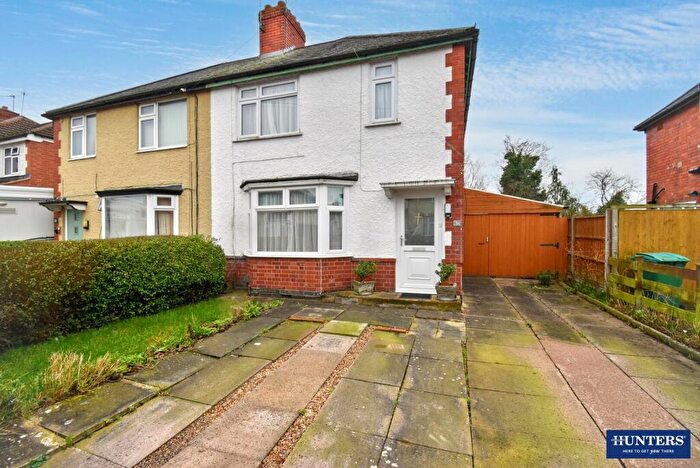
Houses for sale & to rent in South Wigston, Wigston
House Prices in South Wigston
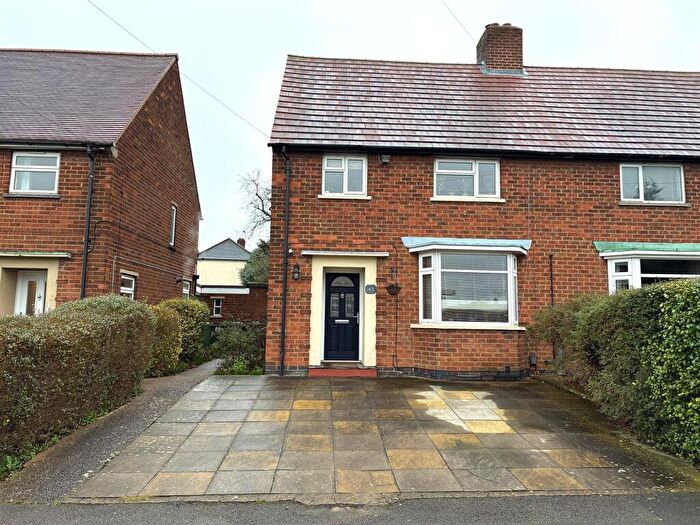
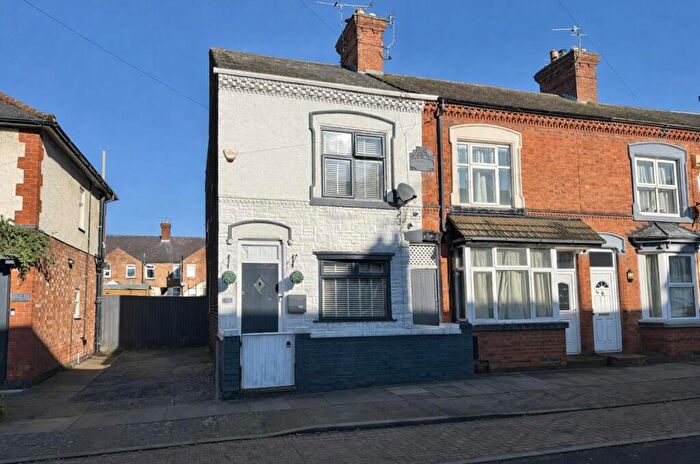
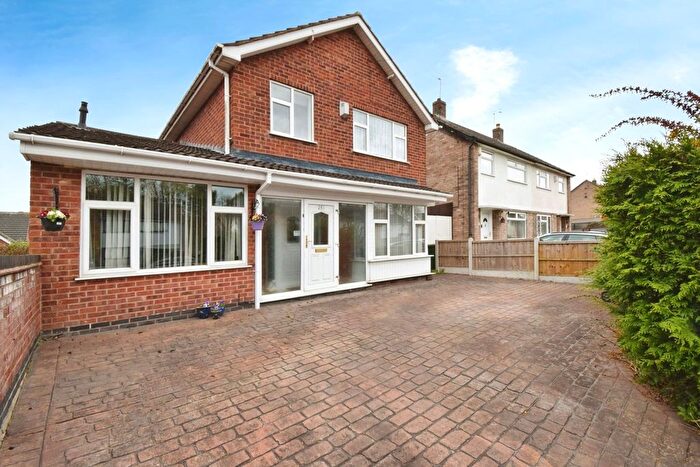
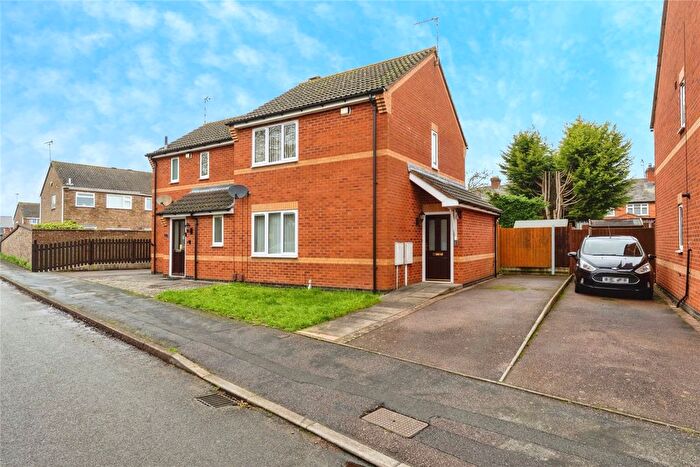
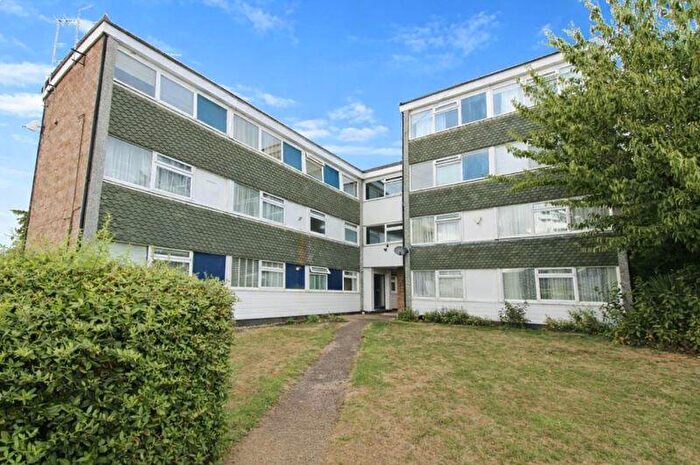
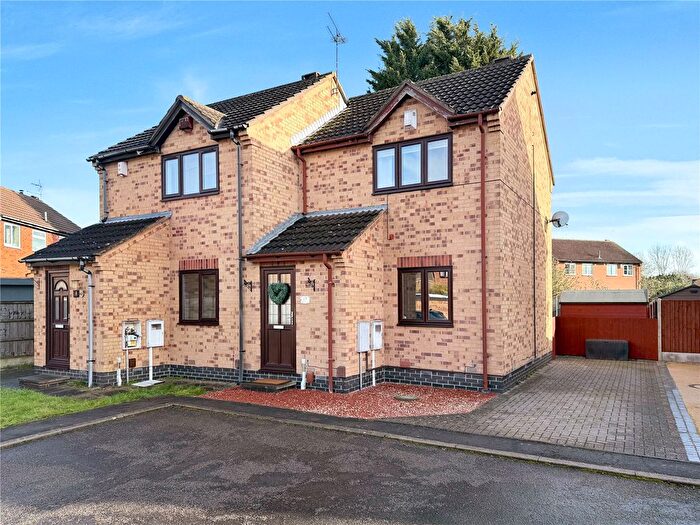
Properties in South Wigston have an average house price of £215,280.00 and had 312 Property Transactions within the last 3 years¹.
South Wigston is an area in Wigston, Leicestershire with 3,255 households², where the most expensive property was sold for £545,000.00.
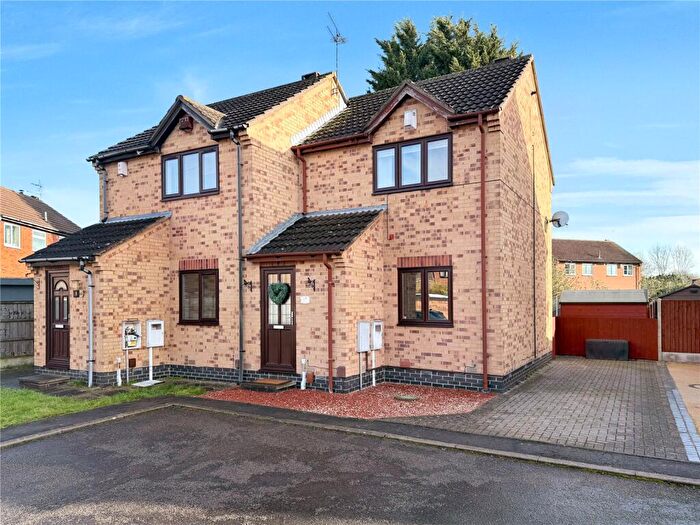
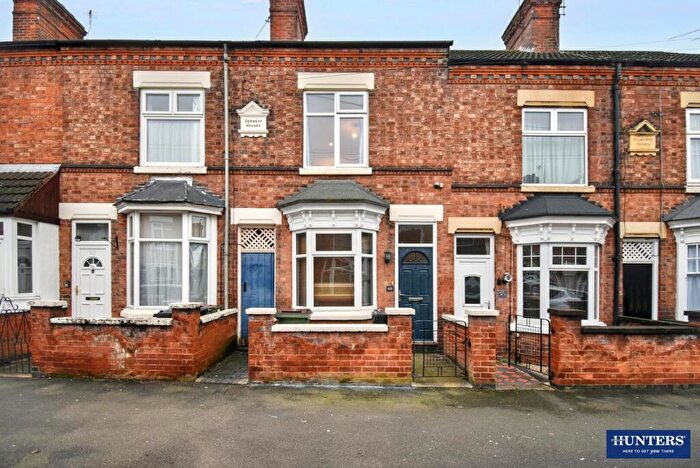
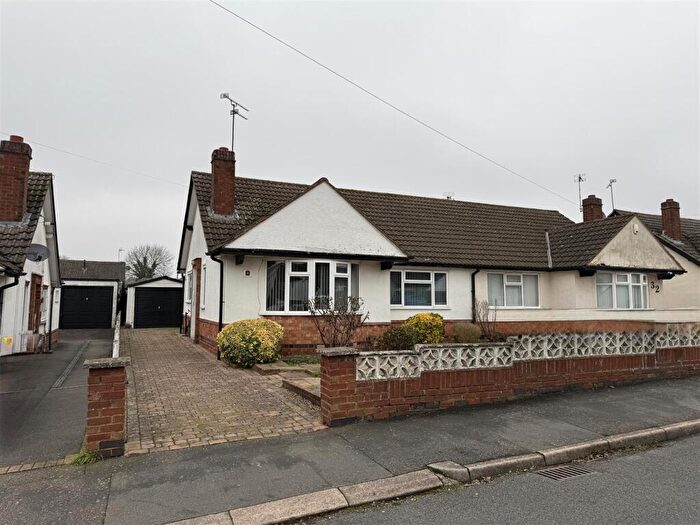
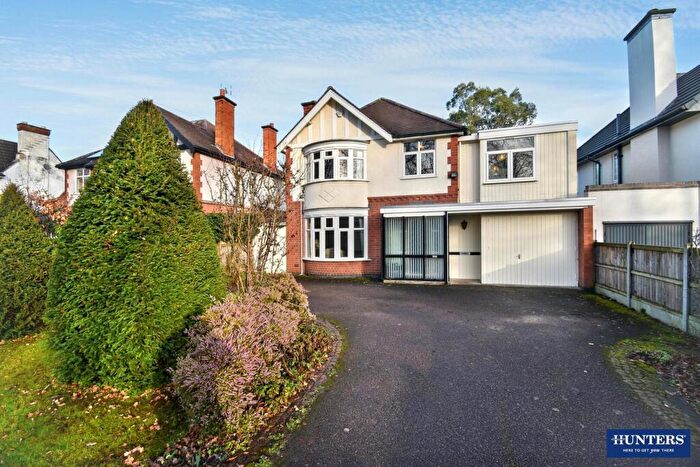
Properties for sale in South Wigston
Roads and Postcodes in South Wigston
Navigate through our locations to find the location of your next house in South Wigston, Wigston for sale or to rent.
| Streets | Postcodes |
|---|---|
| Aisne Road | LE18 4UA |
| Albion Street | LE18 4SA |
| Anglesey Road | LE18 4XA LE18 4XB |
| Arnold Avenue | LE18 4LA |
| Baldwin Avenue | LE18 4LD |
| Barge Close | LE18 4NP |
| Bassett Street | LE18 4PD LE18 4PE |
| Belper Close | LE18 4LE |
| Bennett Way | LE18 4SF |
| Best Close | LE18 4PZ |
| Blaby Road | LE18 4LB LE18 4PA LE18 4PB LE18 4SB LE18 4SD LE18 4PH LE18 4SE |
| Blenheim Close | LE18 4QJ |
| Brecon Close | LE18 4XZ |
| Bush Lock Close | LE18 4NT |
| Canal Street | LE18 4PL LE18 4PN LE18 4PP LE18 4PQ |
| Cardigan Drive | LE18 4XE |
| Chatsworth Avenue | LE18 4LF |
| Cheshire Drive | LE18 4WA |
| Clifford Street | LE18 4SH LE18 4SJ |
| Clifton Drive | LE18 4LG |
| Cornwall Road | LE18 4XF LE18 4XG LE18 4YT LE18 4XH |
| Countesthorpe Road | LE18 4PF LE18 4PG LE18 4PJ LE18 4PR LE18 4PT |
| Crete Avenue | LE18 4UB |
| Cromford Avenue | LE18 4LH |
| Cumberland Road | LE18 4XL |
| Curzon Avenue | LE18 4LJ |
| Cutting Close | LE18 4NX |
| Darley Avenue | LE18 4LL |
| Denacre Avenue | LE18 4LN |
| Devonshire Avenue | LE18 4LP |
| Dorset Avenue | LE18 4WB LE18 4WD LE18 4WE LE18 4WF |
| Double Rail Close | LE18 4NN |
| Dunton Street | LE18 4PU |
| Durham Drive | LE18 4XN |
| Ellison Close | LE18 4QH |
| Ervins Lock Road | LE18 4NQ |
| Essex Road | LE18 4WG |
| Fairfield Street | LE18 4SL LE18 4SN |
| Florence Avenue | LE18 4LQ |
| Foxton Lock Close | LE18 4NH |
| Garden Street | LE18 4PW |
| Glamorgan Avenue | LE18 4XP |
| Glengate | LE18 4SP LE18 4SQ LE18 4SZ |
| Gloucester Crescent | LE18 4YD LE18 4YE LE18 4YF LE18 4YG LE18 4YH LE18 4YJ LE18 4XJ LE18 4YL LE18 4YQ |
| Harrison Close | LE18 4ZL |
| Hazelwood Road | LE18 4LR LE18 4LS |
| Healey Street | LE18 4PX LE18 4PY |
| Hindoostan Avenue | LE18 4UD |
| Irlam Street | LE18 4QA |
| Isabella Court | LE18 4PS |
| Ivanhoe Road | LE18 4UE |
| Jasmine Court | LE18 4TR |
| Jordan Avenue | LE18 4LT |
| Keel Close | LE18 4NY |
| Kenilworth Road | LE18 4UF LE18 4XS LE18 4XT |
| Kent Crescent | LE18 4XQ LE18 4XR |
| Kirkdale Road | LE18 4SR LE18 4SS LE18 4ST |
| Ladysmith Road | LE18 4UZ |
| Lansdowne Grove | LE18 4AB LE18 4LU LE18 4LW LE18 4LX LE18 4LY LE18 4LZ |
| Leopold Street | LE18 4SW LE18 4SX |
| Lincoln Drive | LE18 4XU |
| Lock Gate Close | LE18 4NJ |
| Lock Keeper Close | LE18 4NU |
| Magna Road | LE18 4AJ LE18 4ZD LE18 4ZH |
| Marquis Court | LE18 4SU |
| Marstown Avenue | LE18 4UH |
| Matlock Avenue | LE18 4NA |
| Mill Close | LE18 4NB |
| Moores Close | LE18 4WT |
| Namur Road | LE18 4UJ |
| Narrow Boat Close | LE18 4NS |
| Norfolk Road | LE18 4WH LE18 4WJ |
| Northumberland Road | LE18 4WL |
| Orange Street | LE18 4QB |
| Oxford Drive | LE18 4XW |
| Park Road | LE18 4AD LE18 4QD |
| Pembroke Avenue | LE18 4XX |
| Pochins Bridge Road | LE18 4NR |
| Radnor Road | LE18 4XY |
| Railway Street | LE18 4QE |
| Saffron Road | LE18 4TD LE18 4UL LE18 4UN LE18 4UP LE18 4UQ LE18 4AF LE18 4AG LE18 4AH LE18 4TF LE18 4TG LE18 4US |
| St Thomas Road | LE18 4TA |
| Stafford Drive | LE18 4YA |
| Station Street | LE18 4TH LE18 4TJ |
| Suffolk Close | LE18 4WN |
| Sussex Road | LE18 4WP LE18 4WQ |
| Tansley Avenue | LE18 4ND |
| Taylors Bridge Road | LE18 4NL |
| Tigers Close | LE18 4AE |
| Tigers Road | LE18 4UY LE18 4WS |
| Timber Street | LE18 4QF LE18 4QG |
| Towpath Link | LE18 4NE |
| Waverley Road | LE18 4UW |
| Weir Close | LE18 4NG |
| Westmorland Avenue | LE18 4YB |
| Wilson Road | LE18 4TP LE18 4TQ |
| Windlass Drive | LE18 4NW LE18 4NZ |
| Worcester Drive | LE18 4YS |
| Wright Place | LE18 4SY |
Transport near South Wigston
- FAQ
- Price Paid By Year
- Property Type Price
Frequently asked questions about South Wigston
What is the average price for a property for sale in South Wigston?
The average price for a property for sale in South Wigston is £215,280. This amount is 16% lower than the average price in Wigston. There are 973 property listings for sale in South Wigston.
What streets have the most expensive properties for sale in South Wigston?
The streets with the most expensive properties for sale in South Wigston are Hindoostan Avenue at an average of £513,750, Saffron Road at an average of £355,590 and Windlass Drive at an average of £322,916.
What streets have the most affordable properties for sale in South Wigston?
The streets with the most affordable properties for sale in South Wigston are Jasmine Court at an average of £89,750, Irlam Street at an average of £115,000 and Station Street at an average of £141,000.
Which train stations are available in or near South Wigston?
Some of the train stations available in or near South Wigston are South Wigston, Narborough and Leicester.
Property Price Paid in South Wigston by Year
The average sold property price by year was:
| Year | Average Sold Price | Price Change |
Sold Properties
|
|---|---|---|---|
| 2025 | £223,438 | 3% |
90 Properties |
| 2024 | £217,808 | 6% |
119 Properties |
| 2023 | £205,231 | -4% |
103 Properties |
| 2022 | £214,307 | 8% |
162 Properties |
| 2021 | £196,801 | 11% |
195 Properties |
| 2020 | £174,316 | 5% |
120 Properties |
| 2019 | £166,237 | 2% |
147 Properties |
| 2018 | £163,367 | 9% |
141 Properties |
| 2017 | £148,356 | -9% |
132 Properties |
| 2016 | £161,052 | 8% |
192 Properties |
| 2015 | £148,500 | 13% |
202 Properties |
| 2014 | £128,838 | 6% |
180 Properties |
| 2013 | £120,796 | 3% |
122 Properties |
| 2012 | £116,703 | 5% |
88 Properties |
| 2011 | £111,413 | -2% |
75 Properties |
| 2010 | £113,324 | 1% |
93 Properties |
| 2009 | £111,649 | -13% |
83 Properties |
| 2008 | £125,698 | -3% |
99 Properties |
| 2007 | £129,722 | 7% |
186 Properties |
| 2006 | £120,424 | 3% |
209 Properties |
| 2005 | £117,294 | 4% |
164 Properties |
| 2004 | £112,920 | 13% |
225 Properties |
| 2003 | £98,595 | 27% |
272 Properties |
| 2002 | £71,885 | 24% |
259 Properties |
| 2001 | £54,547 | 7% |
253 Properties |
| 2000 | £50,763 | 12% |
209 Properties |
| 1999 | £44,451 | 5% |
169 Properties |
| 1998 | £42,302 | -1% |
147 Properties |
| 1997 | £42,884 | 7% |
172 Properties |
| 1996 | £39,967 | 1% |
149 Properties |
| 1995 | £39,390 | - |
122 Properties |
Property Price per Property Type in South Wigston
Here you can find historic sold price data in order to help with your property search.
The average Property Paid Price for specific property types in the last three years are:
| Property Type | Average Sold Price | Sold Properties |
|---|---|---|
| Flat | £110,766.00 | 15 Flats |
| Semi Detached House | £236,118.00 | 152 Semi Detached Houses |
| Detached House | £328,689.00 | 22 Detached Houses |
| Terraced House | £181,991.00 | 123 Terraced Houses |

