
Houses for sale & to rent in Trinity, London
House Prices in Trinity
Properties in this part of Trinity within London have an average house price of £696k and had 461 Property Transactions within the last 3 years¹. This area has 4,267 households² , where the most expensive property was sold for £2.87M.
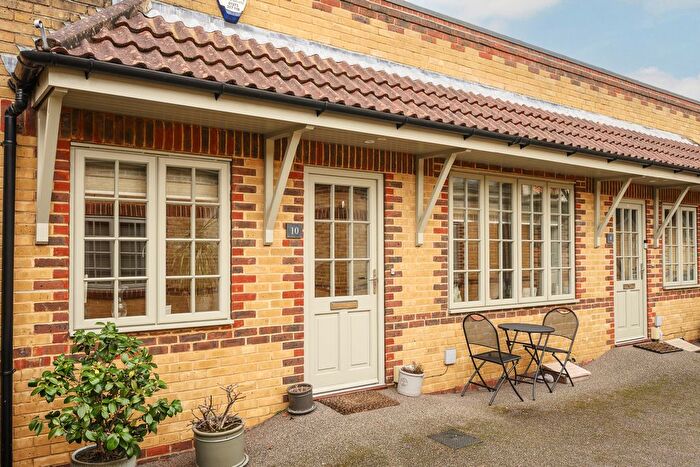
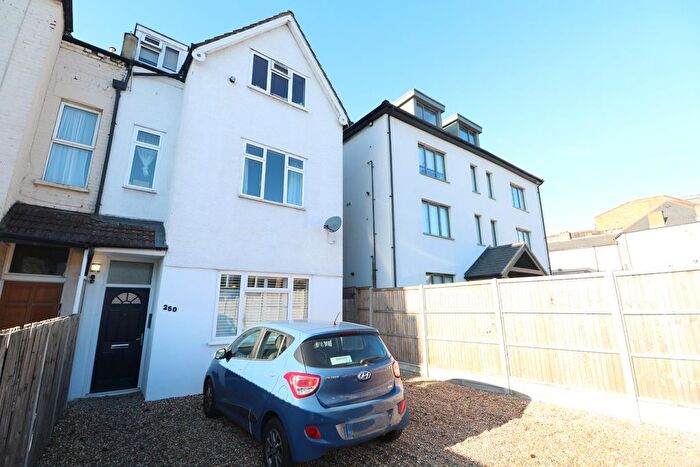
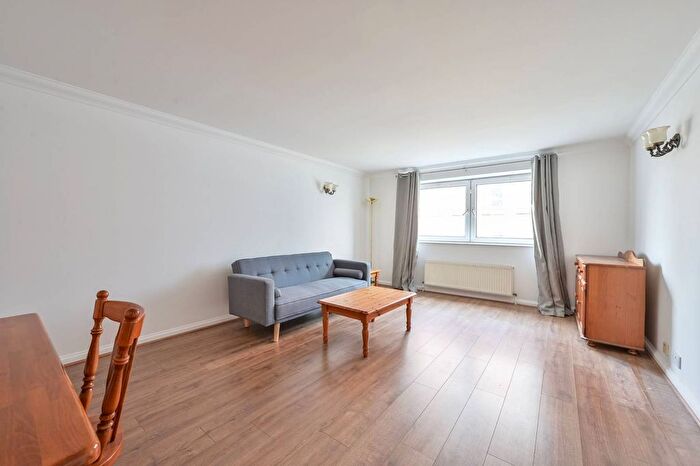
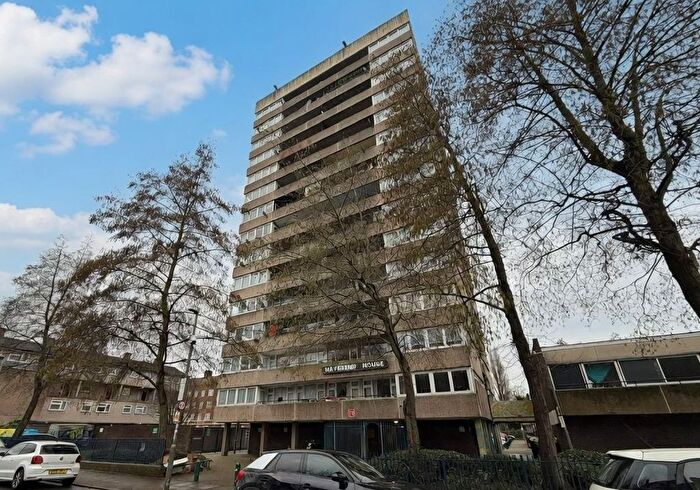
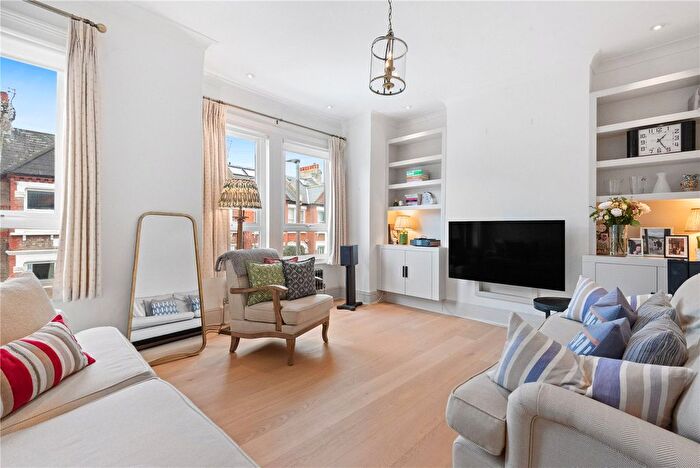
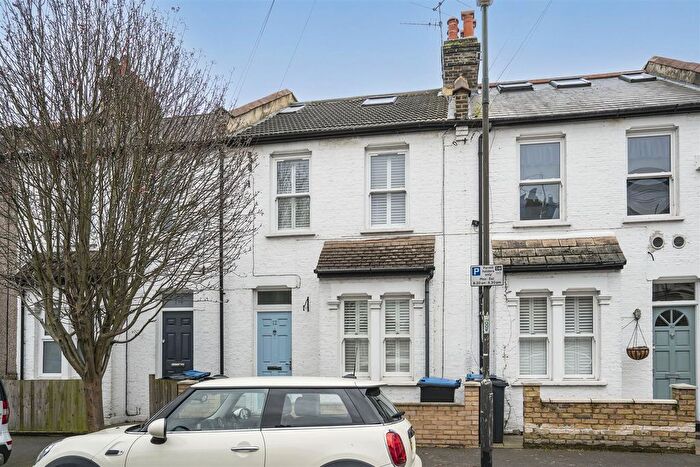
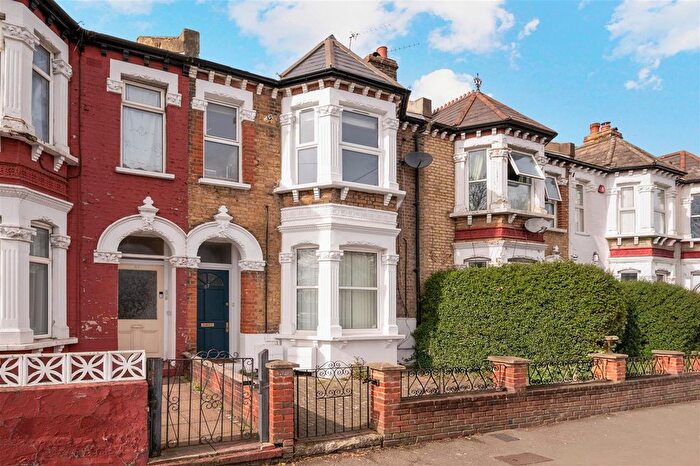
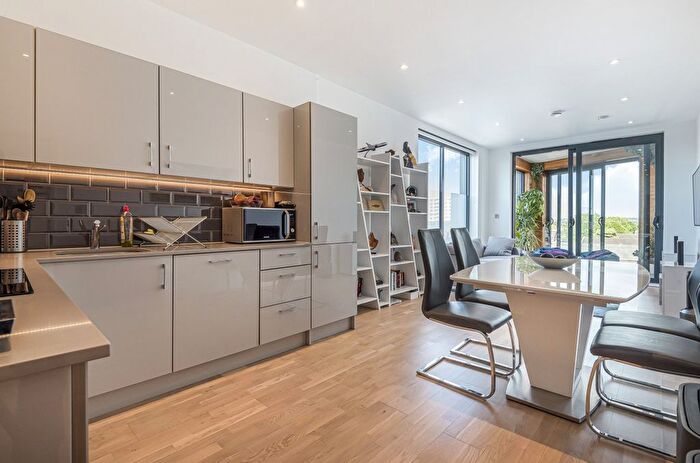
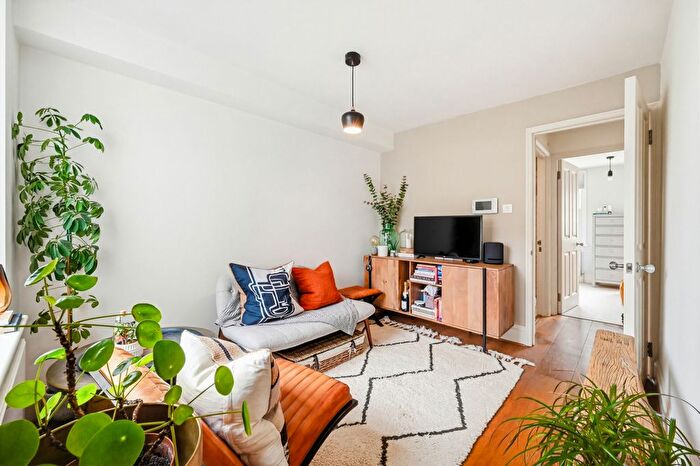
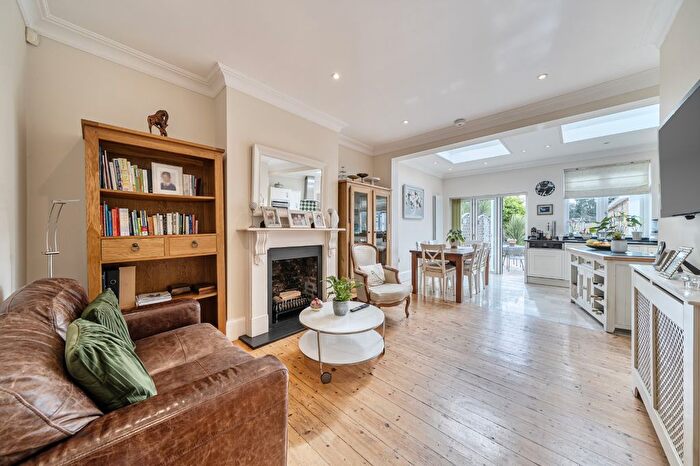
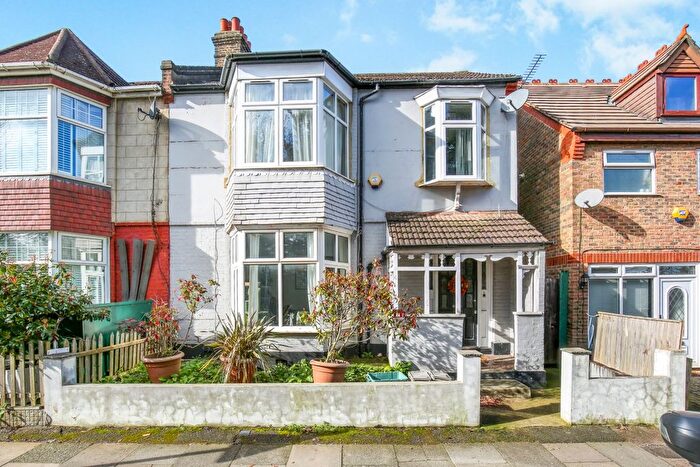
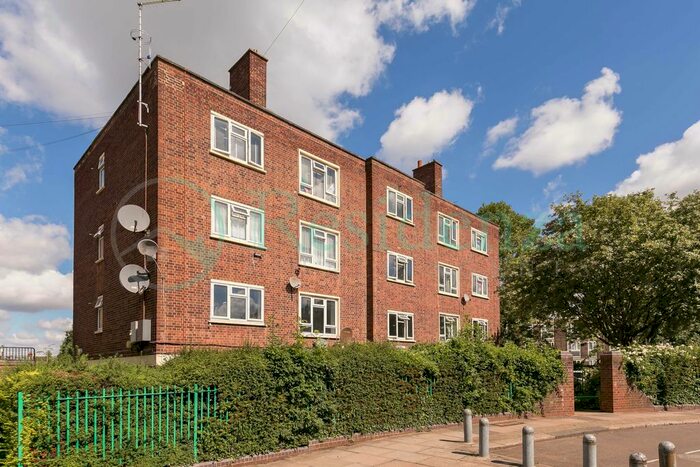
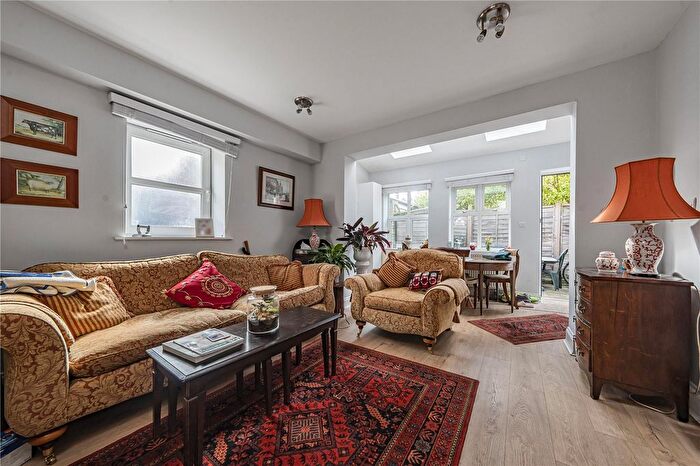
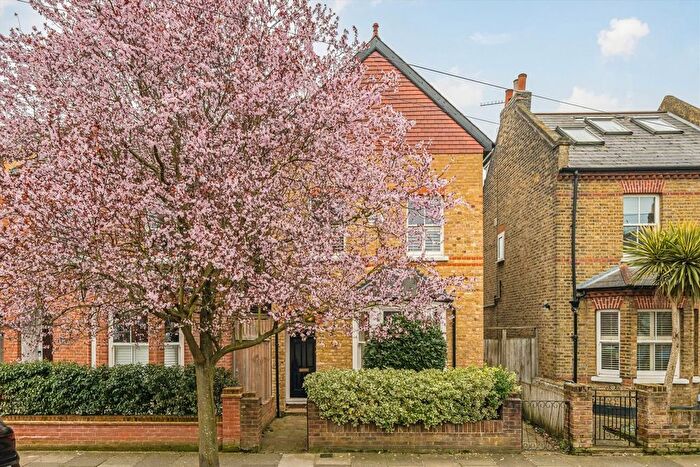
Properties for sale in Trinity
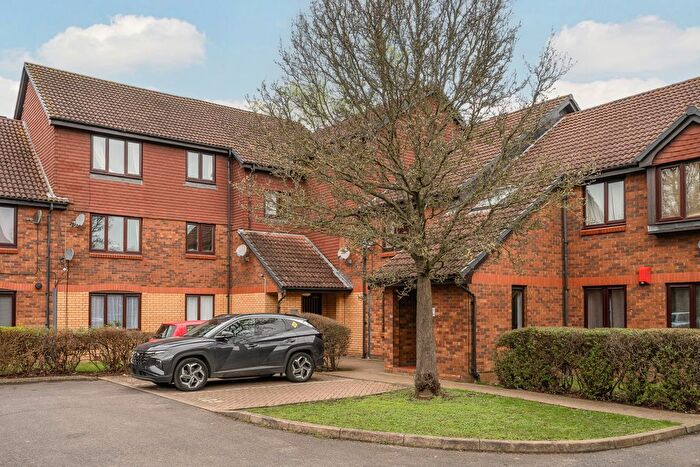
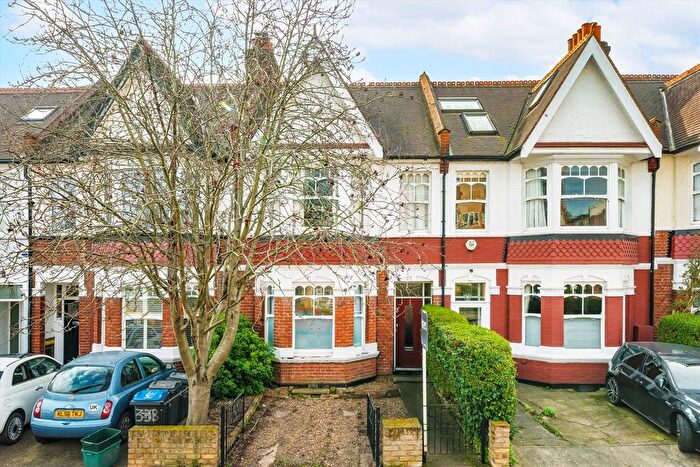
![]()
If you are looking to sell your house, let it out, or receive a property valuation, an expert can help you.
Click the button below to get started.


Roads and Postcodes in Trinity
Navigate through our locations to find the location of your next house in Trinity, London for sale or to rent.
Transport near Trinity
-
 Haydons Road Station
 -
 South Wimbledon Station
 -
Colliers Wood Station
-
 Wimbledon Station
 -
Merton Park Station
-
Dundonald Road Station
-
Morden Road Station
-
Wimbledon Park Station
-
Tooting Broadway Station
-
Wimbledon Chase Station
- FAQ
- Price Paid By Year
- Property Type Price
Frequently asked questions about Trinity
What is the average price for a property for sale in Trinity?
The average price for a property for sale in Trinity is £695,830. This amount is 17% lower than the average price in London. There are 3,771 property listings for sale in Trinity.
What streets have the most expensive properties for sale in Trinity?
The streets with the most expensive properties for sale in Trinity are Dudley Road at an average of £2,389,000, Faraday Road at an average of £1,108,153 and Evelyn Road at an average of £1,046,550.
What streets have the most affordable properties for sale in Trinity?
The streets with the most affordable properties for sale in Trinity are Shelley Way at an average of £312,821, Keats Close at an average of £357,500 and North Road at an average of £363,178.
Which train stations are available in or near Trinity?
Some of the train stations available in or near Trinity are Haydons Road, Wimbledon and Wimbledon Chase.
Which tube stations are available in or near Trinity?
Some of the tube stations available in or near Trinity are South Wimbledon, Colliers Wood and Wimbledon.
Property Price Paid in Trinity by Year
The average sold property price by year was:
| Year | Average Sold Price | Price Change |
Sold Properties
|
|---|---|---|---|
| 2025 | £695,683 | 2% |
153 Properties |
| 2024 | £680,671 | -4% |
152 Properties |
| 2023 | £710,743 | -13% |
156 Properties |
| 2022 | £799,587 | 11% |
196 Properties |
| 2021 | £707,704 | 0,2% |
225 Properties |
| 2020 | £705,958 | -3% |
138 Properties |
| 2019 | £728,171 | 10% |
149 Properties |
| 2018 | £657,746 | -9% |
135 Properties |
| 2017 | £713,800 | 1% |
155 Properties |
| 2016 | £707,495 | 9% |
180 Properties |
| 2015 | £647,313 | 11% |
181 Properties |
| 2014 | £576,669 | 11% |
199 Properties |
| 2013 | £510,735 | 12% |
223 Properties |
| 2012 | £450,862 | 0,3% |
175 Properties |
| 2011 | £449,648 | 7% |
209 Properties |
| 2010 | £420,032 | 7% |
200 Properties |
| 2009 | £390,752 | 3% |
184 Properties |
| 2008 | £379,948 | -4% |
141 Properties |
| 2007 | £393,559 | 18% |
266 Properties |
| 2006 | £322,213 | 4% |
339 Properties |
| 2005 | £307,737 | -1% |
284 Properties |
| 2004 | £310,163 | 15% |
299 Properties |
| 2003 | £264,413 | 2% |
234 Properties |
| 2002 | £259,932 | 12% |
384 Properties |
| 2001 | £228,606 | 10% |
396 Properties |
| 2000 | £204,650 | 19% |
236 Properties |
| 1999 | £166,077 | 17% |
376 Properties |
| 1998 | £137,676 | 17% |
289 Properties |
| 1997 | £114,172 | 4% |
343 Properties |
| 1996 | £110,132 | 16% |
307 Properties |
| 1995 | £92,501 | - |
205 Properties |
Property Price per Property Type in Trinity
Here you can find historic sold price data in order to help with your property search.
The average Property Paid Price for specific property types in the last three years are:
| Property Type | Average Sold Price | Sold Properties |
|---|---|---|
| Flat | £447,744.00 | 259 Flats |
| Semi Detached House | £1,328,565.00 | 38 Semi Detached Houses |
| Detached House | £1,112,000.00 | 5 Detached Houses |
| Terraced House | £935,637.00 | 159 Terraced Houses |