
Houses for sale & to rent in Coulby Newham, Middlesbrough
House Prices in Coulby Newham
Properties in Coulby Newham have an average house price of £184,761.00 and had 321 Property Transactions within the last 3 years¹.
Coulby Newham is an area in Middlesbrough, Middlesbrough with 3,833 households², where the most expensive property was sold for £1,695,000.00.
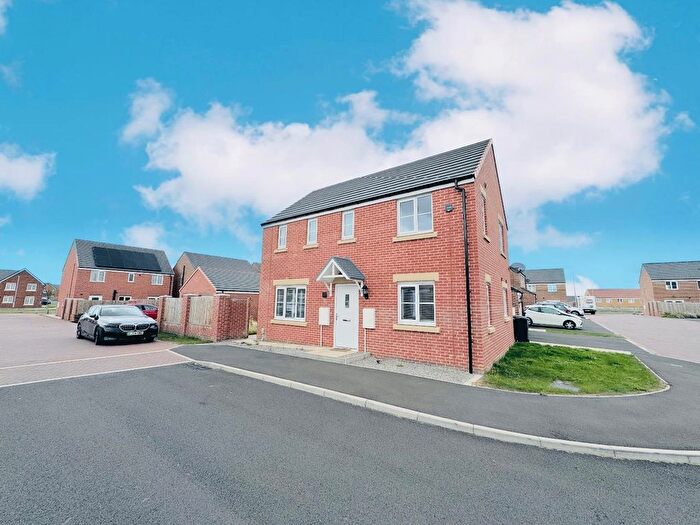
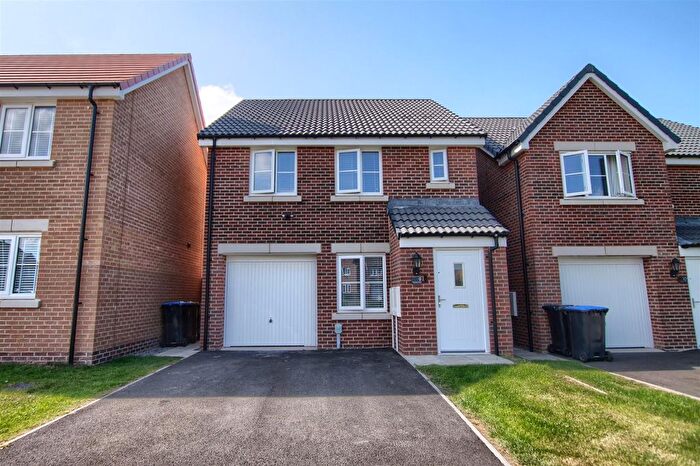
Properties for sale in Coulby Newham


![]()
If you are looking to sell your house, let it out, or receive a property valuation, an expert can help you.
Click the button below to get started.


Roads and Postcodes in Coulby Newham
Navigate through our locations to find the location of your next house in Coulby Newham, Middlesbrough for sale or to rent.
| Streets | Postcodes |
|---|---|
| Alderwood | TS8 0SZ |
| Applegarth | TS8 0UU TS8 0UY |
| Ash Green | TS8 0UP TS8 0UW |
| Ash Hill | TS8 0SX TS8 0SY |
| Barberry | TS8 0WB TS8 0XG |
| Beechfield | TS8 0TY TS8 0UN |
| Bickley Way | TS8 9NN TS8 9NW |
| Blackthorn | TS8 0XD |
| Carlton-in-cleveland | TS9 7WX |
| Charlock | TS8 0XS |
| Chervil | TS8 0GB |
| Comfrey | TS8 0XT |
| Coulby Manor Farm | TS8 0RY TS8 0RZ |
| Coulby Manor Way | TS8 0RP |
| Cranberry | TS8 0XQ |
| Cropton Way | TS8 0TL |
| Crossfields | TS8 0TS TS8 0TT TS8 0TU TS8 0TZ |
| Dalby Court | TS8 0XE |
| Dalby View | TS8 0XR |
| Dalby Way | TS8 0TW |
| De Brus Park | TS8 9RZ |
| De Havilland Wynd | TS8 9GQ |
| Dewberry | TS8 0XH |
| Elmwood | TS8 0SR TS8 0SS |
| Fernwood | TS8 0US |
| Fox Howe | TS8 0RU TS8 0RX |
| Foxgloves | TS8 0XA |
| Grange Farm | TS8 0SB |
| Grange Wood | TS8 0RT |
| Gunnergate Lane | TS8 0TE TS8 0UT |
| Hamsterley Way | TS8 0GD |
| Harvington Chase | TS8 0TR |
| Hazelbank | TS8 0TH |
| Hollis Court | TS8 0UZ |
| Hollowfield | TS8 0RR TS8 0RS |
| Langdon Square | TS8 0TF |
| Lingfield Ash | TS8 0ST TS8 0SU |
| Longhirst | TS8 0TB TS8 0TD |
| Manor Farm Way | TS8 0RJ |
| Manor Wood | TS8 0RL TS8 0RN |
| Mount Pleasant Way | TS8 0XF |
| Oakhill | TS8 0SF TS8 0SG |
| Oxfield | TS8 0TA |
| Paddock Wood | TS8 0SA |
| Parkway Centre | TS8 0TJ |
| Parkway Court | TS8 0FA |
| Pine Hill | TS8 0RW |
| Raincliffe Court | TS8 0UX |
| Ridgeway | TS8 0TQ TS8 0UD |
| Saxonfield | TS8 0SL TS8 0SN |
| Southwood | TS8 0UE TS8 0UF |
| Stainton Way | TS8 0GA |
| Stokesley Road | TS8 9DY TS8 9DZ |
| Sunnyside | TS8 0RA TS8 0RB TS8 0RD TS8 0RE TS8 0RF |
| Swallowfields | TS8 0UH |
| The Birches | TS8 0UA TS8 0UB |
| The Coppice | TS8 0RH |
| The Covert | TS8 0WN |
| The Garth | TS8 0UG |
| The Holt | TS8 0SQ |
| The Mallards | TS8 9DX |
| The Meadows | TS8 0UQ |
| The Pastures | TS8 0UJ TS8 0UL |
| The Ridge | TS8 0UR |
| Thistle Rise | TS8 0RG TS8 0RQ |
| Tollesby Bridge | TS8 0SD TS8 0SE |
| Willowbank | TS8 0SP TS8 0SW |
| Woodlea | TS8 0TX |
| Woodrush | TS8 0XB |
| Woodvale | TS8 0SH TS8 0SJ |
| Wykeham Way | TS8 0TG |
| TS7 8WT TS7 8WY TS8 8AU TS8 8BP TS8 8BR TS8 8DN TS8 8DP TS8 8DR TS8 8DS TS8 8DT TS8 8DU TS8 8DW TS8 9EH |
Transport near Coulby Newham

- FAQ
- Price Paid By Year
- Property Type Price
Frequently asked questions about Coulby Newham
What is the average price for a property for sale in Coulby Newham?
The average price for a property for sale in Coulby Newham is £184,761. This amount is 34% higher than the average price in Middlesbrough. There are 1,172 property listings for sale in Coulby Newham.
What streets have the most expensive properties for sale in Coulby Newham?
The streets with the most expensive properties for sale in Coulby Newham are De Brus Park at an average of £786,666, Woodvale at an average of £373,516 and Pine Hill at an average of £340,000.
What streets have the most affordable properties for sale in Coulby Newham?
The streets with the most affordable properties for sale in Coulby Newham are Longhirst at an average of £73,714, The Coppice at an average of £79,000 and Manor Wood at an average of £81,025.
Which train stations are available in or near Coulby Newham?
Some of the train stations available in or near Coulby Newham are Marton, Gypsy Lane and Nunthorpe.
Property Price Paid in Coulby Newham by Year
The average sold property price by year was:
| Year | Average Sold Price | Price Change |
Sold Properties
|
|---|---|---|---|
| 2025 | £196,390 | 9% |
41 Properties |
| 2024 | £178,517 | 1% |
89 Properties |
| 2023 | £176,246 | -9% |
82 Properties |
| 2022 | £191,890 | 20% |
109 Properties |
| 2021 | £153,680 | -12% |
134 Properties |
| 2020 | £171,677 | 5% |
125 Properties |
| 2019 | £162,424 | -2% |
121 Properties |
| 2018 | £165,824 | 4% |
104 Properties |
| 2017 | £158,589 | 11% |
111 Properties |
| 2016 | £140,539 | -10% |
104 Properties |
| 2015 | £154,513 | 1% |
122 Properties |
| 2014 | £152,455 | 5% |
103 Properties |
| 2013 | £145,424 | 8% |
84 Properties |
| 2012 | £133,363 | -7% |
71 Properties |
| 2011 | £142,462 | -8% |
75 Properties |
| 2010 | £154,461 | 8% |
77 Properties |
| 2009 | £142,780 | -12% |
94 Properties |
| 2008 | £159,456 | -8% |
117 Properties |
| 2007 | £171,487 | 14% |
247 Properties |
| 2006 | £147,257 | 6% |
211 Properties |
| 2005 | £139,125 | 6% |
117 Properties |
| 2004 | £130,134 | 20% |
156 Properties |
| 2003 | £104,020 | 24% |
174 Properties |
| 2002 | £78,721 | 9% |
190 Properties |
| 2001 | £71,904 | 14% |
184 Properties |
| 2000 | £61,506 | 1% |
154 Properties |
| 1999 | £61,117 | 3% |
165 Properties |
| 1998 | £59,105 | -1% |
114 Properties |
| 1997 | £59,729 | -7% |
133 Properties |
| 1996 | £63,822 | 5% |
143 Properties |
| 1995 | £60,672 | - |
185 Properties |
Property Price per Property Type in Coulby Newham
Here you can find historic sold price data in order to help with your property search.
The average Property Paid Price for specific property types in the last three years are:
| Property Type | Average Sold Price | Sold Properties |
|---|---|---|
| Semi Detached House | £145,428.00 | 117 Semi Detached Houses |
| Detached House | £256,760.00 | 125 Detached Houses |
| Terraced House | £148,993.00 | 59 Terraced Houses |
| Flat | £70,380.00 | 20 Flats |