
Houses for sale & to rent in Marton, Middlesbrough
House Prices in Marton
Properties in Marton have an average house price of £181,399.00 and had 331 Property Transactions within the last 3 years¹.
Marton is an area in Middlesbrough, Middlesbrough with 1,946 households², where the most expensive property was sold for £760,000.00.
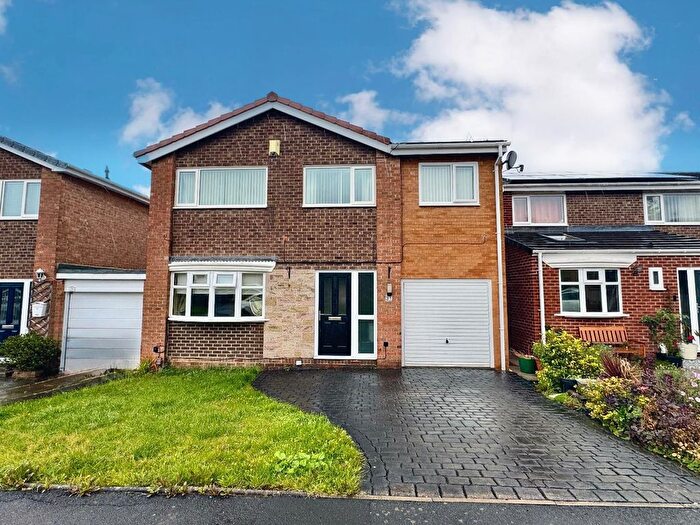
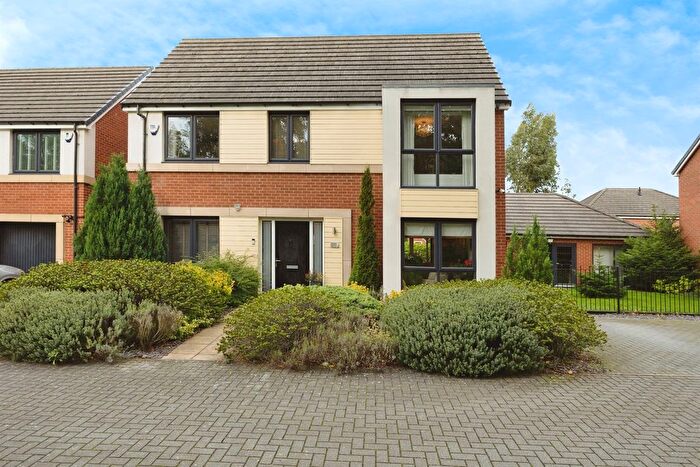
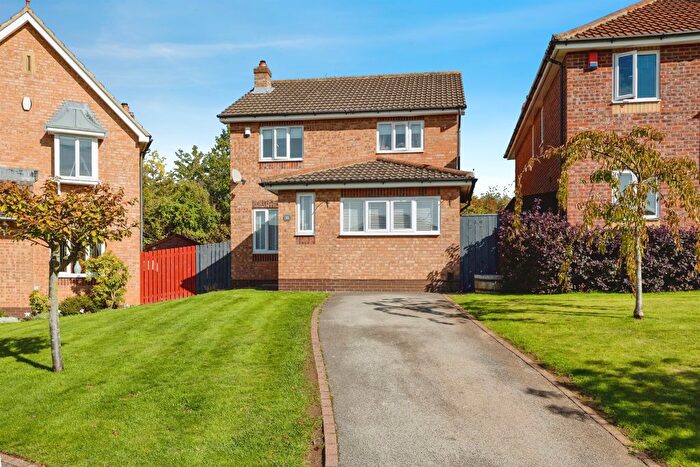
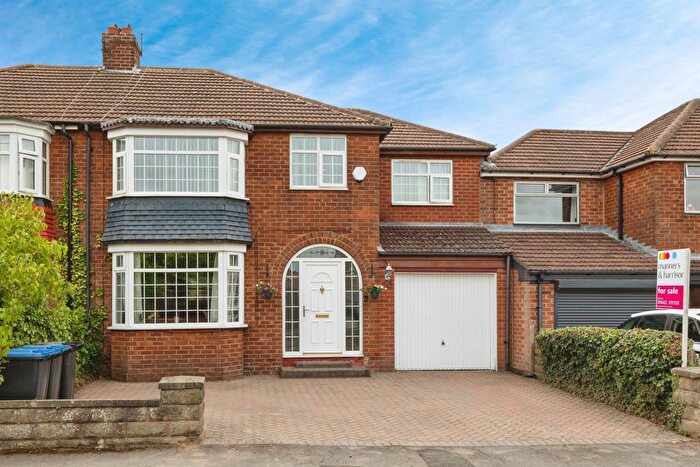
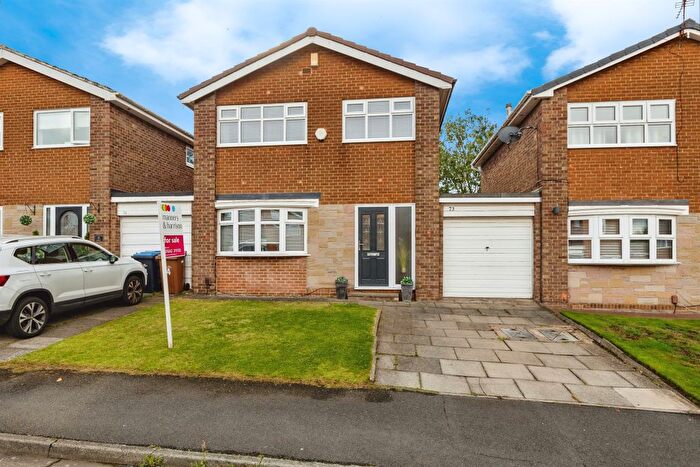
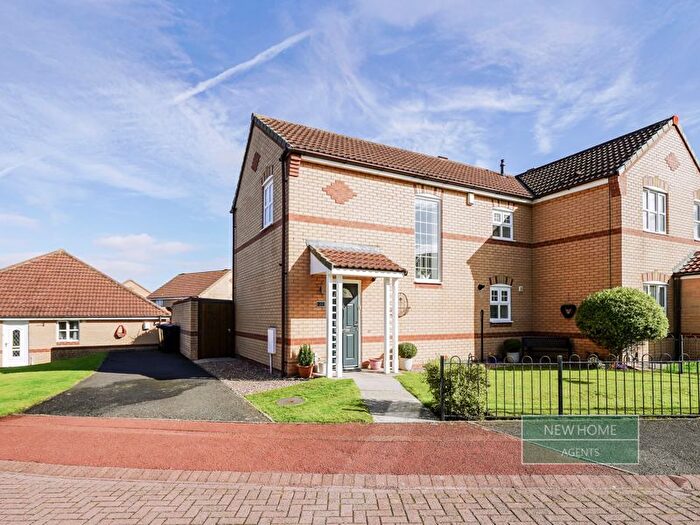
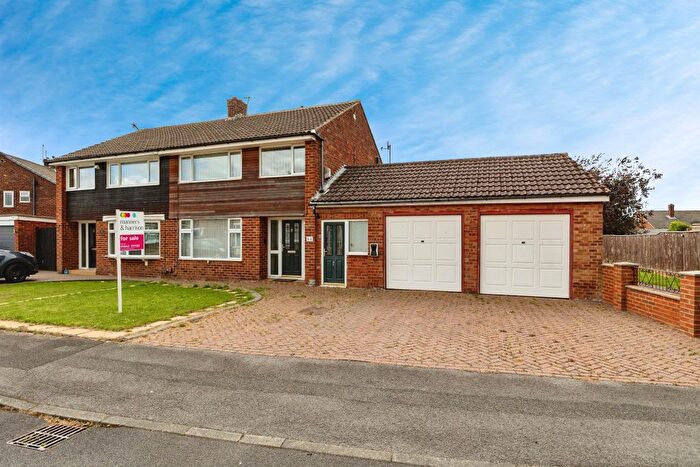
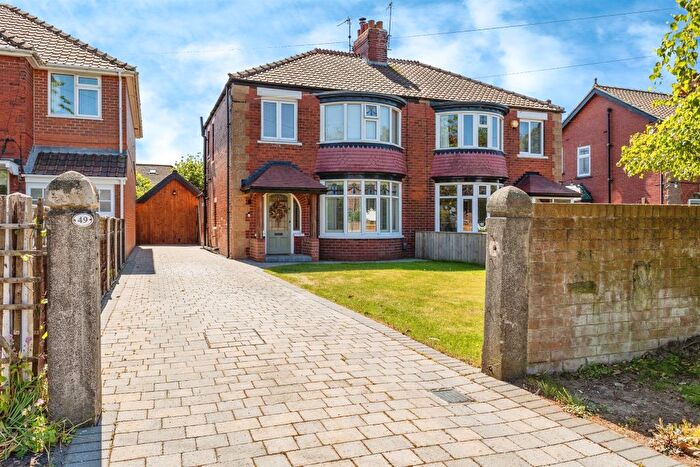
Properties for sale in Marton
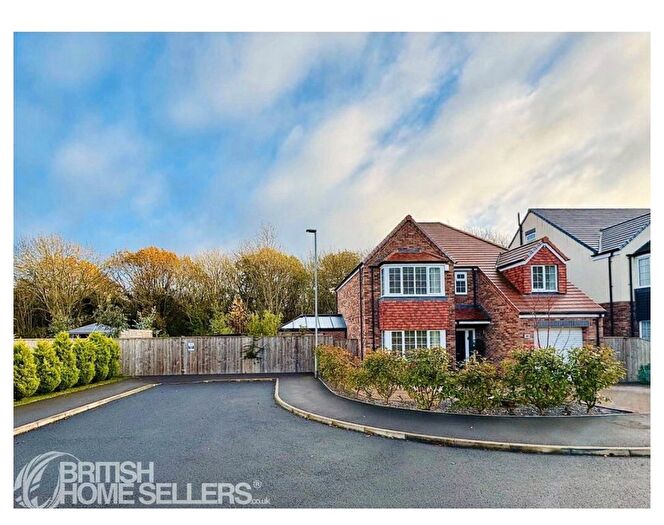
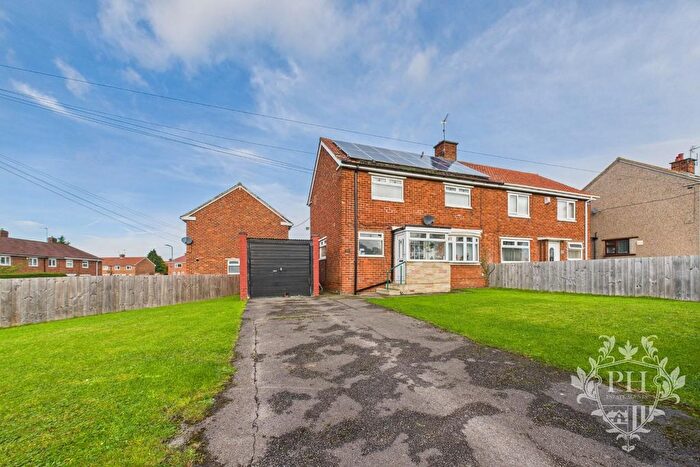
![]()
If you are looking to sell your house, let it out, or receive a property valuation, an expert can help you.
Click the button below to get started.
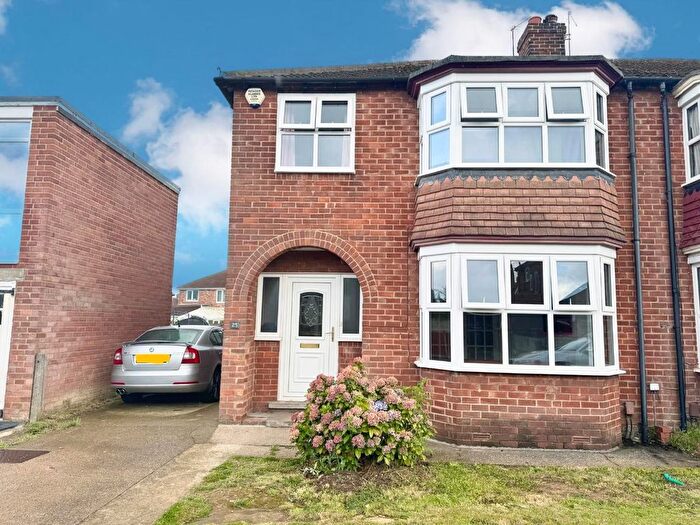
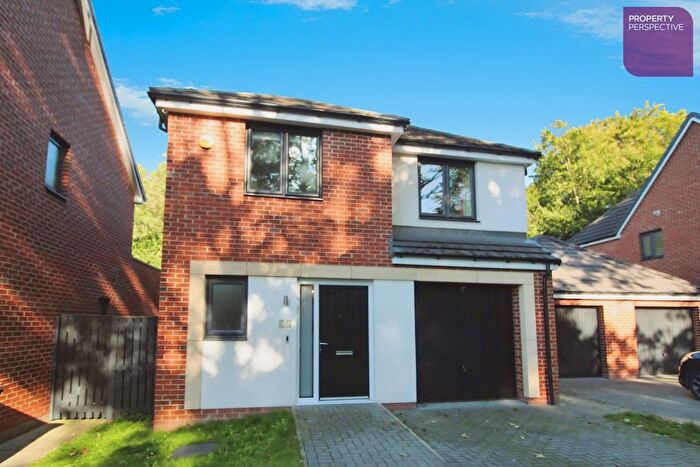
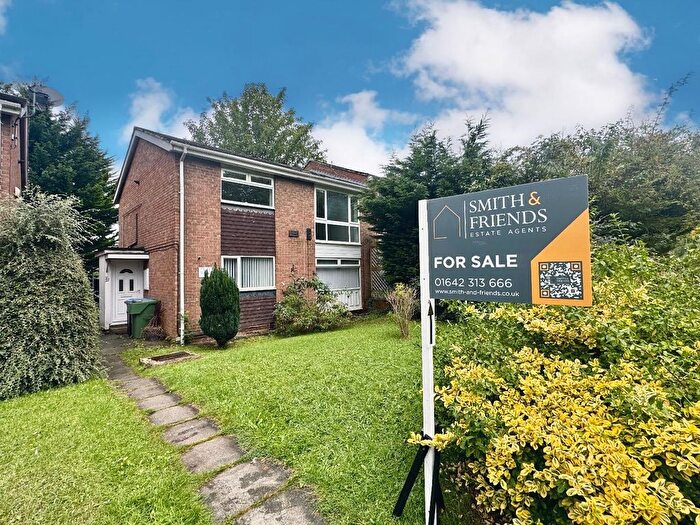
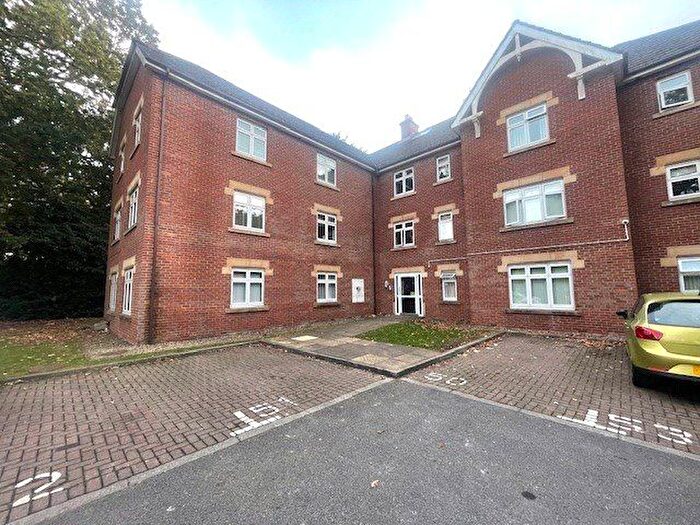
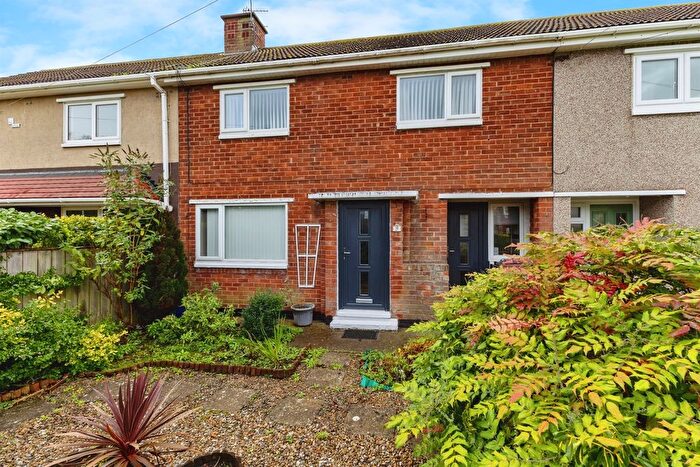
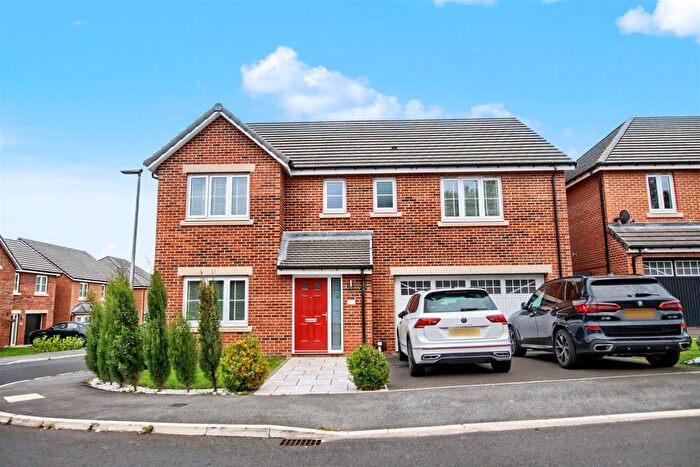
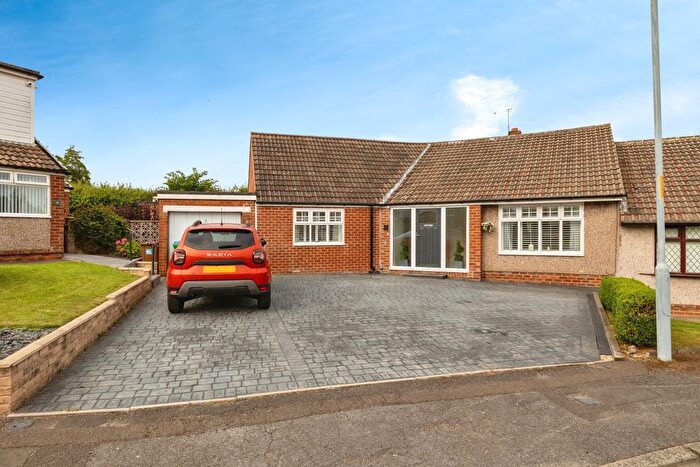
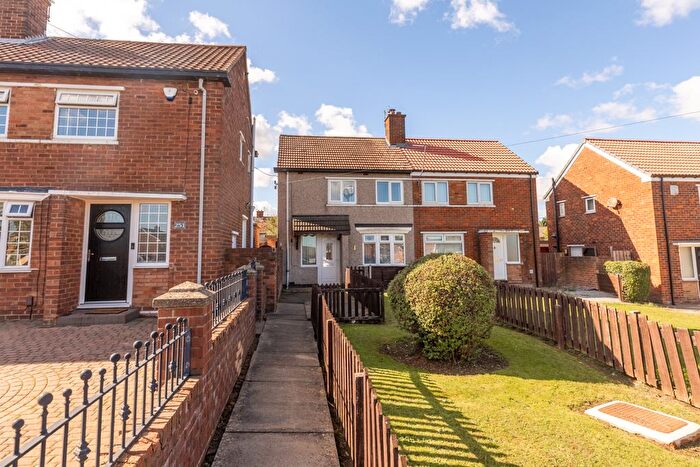
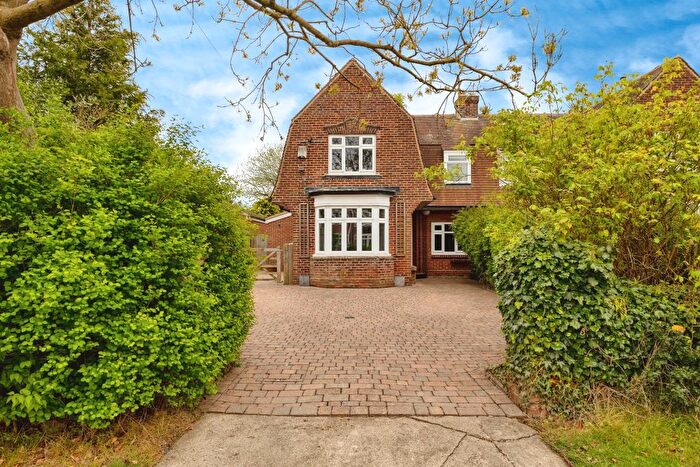
Previously listed properties in Marton
![]()
If you are looking to sell your house, let it out, or receive a property valuation, an expert can help you.
Click the button below to get started.
Roads and Postcodes in Marton
Navigate through our locations to find the location of your next house in Marton, Middlesbrough for sale or to rent.
| Streets | Postcodes |
|---|---|
| Alderlea | TS7 8DL |
| Auckland Avenue | TS7 8NR |
| Barnack Avenue | TS7 8QB |
| Beeches Rise | TS7 8DR |
| Birchwood Road | TS7 8DD TS7 8DE TS7 8DF TS7 8DG TS7 8DH TS7 8DQ |
| Bramley Grove | TS7 8QA |
| Brindle Close | TS7 8PS |
| Captain Cooks Crescent | TS7 8NJ TS7 8NN TS7 8NW |
| Cedar Road | TS7 8DA |
| Chestnut Drive | TS7 8BT TS7 8BU TS7 8BX TS7 8BY |
| Cleveland Drive | TS7 8AE |
| Cloverwood Close | TS7 8AZ |
| Cutler Close | TS7 8QD |
| Cypress Road | TS7 8PZ |
| Dixons Bank | TS7 8NT TS7 8NU |
| Elm Drive | TS7 8BN |
| Farington Drive | TS7 8PH |
| Galgate Close | TS7 8PX |
| Garstang Close | TS7 8PE |
| Gascoyne Close | TS7 8QE |
| Gilkes Walk | TS4 3RT |
| Gypsy Lane | TS7 8NF TS7 8NG TS7 8NH TS7 8NQ TS7 8PD |
| Hawthorn Crescent | TS7 8DP |
| Hazel Grove | TS7 8DJ |
| Hoskins Lane | TS4 3GL TS4 3RR |
| Hulton Close | TS7 8PG |
| Juniper Grove | TS7 8DW |
| Lambourne Drive | TS7 8QF |
| Larch Close | TS7 8DN |
| Laurel Road | TS7 8BH |
| Lime Close | TS7 8BW |
| Maidstone Drive | TS7 8QW |
| Margill Close | TS7 8QG |
| Marton Avenue | TS4 3SQ |
| Marton-in-cleveland | TS7 8BG |
| Melbourne Close | TS7 8NL |
| Memorial Drive | TS7 8EL |
| Monarch Grove | TS7 8QQ |
| Oak Avenue | TS7 8BZ |
| Orleans Grove | TS7 8QH |
| Oval View | TS4 3SW |
| Pease Gardens | TS4 3SN |
| Pinewood Road | TS7 8DB |
| Planetree Court | TS7 8QT |
| Ribbleton Close | TS7 8PQ |
| Riversway | TS7 8QL |
| Roseland Crescent | TS7 8AH |
| Roseland Drive | TS7 8AQ |
| Rosewood Court | TS7 8QR TS7 8QS |
| Roundsway | TS7 8QJ |
| Rufford Close | TS7 8PF |
| Saltcote | TS7 8QN |
| Sandling Court | TS7 8QP |
| Scholars Rise | TS4 3RP |
| Scotforth Close | TS7 8PU |
| Shevington Grove | TS7 8PY |
| South Drive | TS7 8AD |
| Tasmania Square | TS7 8NP TS7 8NS |
| The Grove | TS7 8AA TS7 8AB TS7 8AF TS7 8AG TS7 8AJ TS7 8AL TS7 8AN TS7 8AP |
| The Ladle | TS4 3SL |
| The Village | TS7 8BD TS7 8BE |
| The Willows | TS7 8BJ TS7 8BL TS7 8BP TS7 8BS |
| Thurnham Grove | TS7 8PT |
| Turnbull Way | TS4 3RS |
| West Side | TS7 8BB |
| Wilson Place | TS4 3TS |
| Yew Tree Grove | TS7 8QX |
Transport near Marton

- FAQ
- Price Paid By Year
- Property Type Price
Frequently asked questions about Marton
What is the average price for a property for sale in Marton?
The average price for a property for sale in Marton is £181,399. This amount is 31% higher than the average price in Middlesbrough. There are 280 property listings for sale in Marton.
What streets have the most expensive properties for sale in Marton?
The streets with the most expensive properties for sale in Marton are Marton-in-cleveland at an average of £690,000, Cleveland Drive at an average of £447,625 and The Grove at an average of £446,125.
What streets have the most affordable properties for sale in Marton?
The streets with the most affordable properties for sale in Marton are Riversway at an average of £77,000, Saltcote at an average of £80,000 and Roundsway at an average of £85,000.
Which train stations are available in or near Marton?
Some of the train stations available in or near Marton are Gypsy Lane, Marton and Nunthorpe.
Property Price Paid in Marton by Year
The average sold property price by year was:
| Year | Average Sold Price | Price Change |
Sold Properties
|
|---|---|---|---|
| 2025 | £195,496 | 10% |
49 Properties |
| 2024 | £175,240 | 3% |
84 Properties |
| 2023 | £170,673 | -11% |
95 Properties |
| 2022 | £189,609 | -7% |
103 Properties |
| 2021 | £202,826 | 15% |
141 Properties |
| 2020 | £171,555 | 14% |
83 Properties |
| 2019 | £147,820 | 3% |
123 Properties |
| 2018 | £143,534 | -11% |
85 Properties |
| 2017 | £159,421 | 4% |
110 Properties |
| 2016 | £153,451 | -3% |
92 Properties |
| 2015 | £158,154 | -1% |
131 Properties |
| 2014 | £160,143 | 4% |
159 Properties |
| 2013 | £153,236 | -3% |
140 Properties |
| 2012 | £158,412 | 12% |
86 Properties |
| 2011 | £138,952 | -13% |
99 Properties |
| 2010 | £157,036 | -11% |
69 Properties |
| 2009 | £174,394 | 2% |
54 Properties |
| 2008 | £170,600 | 2% |
51 Properties |
| 2007 | £166,453 | -1% |
82 Properties |
| 2006 | £167,684 | 14% |
116 Properties |
| 2005 | £144,092 | 4% |
133 Properties |
| 2004 | £137,883 | 14% |
93 Properties |
| 2003 | £118,238 | 19% |
122 Properties |
| 2002 | £95,596 | 13% |
159 Properties |
| 2001 | £83,123 | -8% |
136 Properties |
| 2000 | £89,713 | 20% |
99 Properties |
| 1999 | £71,647 | 11% |
100 Properties |
| 1998 | £63,772 | 8% |
74 Properties |
| 1997 | £58,611 | -1% |
73 Properties |
| 1996 | £59,209 | -5% |
91 Properties |
| 1995 | £62,280 | - |
63 Properties |
Property Price per Property Type in Marton
Here you can find historic sold price data in order to help with your property search.
The average Property Paid Price for specific property types in the last three years are:
| Property Type | Average Sold Price | Sold Properties |
|---|---|---|
| Semi Detached House | £181,949.00 | 151 Semi Detached Houses |
| Detached House | £268,911.00 | 72 Detached Houses |
| Terraced House | £158,440.00 | 47 Terraced Houses |
| Flat | £94,435.00 | 61 Flats |