Houses for sale & to rent in Burford, Burford
House Prices in Burford
Properties in Burford have an average house price of £814,232.00 and had 104 Property Transactions within the last 3 years¹.
Burford is an area in Burford, Oxfordshire with 861 households², where the most expensive property was sold for £2,850,000.00.
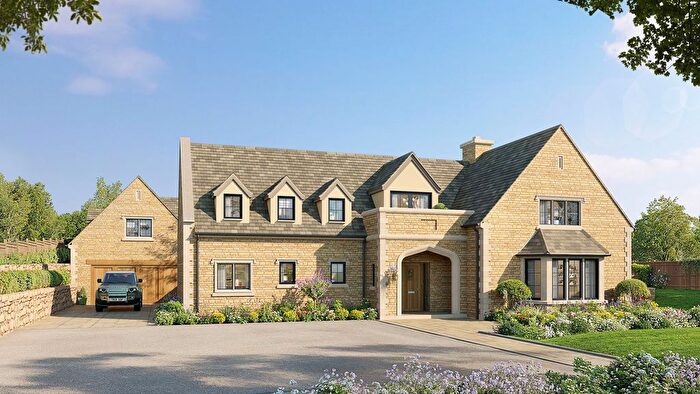
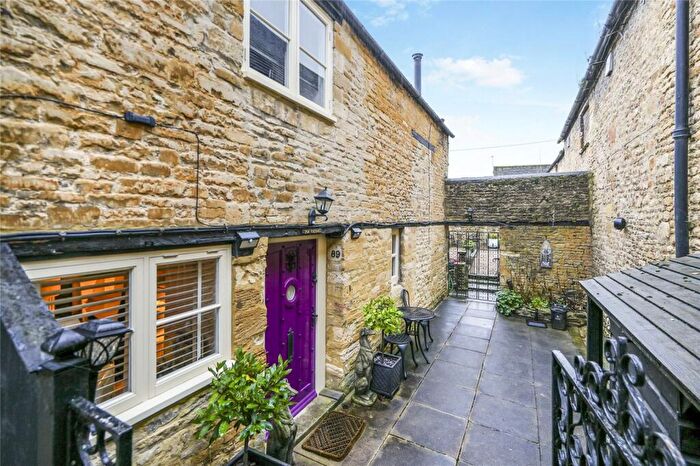
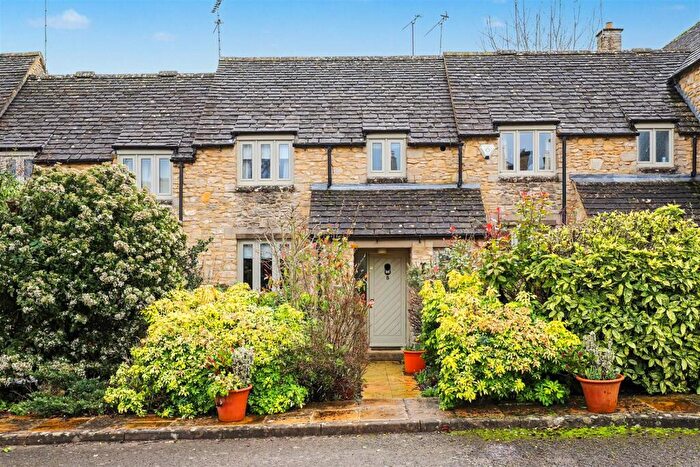
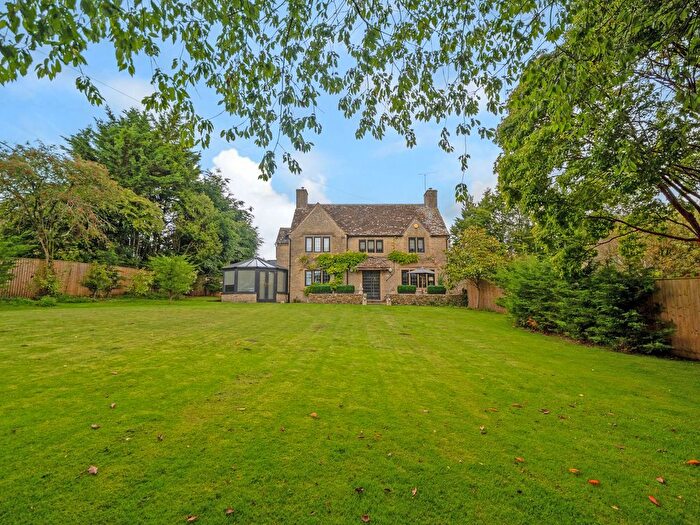
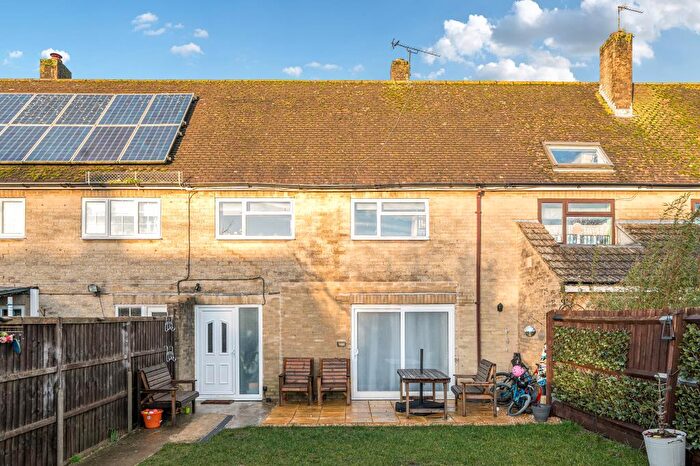
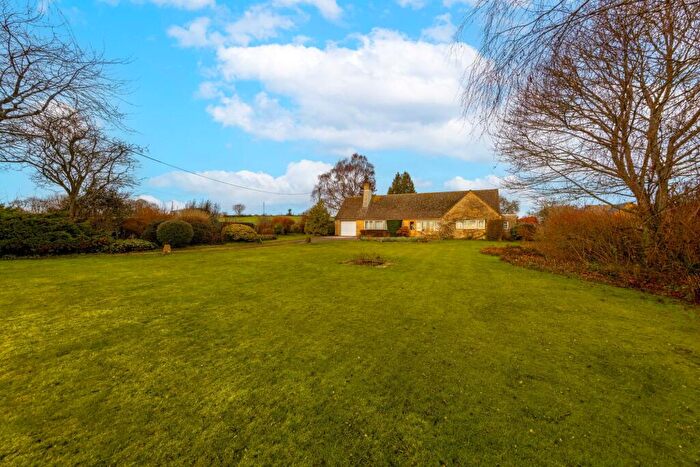
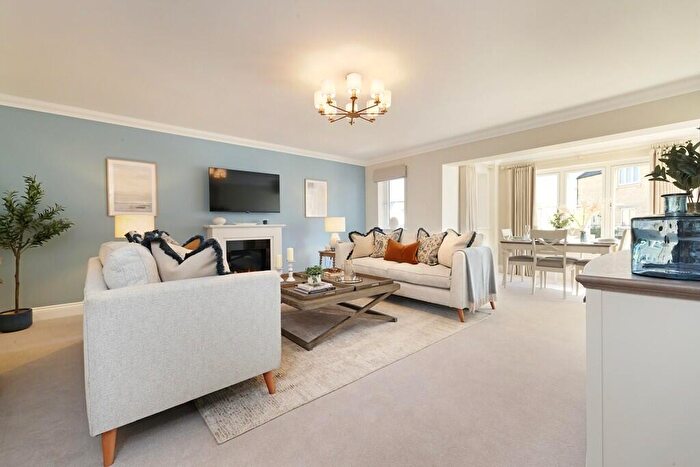
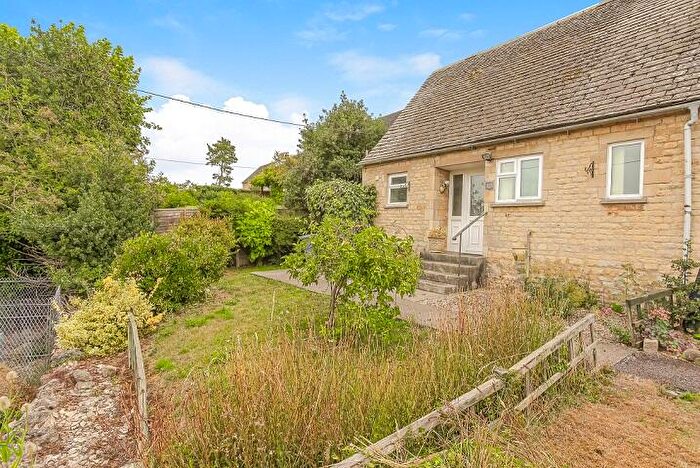
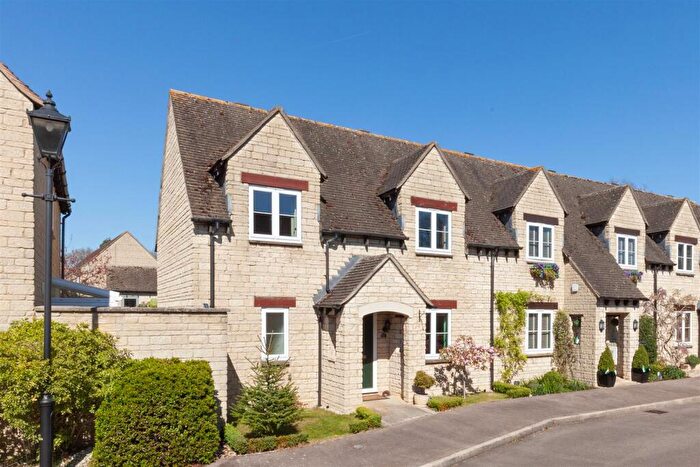
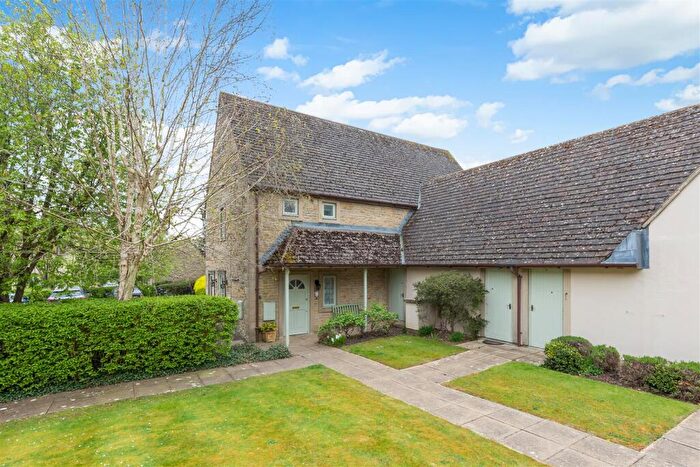
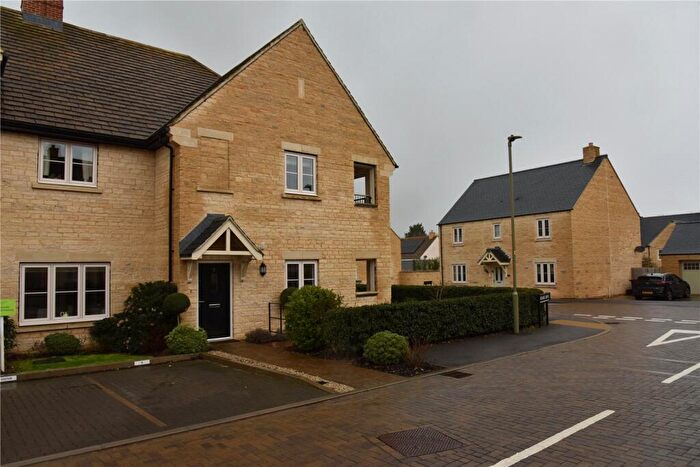
Properties for sale in Burford
Roads and Postcodes in Burford
Navigate through our locations to find the location of your next house in Burford, Burford for sale or to rent.
| Streets | Postcodes |
|---|---|
| Arkel Close | OX18 4DH |
| Barns Lane | OX18 4NE OX18 4NF |
| Beech Grove | OX18 4DE |
| Burford Hill Mews | OX18 4AR |
| Burford Road | OX18 4BL |
| Burgage Gardens | OX18 4SR |
| Bury Barn Cottages | OX18 4JF |
| Castle Yard | OX18 4SB |
| Chapmans Piece | OX18 4DN |
| Cheatle Court | OX18 4AY |
| Cheatle Crescent | OX18 4NJ |
| Cheltenham Road | OX18 4PJ OX18 4JA OX18 4PL |
| Church Green | OX18 4RY OX18 4RZ |
| Church Lane | OX18 4BA OX18 4SD OX18 4SA |
| Dolphin Lane | OX18 4BB |
| Falkland Close | OX18 4NL |
| Frethern Close | OX18 4NS OX18 4NT OX18 4NU OX18 4NX OX18 4NY |
| Frethern Court | OX18 4AZ |
| Fulbrook Hill | OX18 4BH |
| Garnes Lane | OX18 4BN |
| George Yard | OX18 4QN |
| Guildenford | OX18 4SE OX18 4SF |
| High Street | OX18 4QA OX18 4QF OX18 4QJ OX18 4QU OX18 4RG OX18 4QR |
| Hunts Close | OX18 4HU |
| Lawrence Lane | OX18 4RP |
| Lower High Street | OX18 4RN OX18 4RR |
| Manor Farm Cottages | OX18 4UB |
| Meadow End | OX18 4BQ |
| Meadow Lane | OX18 4BS OX18 4BW |
| Orchard Rise | OX18 4SZ |
| Orchard Row | OX18 4BT |
| Oxford Road | OX18 4NP OX18 4NR OX18 4PQ OX18 4PG OX18 4PH |
| Pethers Piece | OX18 4NH |
| Priory Lane | OX18 4SG OX18 4SQ |
| Pytts Lane | OX18 4SJ |
| Sheep Street | OX18 4LS OX18 4LT OX18 4LH OX18 4LN OX18 4LR OX18 4LW |
| Shilton Road | OX18 4PA OX18 4PB OX18 4PD OX18 4PE |
| Shipton Road | OX18 4BU OX18 4BY |
| Signet End | OX18 4PZ |
| Signet Hill | OX18 4JB OX18 4JD OX18 4JE |
| Swan Lane | OX18 4SH |
| Swan Lane Close | OX18 4SP |
| Sweeps Lane | OX18 4ND |
| Sylvester Close | OX18 4RU |
| Tanners Lane | OX18 4NA OX18 4NB |
| The Hill | OX18 4HX OX18 4QY OX18 4RE |
| The Rickyard | OX18 4DF |
| Upper End | OX18 4BX |
| Upton Downs Cottages | OX18 4LY |
| Walnut Row | OX18 4BG |
| Westhall Hill | OX18 4BJ |
| White Hill | OX18 4EX |
| Widford Lane | OX18 4DG |
| Windrush Close | OX18 4SL |
| Witney Street | OX18 4DR OX18 4RX OX18 4SN OX18 4DQ OX18 4DW |
| Wysdom Way | OX18 4NG |
| OX18 4BD OX18 4BE OX18 4BZ OX18 4JQ OX18 4LU OX18 4TZ OX18 4UH OX18 4DT OX18 4JG OX18 4LX OX7 6HX |
Transport near Burford
- FAQ
- Price Paid By Year
- Property Type Price
Frequently asked questions about Burford
What is the average price for a property for sale in Burford?
The average price for a property for sale in Burford is £814,232. This amount is 2% higher than the average price in Burford. There are 312 property listings for sale in Burford.
What streets have the most expensive properties for sale in Burford?
The streets with the most expensive properties for sale in Burford are Manor Farm Cottages at an average of £2,842,000, Burford Road at an average of £1,650,000 and Swan Lane at an average of £1,284,000.
What streets have the most affordable properties for sale in Burford?
The streets with the most affordable properties for sale in Burford are Falkland Close at an average of £88,000, Oxford Road at an average of £295,000 and Guildenford at an average of £325,000.
Which train stations are available in or near Burford?
Some of the train stations available in or near Burford are Shipton, Ascott-Under-Wychwood and Kingham.
Property Price Paid in Burford by Year
The average sold property price by year was:
| Year | Average Sold Price | Price Change |
Sold Properties
|
|---|---|---|---|
| 2025 | £844,845 | 9% |
34 Properties |
| 2024 | £766,437 | -8% |
32 Properties |
| 2023 | £827,090 | -17% |
38 Properties |
| 2022 | £966,412 | 23% |
40 Properties |
| 2021 | £744,317 | -4% |
50 Properties |
| 2020 | £773,835 | 13% |
50 Properties |
| 2019 | £676,902 | -13% |
36 Properties |
| 2018 | £765,292 | 22% |
35 Properties |
| 2017 | £593,542 | 22% |
25 Properties |
| 2016 | £464,059 | -18% |
40 Properties |
| 2015 | £547,012 | -8% |
36 Properties |
| 2014 | £588,831 | 25% |
37 Properties |
| 2013 | £441,435 | -40% |
28 Properties |
| 2012 | £618,576 | 32% |
26 Properties |
| 2011 | £420,875 | -15% |
36 Properties |
| 2010 | £483,316 | 16% |
30 Properties |
| 2009 | £404,290 | -34% |
28 Properties |
| 2008 | £542,261 | 26% |
22 Properties |
| 2007 | £399,560 | -28% |
57 Properties |
| 2006 | £511,465 | 3% |
45 Properties |
| 2005 | £496,062 | 23% |
39 Properties |
| 2004 | £383,077 | 1% |
51 Properties |
| 2003 | £378,884 | 25% |
48 Properties |
| 2002 | £285,377 | 6% |
51 Properties |
| 2001 | £267,016 | -14% |
46 Properties |
| 2000 | £303,606 | 35% |
44 Properties |
| 1999 | £198,200 | -12% |
51 Properties |
| 1998 | £221,854 | 17% |
29 Properties |
| 1997 | £185,100 | 16% |
38 Properties |
| 1996 | £154,853 | -6% |
33 Properties |
| 1995 | £164,478 | - |
33 Properties |
Property Price per Property Type in Burford
Here you can find historic sold price data in order to help with your property search.
The average Property Paid Price for specific property types in the last three years are:
| Property Type | Average Sold Price | Sold Properties |
|---|---|---|
| Semi Detached House | £767,632.00 | 26 Semi Detached Houses |
| Detached House | £1,106,907.00 | 38 Detached Houses |
| Terraced House | £572,830.00 | 34 Terraced Houses |
| Flat | £530,500.00 | 6 Flats |

