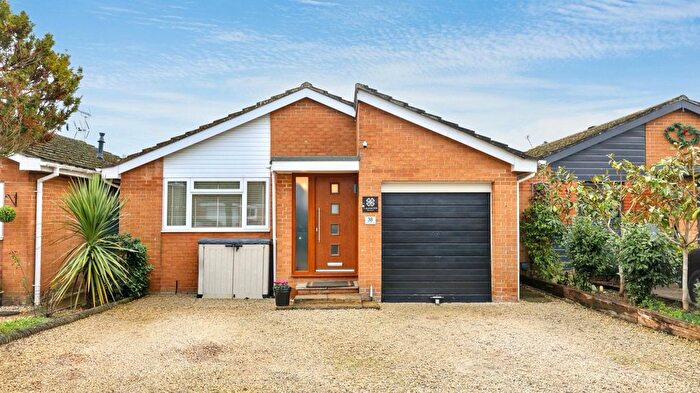
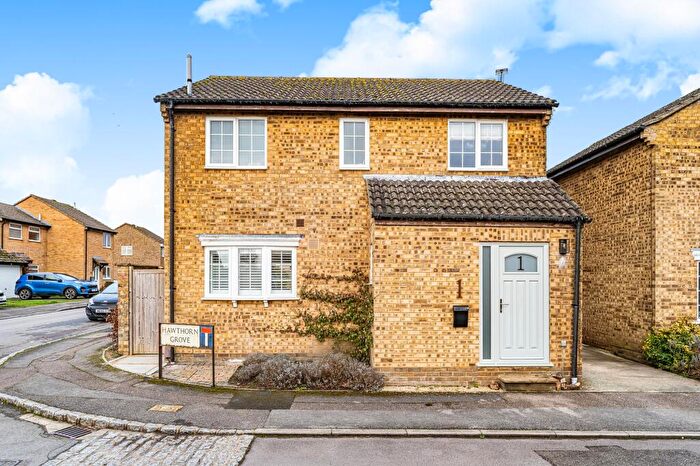
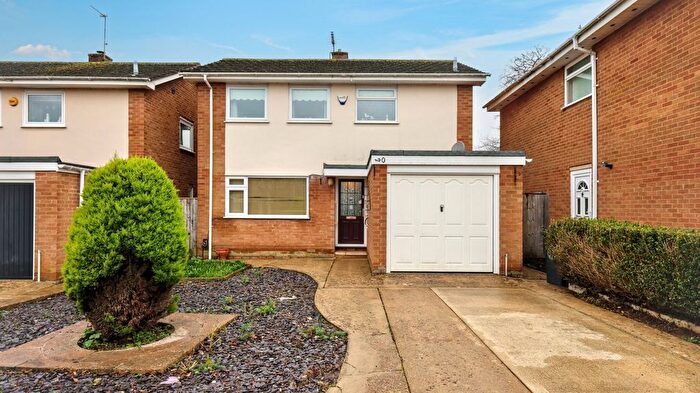
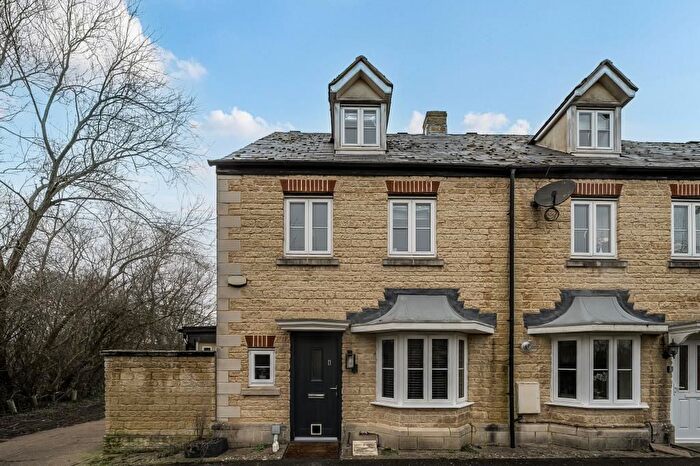
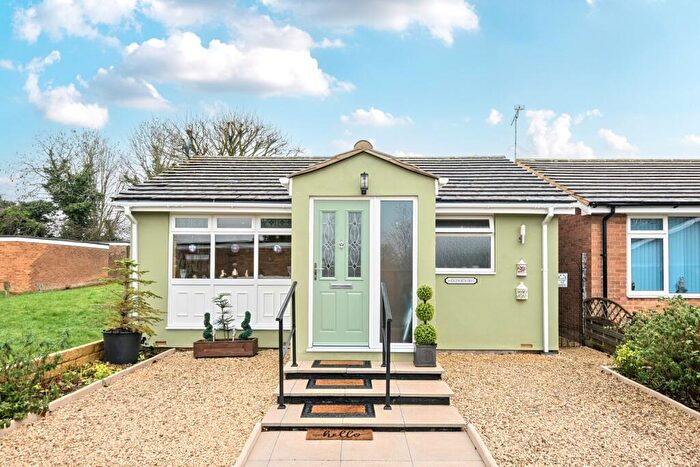
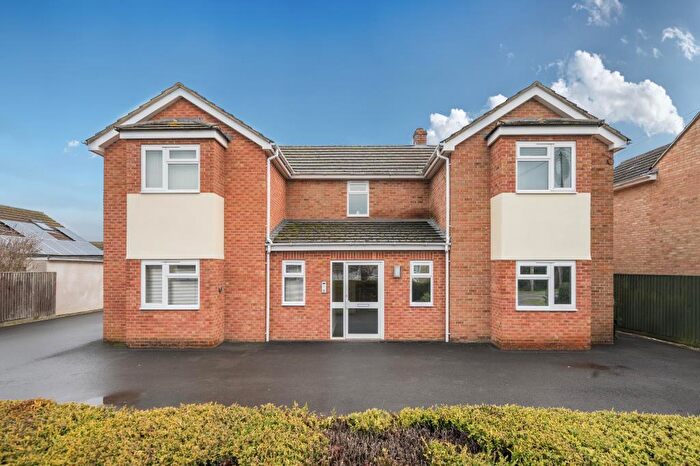
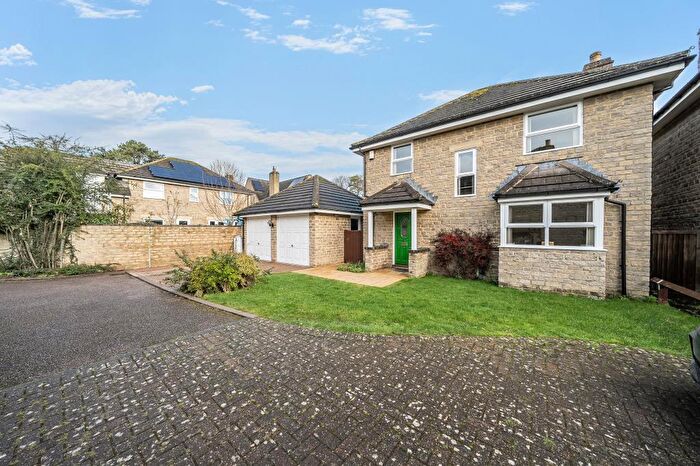
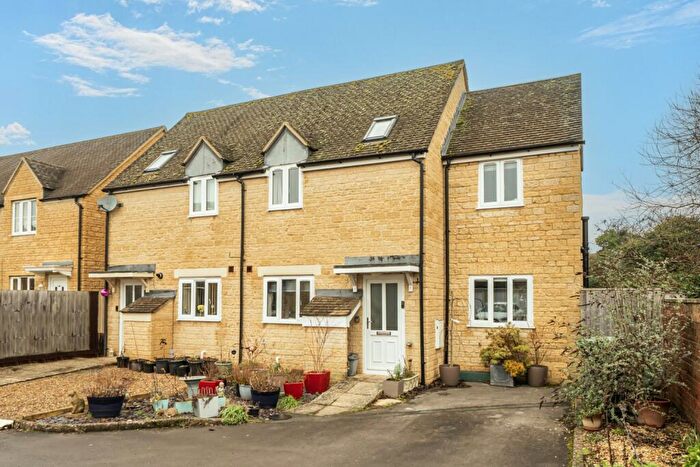
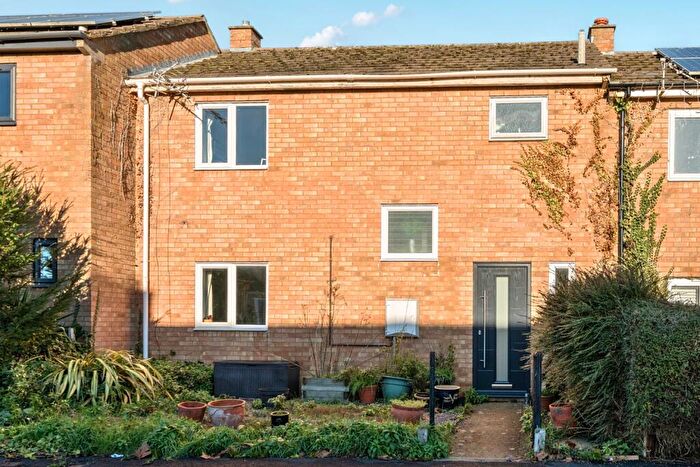
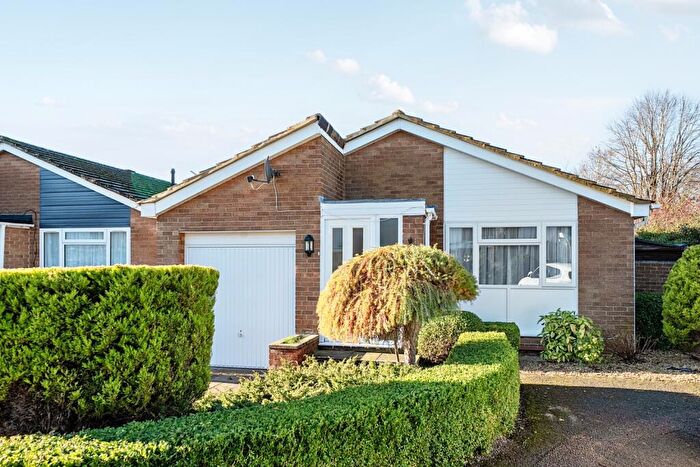
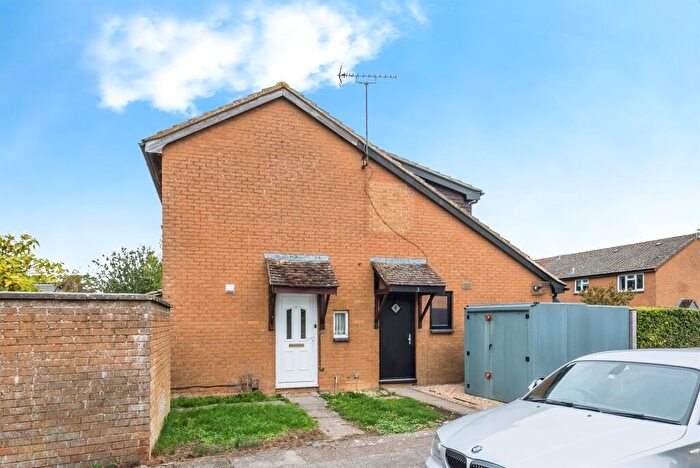
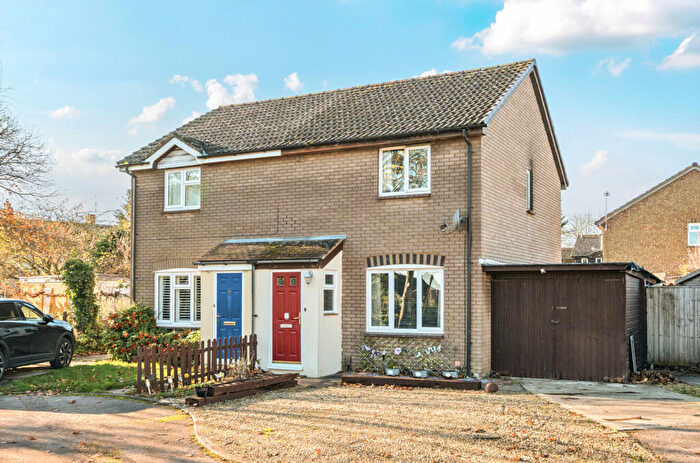
Houses for sale & to rent in Carterton South, Carterton
House Prices in Carterton South
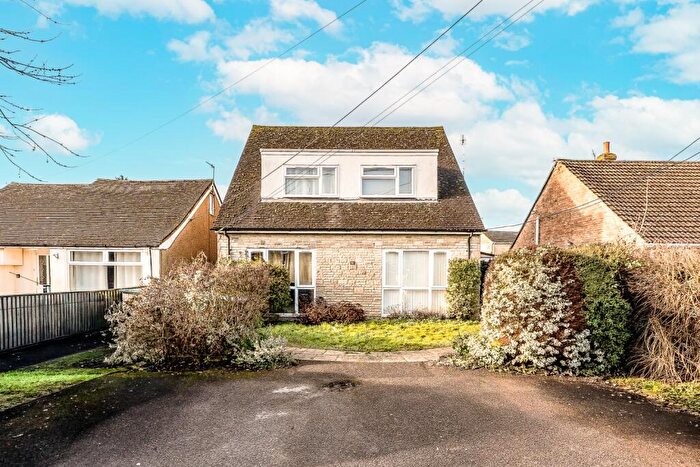
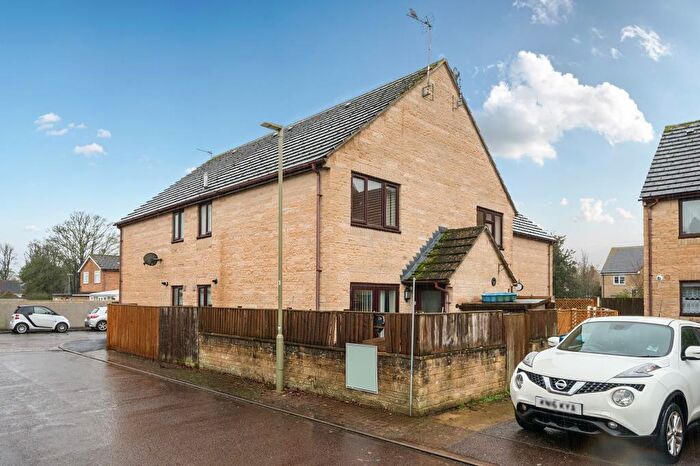
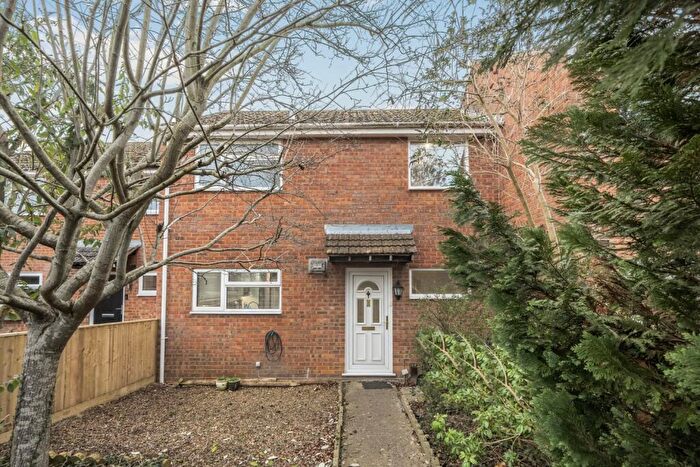
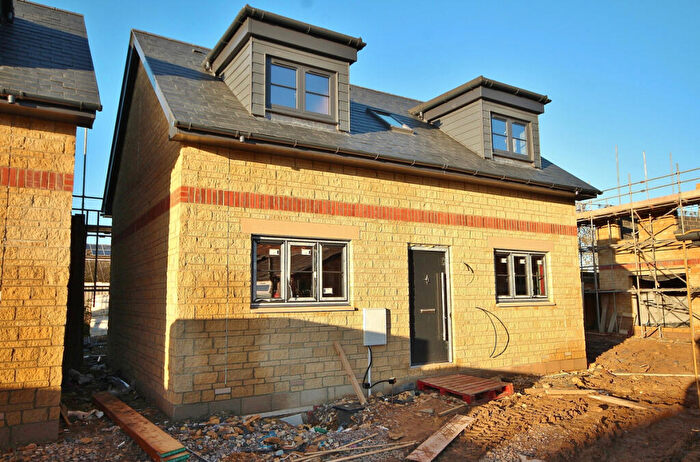
Properties in Carterton South have an average house price of £345,931.00 and had 141 Property Transactions within the last 3 years¹.
Carterton South is an area in Carterton, Oxfordshire with 1,613 households², where the most expensive property was sold for £900,000.00.
Properties for sale in Carterton South
Roads and Postcodes in Carterton South
Navigate through our locations to find the location of your next house in Carterton South, Carterton for sale or to rent.
| Streets | Postcodes |
|---|---|
| Acacia Close | OX18 3DB |
| Alderley Close | OX18 3QP |
| Alvescot Road | OX18 3JN OX18 3JP OX18 3JW OX18 3DW OX18 3JL |
| Arlington Close | OX18 3HH |
| Ashfield Road | OX18 3QY OX18 3QZ OX18 3RA OX18 3RD |
| Belfast Square | OX18 3TA |
| Belle Terrace | OX18 3ER |
| Birchwood | OX18 3JT |
| Black Bourton Road | OX18 3DJ OX18 3HD OX18 3HF OX18 3HJ OX18 3HQ OX18 3DN OX18 3HA OX18 3HE |
| Brampton Drive | OX18 3SA |
| Brize Norton Road | OX18 3JD OX18 3JF |
| Buckingham Place | OX18 3RQ |
| Butlers Drive | OX18 3QU OX18 3QX OX18 3FQ |
| Campion Close | OX18 3YG |
| Carterton Industrial Estate | OX18 3EZ |
| Carterton Mobile Home Park | OX18 3FU OX18 3FW OX18 3RT |
| Chandler Mews | OX18 3LF |
| Charles Road | OX18 3TE |
| Chelford Court | OX18 3JB |
| Clare Terrace | OX18 3ES |
| Clarkston Road | OX18 3SP |
| Corbett Road | OX18 3LD OX18 3LE OX18 3LG |
| Cranwell Avenue | OX18 3SB |
| Davis Close | OX18 3SX |
| Ellamy Drive | OX18 3TB |
| Foxcroft Drive | OX18 3HT |
| Halton Road | OX18 3SD |
| Hammett Place | OX18 3JR |
| Hawthorn Grove | OX18 3QT |
| Hayward Drive | OX18 3HX |
| Herrick Road | OX18 3FF |
| Hollybush Road | OX18 3JS |
| Jackson Close | OX18 3HY |
| Kingham Drive | OX18 3HU |
| Lancaster Place | OX18 3ET |
| Larksfield Close | OX18 3SY |
| Latimer Road | OX18 3SE |
| Magdalen Place | OX18 3EP |
| Mansell Place | OX18 3RX |
| Marlborough Close | OX18 3RW |
| Mayfield Close | OX18 3QR OX18 3QS |
| Milestone Road | OX18 3RE OX18 3RF OX18 3RG OX18 3RH OX18 3RJ OX18 3RL OX18 3RN |
| Netheravon Close | OX18 3SF |
| New Look Mobile Home Park | OX18 3RR |
| Oakfield Road | OX18 3QN OX18 3QW OX18 3RB OX18 3SN OX18 3SW |
| Pampas Close | OX18 3YE |
| Queens Close | OX18 3XF |
| Queens Road | OX18 3XG OX18 3XH OX18 3XN OX18 3XQ OX18 3XW OX18 3XY OX18 3YB OX18 3YD OX18 3YF OX18 3YQ |
| Sarum Close | OX18 3SU |
| The Crescent | OX18 3SG OX18 3SH OX18 3SJ OX18 3SQ |
| The Giles Centre | OX18 3DH |
| The Larches | OX18 3GH |
| The Maples | OX18 3HB |
| Valiant Court | OX18 3FG |
| Watsons Close | OX18 3RP |
| West Oxfordshire Business Park | OX18 3TD |
| Whittington Place | OX18 3QL |
| Wycombe Way | OX18 3XL OX18 3SZ OX18 3TT |
| OX18 1XZ OX18 3TJ OX18 3WJ OX18 4XU OX18 4YR OX18 9AW OX18 9BN OX18 9BW OX18 9DF OX18 9DH OX18 9DJ OX18 9DL OX18 9DP OX18 9DU OX18 9DX OX18 9EA OX18 9EB OX18 9EE |
Transport near Carterton South
- FAQ
- Price Paid By Year
- Property Type Price
Frequently asked questions about Carterton South
What is the average price for a property for sale in Carterton South?
The average price for a property for sale in Carterton South is £345,931. This amount is 6% higher than the average price in Carterton. There are 849 property listings for sale in Carterton South.
What streets have the most expensive properties for sale in Carterton South?
The streets with the most expensive properties for sale in Carterton South are Corbett Road at an average of £546,000, The Maples at an average of £476,250 and Milestone Road at an average of £466,111.
What streets have the most affordable properties for sale in Carterton South?
The streets with the most affordable properties for sale in Carterton South are Arlington Close at an average of £166,476, The Larches at an average of £177,750 and Valiant Court at an average of £180,000.
Which train stations are available in or near Carterton South?
Some of the train stations available in or near Carterton South are Shipton, Ascott-Under-Wychwood and Finstock.
Property Price Paid in Carterton South by Year
The average sold property price by year was:
| Year | Average Sold Price | Price Change |
Sold Properties
|
|---|---|---|---|
| 2025 | £371,557 | 11% |
58 Properties |
| 2024 | £331,448 | 3% |
49 Properties |
| 2023 | £323,086 | 3% |
34 Properties |
| 2022 | £312,323 | 11% |
32 Properties |
| 2021 | £277,271 | -2% |
57 Properties |
| 2020 | £282,450 | 4% |
30 Properties |
| 2019 | £272,357 | -16% |
42 Properties |
| 2018 | £314,978 | 14% |
46 Properties |
| 2017 | £271,401 | 5% |
51 Properties |
| 2016 | £257,365 | 18% |
49 Properties |
| 2015 | £212,066 | -8% |
73 Properties |
| 2014 | £229,366 | 14% |
44 Properties |
| 2013 | £196,269 | -5% |
43 Properties |
| 2012 | £205,655 | -4% |
38 Properties |
| 2011 | £214,658 | 9% |
36 Properties |
| 2010 | £195,694 | 12% |
35 Properties |
| 2009 | £171,381 | -16% |
43 Properties |
| 2008 | £198,896 | -2% |
34 Properties |
| 2007 | £203,468 | 4% |
72 Properties |
| 2006 | £194,834 | 10% |
70 Properties |
| 2005 | £175,242 | 3% |
47 Properties |
| 2004 | £170,068 | 10% |
73 Properties |
| 2003 | £153,785 | 9% |
75 Properties |
| 2002 | £139,483 | 11% |
92 Properties |
| 2001 | £124,808 | 6% |
98 Properties |
| 2000 | £116,922 | 13% |
79 Properties |
| 1999 | £101,775 | 17% |
90 Properties |
| 1998 | £84,795 | 10% |
81 Properties |
| 1997 | £76,604 | 10% |
85 Properties |
| 1996 | £68,767 | 7% |
100 Properties |
| 1995 | £63,894 | - |
77 Properties |
Property Price per Property Type in Carterton South
Here you can find historic sold price data in order to help with your property search.
The average Property Paid Price for specific property types in the last three years are:
| Property Type | Average Sold Price | Sold Properties |
|---|---|---|
| Semi Detached House | £321,824.00 | 39 Semi Detached Houses |
| Detached House | £430,051.00 | 62 Detached Houses |
| Terraced House | £274,517.00 | 24 Terraced Houses |
| Flat | £185,843.00 | 16 Flats |

