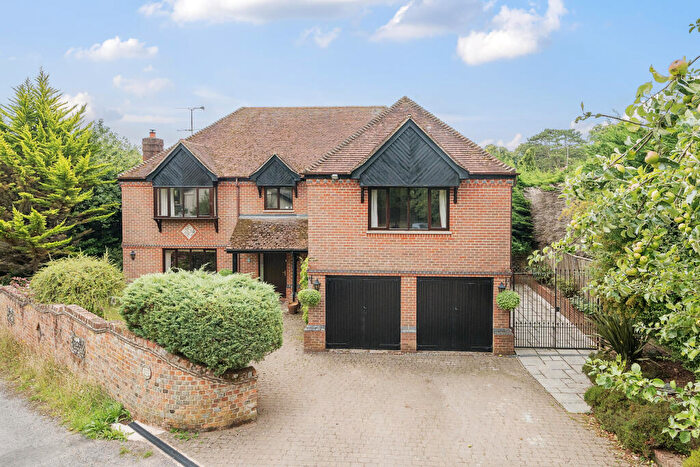
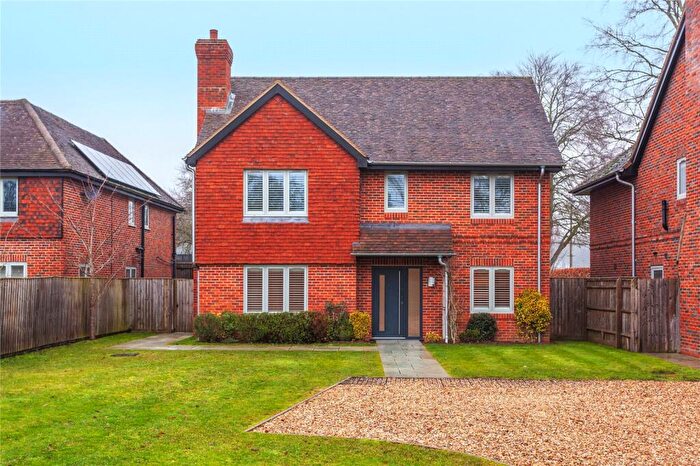
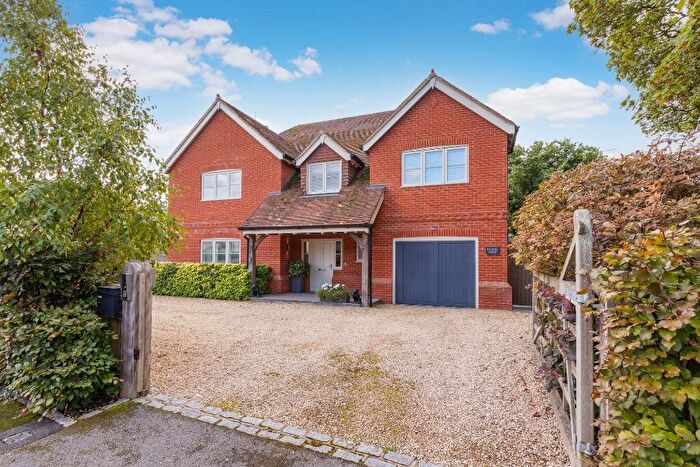
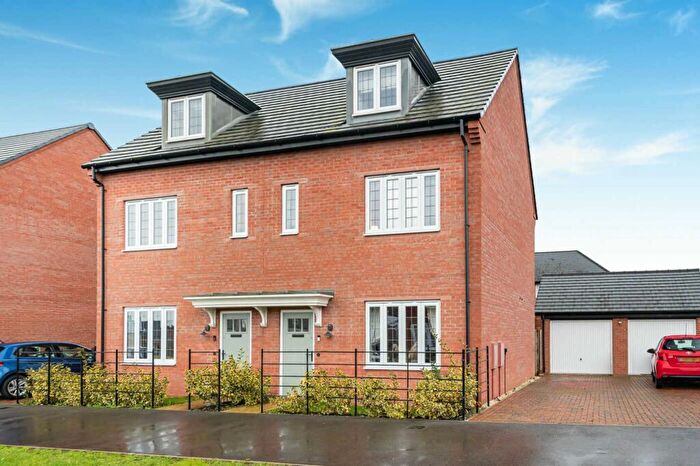
Houses for sale & to rent in Watlington, Henley-on-thames
House Prices in Watlington
Properties in Watlington have an average house price of £977,755.00 and had 37 Property Transactions within the last 3 years¹.
Watlington is an area in Henley-on-thames, Oxfordshire with 498 households², where the most expensive property was sold for £3,200,000.00.
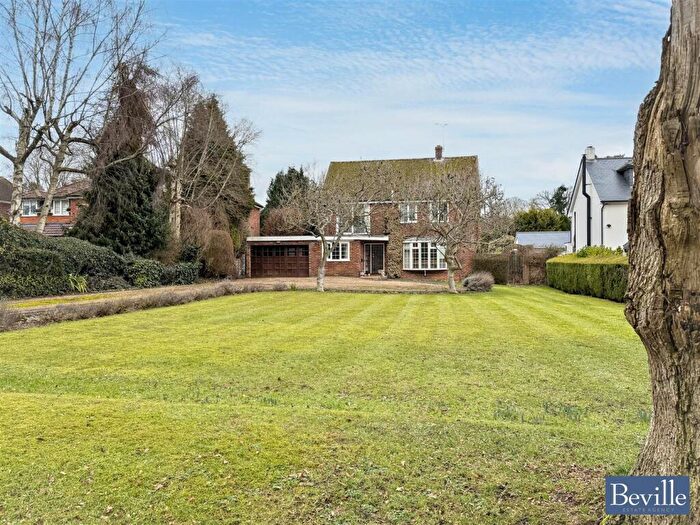
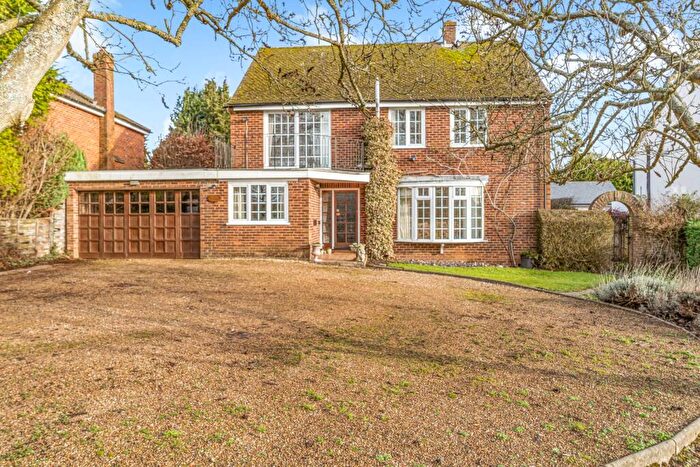
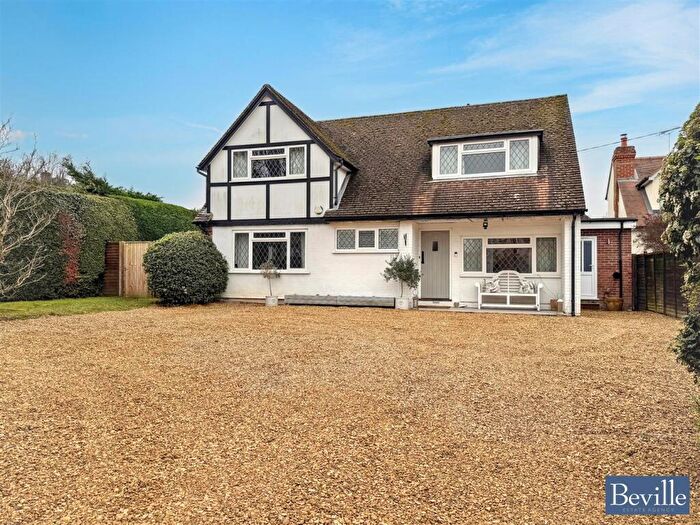
Properties for sale in Watlington
Roads and Postcodes in Watlington
Navigate through our locations to find the location of your next house in Watlington, Henley-on-thames for sale or to rent.
| Streets | Postcodes |
|---|---|
| Catslip | RG9 5BL RG9 5BN RG9 5BP |
| Chapel Lane | RG9 5AW |
| Coates Lane | RG9 6EE |
| Crocker End | RG9 5BJ |
| High Street | RG9 5DA RG9 5DD |
| Lane Cottages | RG9 6EP |
| Maidensgrove | RG9 6EX RG9 6EZ RG9 6HA RG9 6HN RG9 6EY |
| Mill Road | RG9 5AU |
| Old School Green | RG9 5AY |
| Park Corner | RG9 6DR RG9 6DS RG9 6DT RG9 6DX RG9 6DU RG9 6DY RG9 6DZ |
| Pearces Meadow | RG9 5AF |
| Pishill | RG9 6HH RG9 6HJ |
| Pishill Bank | RG9 6HR |
| Port Hill | RG9 5RL |
| Pot Kiln Lane | RG9 5BD |
| Pottery Fields | RG9 5AZ |
| Priest Close | RG9 5AS RG9 5AT |
| Priest Hill | RG9 5AP RG9 5AR |
| The Green | RG9 5AX |
| The Old Kiln | RG9 5BA |
| The Old Road | RG9 6HS |
| The Ridgeway | RG9 5AN |
| Wanbourne Lane | RG9 5AH |
| Watlington Street | RG9 5AA |
| RG9 5BE RG9 5BG RG9 6DP RG9 6EN RG9 6ER RG9 6ES RG9 6ET RG9 6EU RG9 6HB RG9 6HE RG9 6HG RG9 6EA RG9 6EB RG9 6ED RG9 6EG RG9 6EJ RG9 6EL RG9 6EQ RG9 6EW RG9 6HD RG9 6HF RG9 6HL RG9 6HP RG9 6HQ RG9 6QT |
Transport near Watlington
-
Henley-On-Thames Station
-
Shiplake Station
-
Cholsey Station
-
Wargrave Station
-
Goring and Streatley Station
-
Tilehurst Station
-
Pangbourne Station
-
Saunderton Station
-
Reading Station
-
Reading West Station
- FAQ
- Price Paid By Year
- Property Type Price
Frequently asked questions about Watlington
What is the average price for a property for sale in Watlington?
The average price for a property for sale in Watlington is £977,755. This amount is 13% higher than the average price in Henley-on-thames. There are 1,027 property listings for sale in Watlington.
What streets have the most expensive properties for sale in Watlington?
The streets with the most expensive properties for sale in Watlington are Maidensgrove at an average of £2,185,000, Crocker End at an average of £2,125,000 and Pishill at an average of £1,700,000.
What streets have the most affordable properties for sale in Watlington?
The streets with the most affordable properties for sale in Watlington are Priest Close at an average of £433,333, Priest Hill at an average of £595,000 and Old School Green at an average of £610,000.
Which train stations are available in or near Watlington?
Some of the train stations available in or near Watlington are Henley-On-Thames, Shiplake and Cholsey.
Property Price Paid in Watlington by Year
The average sold property price by year was:
| Year | Average Sold Price | Price Change |
Sold Properties
|
|---|---|---|---|
| 2025 | £1,063,696 | 26% |
14 Properties |
| 2024 | £789,500 | -30% |
10 Properties |
| 2023 | £1,030,015 | 12% |
13 Properties |
| 2022 | £911,352 | -7% |
17 Properties |
| 2021 | £975,007 | -2% |
27 Properties |
| 2020 | £993,571 | 12% |
14 Properties |
| 2019 | £878,166 | -8% |
12 Properties |
| 2018 | £951,500 | 16% |
22 Properties |
| 2017 | £799,857 | -14% |
7 Properties |
| 2016 | £914,628 | 17% |
23 Properties |
| 2015 | £758,065 | 3% |
23 Properties |
| 2014 | £733,764 | 2% |
17 Properties |
| 2013 | £720,464 | 16% |
14 Properties |
| 2012 | £602,055 | -39% |
18 Properties |
| 2011 | £837,864 | -4% |
11 Properties |
| 2010 | £867,811 | 25% |
17 Properties |
| 2009 | £648,884 | 11% |
13 Properties |
| 2008 | £579,000 | 6% |
6 Properties |
| 2007 | £542,333 | 6% |
24 Properties |
| 2006 | £508,769 | 2% |
26 Properties |
| 2005 | £499,131 | 10% |
11 Properties |
| 2004 | £451,350 | -36% |
10 Properties |
| 2003 | £614,678 | 11% |
21 Properties |
| 2002 | £547,898 | 29% |
30 Properties |
| 2001 | £389,425 | -19% |
20 Properties |
| 2000 | £464,057 | 49% |
19 Properties |
| 1999 | £235,540 | -1% |
25 Properties |
| 1998 | £237,877 | 3% |
29 Properties |
| 1997 | £229,779 | -8% |
22 Properties |
| 1996 | £248,184 | 39% |
24 Properties |
| 1995 | £151,484 | - |
16 Properties |
Property Price per Property Type in Watlington
Here you can find historic sold price data in order to help with your property search.
The average Property Paid Price for specific property types in the last three years are:
| Property Type | Average Sold Price | Sold Properties |
|---|---|---|
| Semi Detached House | £579,166.00 | 12 Semi Detached Houses |
| Detached House | £1,331,944.00 | 19 Detached Houses |
| Terraced House | £653,333.00 | 6 Terraced Houses |

