
Houses for sale & to rent in Watlington, Thame
House Prices in Watlington
Properties in Watlington have an average house price of £528k and had 9 Property Transactions within the last 3 years¹.
Watlington is an area in Thame, Oxfordshire with 122 households², where the most expensive property was sold for £763k.
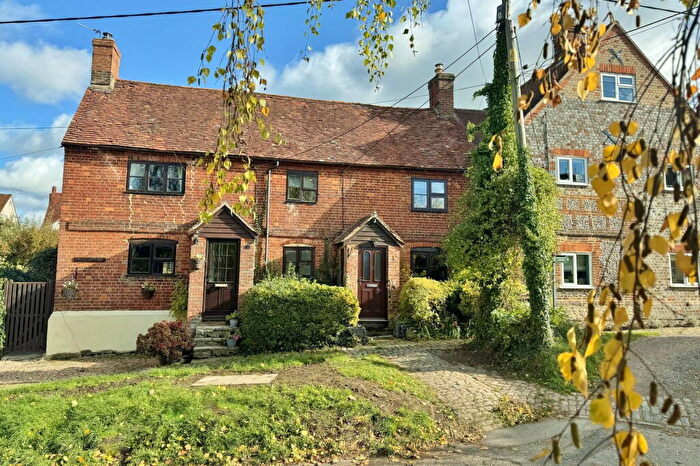
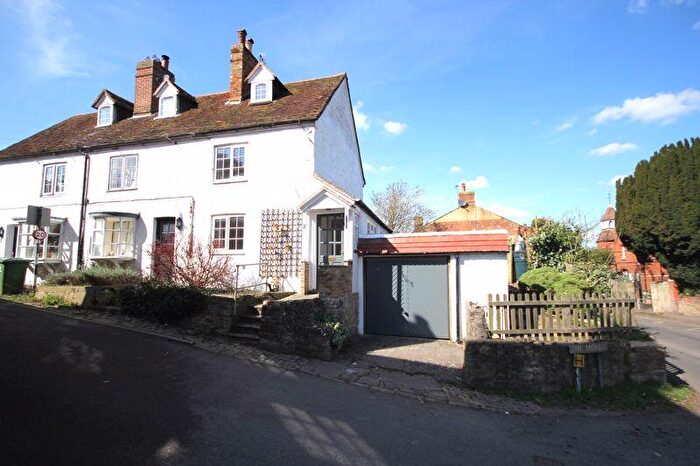
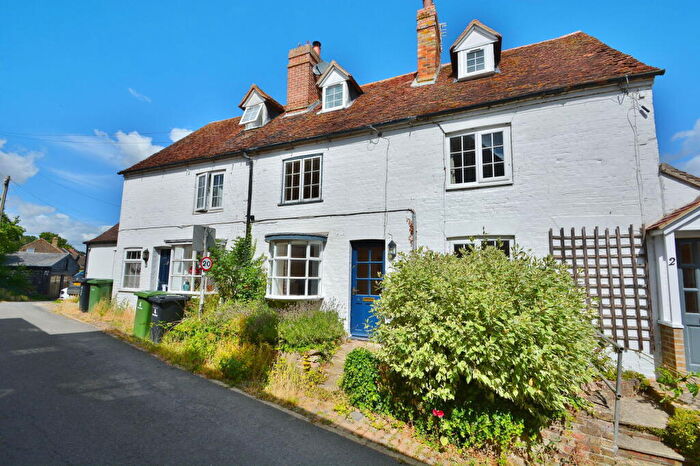
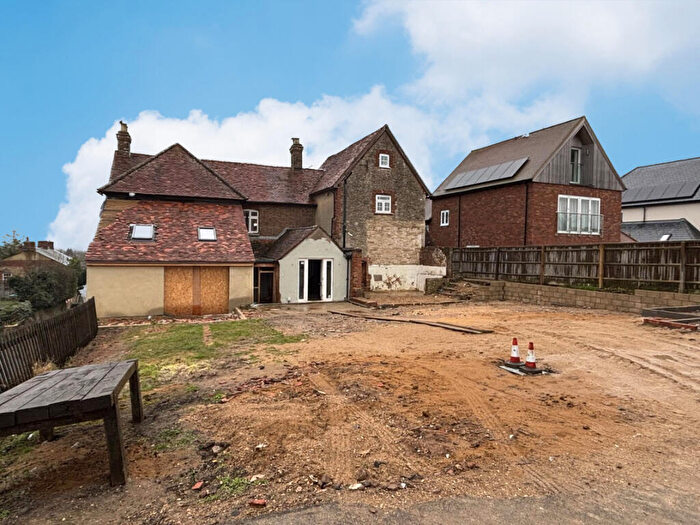
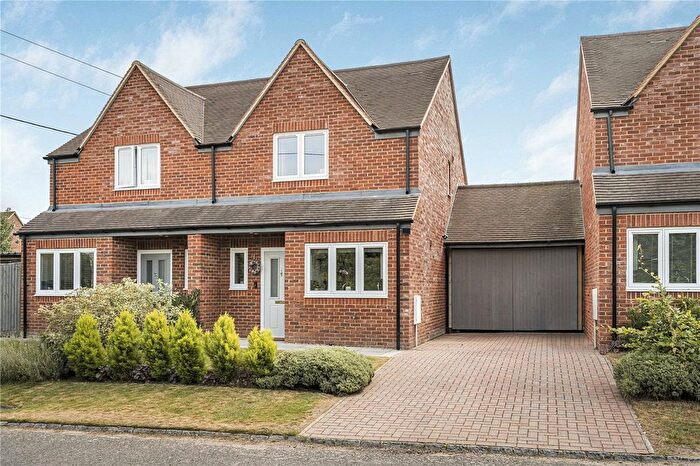
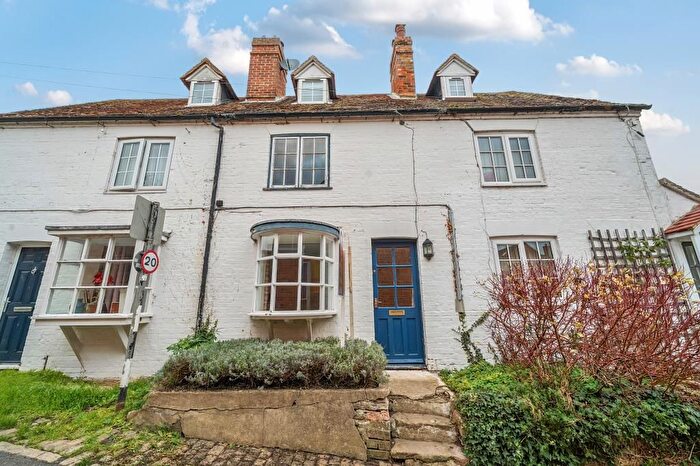
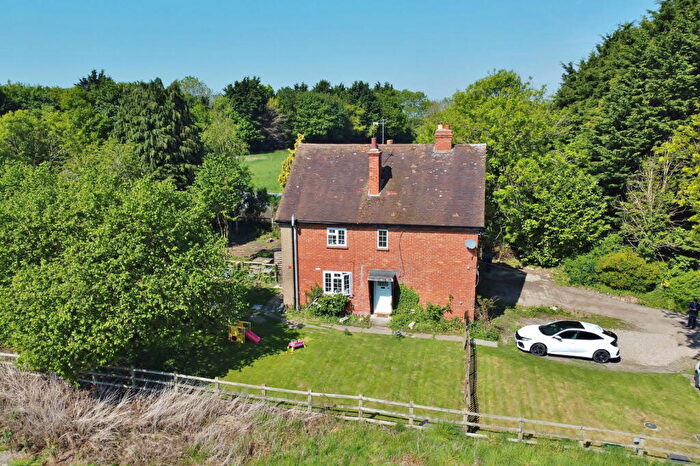
Properties for sale in Watlington
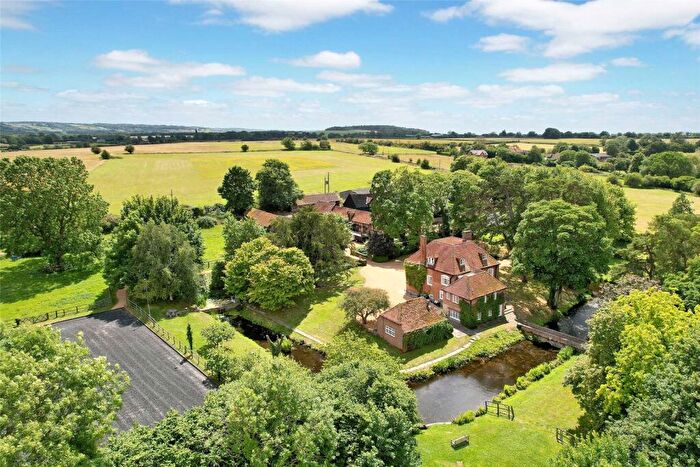
![]()
If you are looking to sell your house, let it out, or receive a property valuation, an expert can help you.
Click the button below to get started.
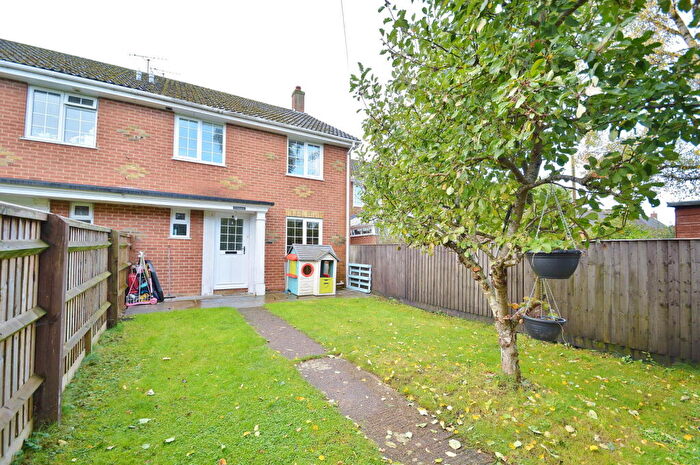
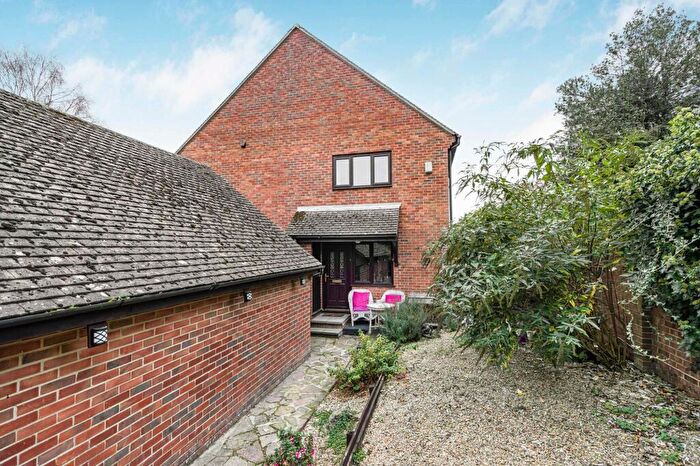
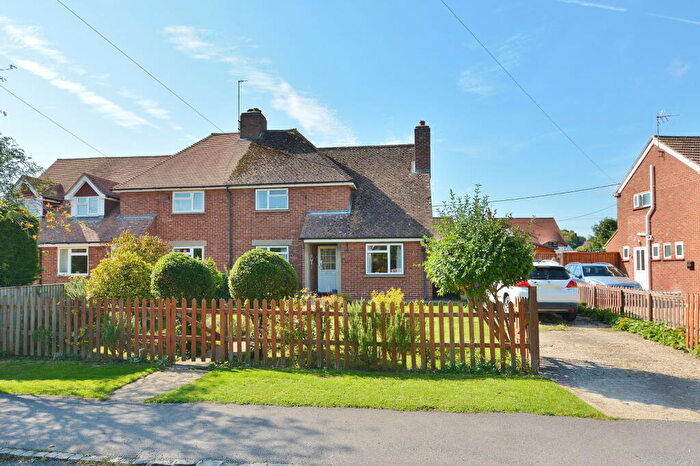
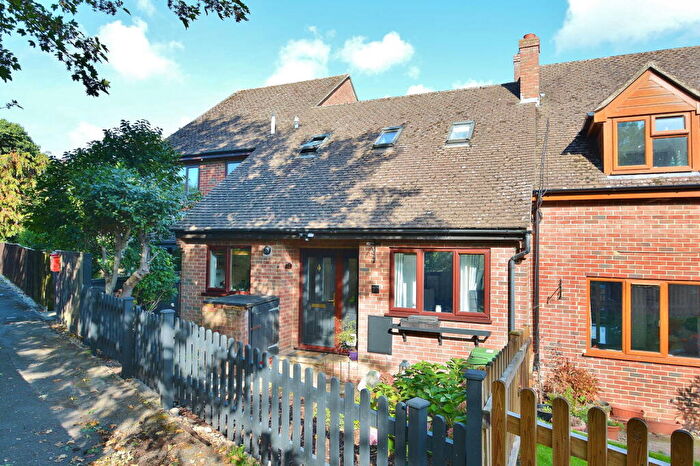
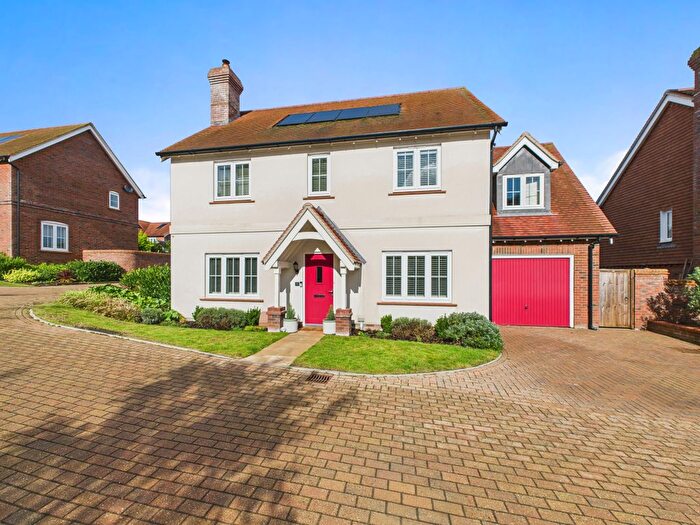
Previously listed properties in Watlington
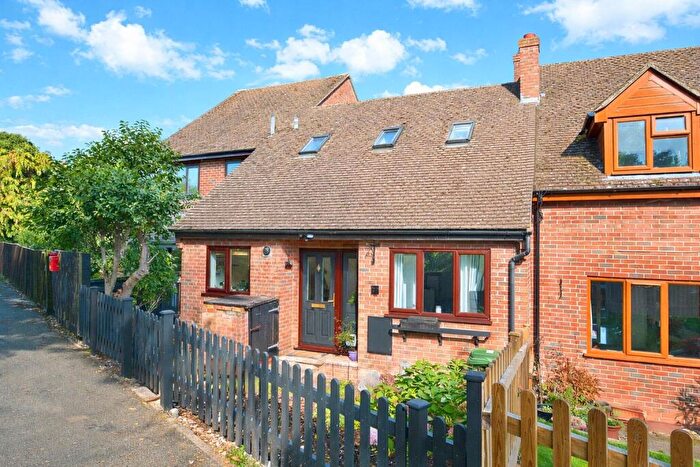
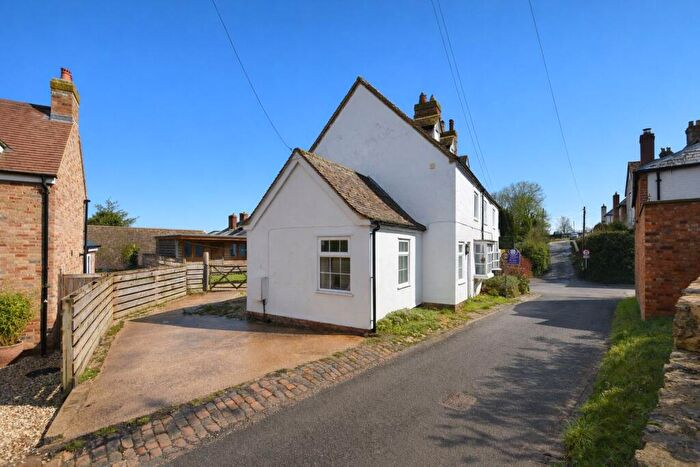
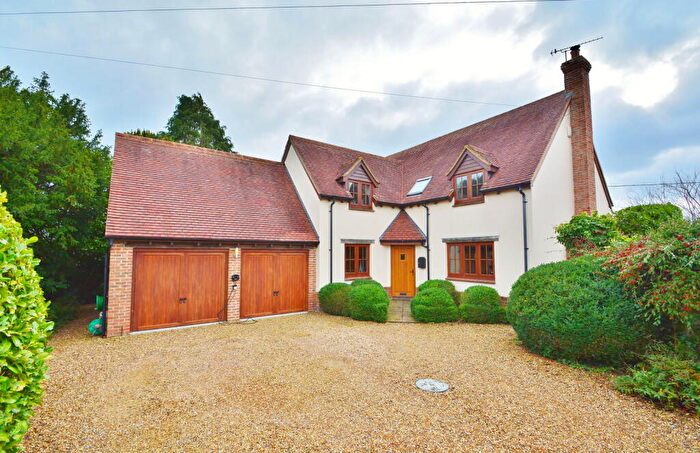
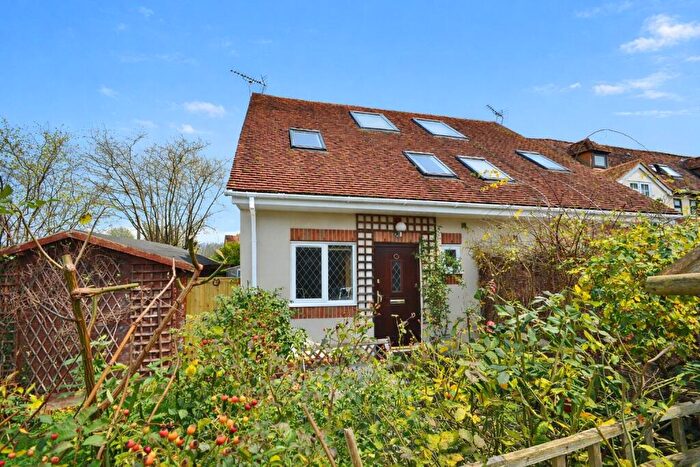
![]()
If you are looking to sell your house, let it out, or receive a property valuation, an expert can help you.
Click the button below to get started.
Roads and Postcodes in Watlington
Navigate through our locations to find the location of your next house in Watlington, Thame for sale or to rent.
| Streets | Postcodes |
|---|---|
| Box Tree Lane | OX9 7DR OX9 7DS OX9 7DT OX9 7DY |
| Gilton Cottages | OX9 7ET |
| London Road | OX9 7DL OX9 7DN OX9 7DP OX9 7ED |
| Lower Road | OX9 7DU |
| Poppetts Hill Cottages | OX9 7HA |
| Rectory Lane | OX9 7EQ |
| Salt Lane | OX9 7EE |
| Stoney Lane | OX9 7HG |
| OX9 7EJ OX9 7EL OX9 7ES OX9 7EU OX9 7EZ OX9 7EX OX9 7EY OX9 7HB OX9 7HE OX9 7HF OX9 7HQ |
Transport near Watlington
-
 Haddenham and Thame Parkway Station
 -
Princes Risborough Station
-
Saunderton Station
-
Monks Risborough Station
-
Little Kimble Station
- FAQ
- Price Paid By Year
- Property Type Price
Frequently asked questions about Watlington
What is the average price for a property for sale in Watlington?
The average price for a property for sale in Watlington is £528,111. This amount is 11% higher than the average price in Thame. There are 116 property listings for sale in Watlington.
What streets have the most expensive properties for sale in Watlington?
The street with the most expensive properties for sale in Watlington is Lower Road at an average of £666,500.
What streets have the most affordable properties for sale in Watlington?
The street with the most affordable properties for sale in Watlington is Salt Lane at an average of £513,333.
Which train stations are available in or near Watlington?
Some of the train stations available in or near Watlington are Haddenham and Thame Parkway, Princes Risborough and Saunderton.
Property Price Paid in Watlington by Year
The average sold property price by year was:
| Year | Average Sold Price | Price Change |
Sold Properties
|
|---|---|---|---|
| 2025 | £513,333 | -11% |
3 Properties |
| 2024 | £570,000 | 7% |
1 Property |
| 2023 | £528,600 | -29% |
5 Properties |
| 2022 | £684,000 | 12% |
5 Properties |
| 2021 | £601,810 | 30% |
5 Properties |
| 2020 | £424,208 | -6% |
12 Properties |
| 2019 | £451,000 | 33% |
2 Properties |
| 2018 | £302,500 | -147% |
1 Property |
| 2017 | £746,666 | 26% |
6 Properties |
| 2016 | £556,250 | 29% |
8 Properties |
| 2015 | £396,666 | 10% |
3 Properties |
| 2014 | £358,611 | -2% |
9 Properties |
| 2013 | £365,500 | -17% |
6 Properties |
| 2012 | £427,500 | -32% |
2 Properties |
| 2011 | £565,000 | 41% |
1 Property |
| 2010 | £333,333 | 25% |
3 Properties |
| 2008 | £250,000 | -79% |
1 Property |
| 2007 | £447,390 | 19% |
5 Properties |
| 2006 | £363,800 | 0,4% |
5 Properties |
| 2005 | £362,500 | -3% |
5 Properties |
| 2004 | £374,975 | 12% |
2 Properties |
| 2003 | £331,300 | -1% |
5 Properties |
| 2002 | £333,658 | 27% |
6 Properties |
| 2001 | £243,000 | -25% |
2 Properties |
| 2000 | £304,666 | 32% |
3 Properties |
| 1999 | £208,200 | 23% |
5 Properties |
| 1998 | £160,750 | 23% |
2 Properties |
| 1997 | £124,262 | -10% |
4 Properties |
| 1996 | £137,142 | 18% |
7 Properties |
| 1995 | £112,500 | - |
4 Properties |
Property Price per Property Type in Watlington
Here you can find historic sold price data in order to help with your property search.
The average Property Paid Price for specific property types in the last three years are:
| Property Type | Average Sold Price | Sold Properties |
|---|---|---|
| Semi Detached House | £454,000.00 | 5 Semi Detached Houses |
| Detached House | £620,750.00 | 4 Detached Houses |