Houses for sale & to rent in Greendown, Wantage
House Prices in Greendown
Properties in Greendown have an average house price of £452,619.00 and had 119 Property Transactions within the last 3 years¹.
Greendown is an area in Wantage, Oxfordshire with 793 households², where the most expensive property was sold for £2,500,000.00.
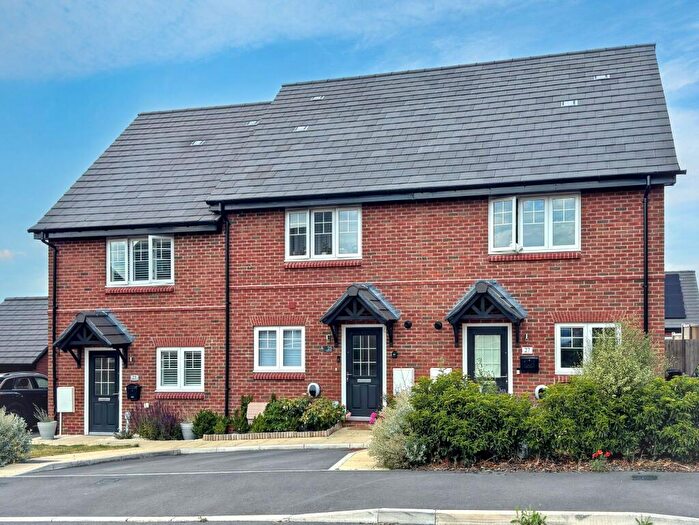
Properties for sale in Greendown
Roads and Postcodes in Greendown
Navigate through our locations to find the location of your next house in Greendown, Wantage for sale or to rent.
| Streets | Postcodes |
|---|---|
| Anvil Lane | OX12 9LA |
| Bakery Lane | OX12 9JN OX12 9JW |
| Bassett Road | OX12 9LJ |
| Canal Way | OX12 9SU |
| Castle Gardens | OX12 9RQ |
| Challow Road | OX12 9RL |
| Chapel Way | OX12 9UU |
| Childrey Way | OX12 9RX |
| Coppice Lane | OX12 9TJ |
| Court Road | OX12 9JH |
| Courthill Road | OX12 9JQ |
| Croft End | OX12 9JJ |
| Dog Lane | OX12 9UW |
| Faringdon Road | OX12 9TE OX12 9TH |
| Field Gardens | OX12 9SE |
| Filley Alley | OX12 9LT |
| Frouds Close | OX12 9NT |
| Hamlyn Close | OX12 9YX |
| Hedge Hill Road | OX12 9SD OX12 9SF |
| High Street | OX12 9UE OX12 9UN OX12 9UQ |
| High View | OX12 9RS |
| Hill Close | OX12 9RU |
| Holborn Hill | OX12 9LU |
| Ickleton Road | OX12 9JB |
| Kings Close | OX12 9JF |
| Knoll Close | OX12 9LS |
| Lawrence Close | OX12 9YR |
| Letcombe Hill | OX12 9RJ OX12 9RP OX12 9RW |
| Main Street | OX12 9SL OX12 9SR OX12 9SS OX12 9SW OX12 9TU |
| Manor Cottages | OX12 9JP |
| Manor Fields | OX12 9JG |
| Manor Road | OX12 8LT |
| Mill Paddock | OX12 9JE |
| New Road | OX12 9PG |
| Old School Lane | OX12 9SG |
| Orchard Gardens | OX12 9TL |
| Park Terrace | OX12 9SN |
| Parkside | OX12 9SJ |
| Pavilion Walk | OX12 9SQ |
| Post Office Lane | OX12 9JZ |
| Rectory Lane | OX12 9LN |
| Reynolds Way | OX12 9SB |
| Rowlands Cottages | OX12 9UA |
| Sarajac Avenue | OX12 9SA |
| Silver Lane | OX12 9TX |
| South Street | OX12 9JY OX12 9RG |
| St Nicholas Place | OX12 9SP |
| Stowhill | OX12 9XQ |
| The Glebe | OX12 9TW |
| The Green | OX12 9UG |
| The Park | OX12 9SH |
| Vicarage Hill | OX12 9RR |
| W & G Industrial Estate | OX12 9TF |
| Warborough Road | OX12 9LD OX12 9LE |
| West Street | OX12 9UH OX12 9UJ OX12 9UL |
| Windmill Place | OX12 9RT |
| OX12 0ED OX12 9JD OX12 9JL OX12 9JR OX12 9JS OX12 9LH OX12 9LL OX12 9LP OX12 9LR OX12 9PH OX12 9TN OX12 9UP OX12 9UT |
Transport near Greendown
-
Didcot Parkway Station
-
Appleford Station
-
Culham Station
-
Radley Station
-
Hungerford Station
-
Kintbury Station
-
Cholsey Station
-
Swindon Station
-
Newbury Station
-
Oxford Station
- FAQ
- Price Paid By Year
- Property Type Price
Frequently asked questions about Greendown
What is the average price for a property for sale in Greendown?
The average price for a property for sale in Greendown is £452,619. This amount is 12% higher than the average price in Wantage. There are 1,129 property listings for sale in Greendown.
What streets have the most expensive properties for sale in Greendown?
The streets with the most expensive properties for sale in Greendown are New Road at an average of £1,200,000, Stowhill at an average of £991,800 and Bassett Road at an average of £810,000.
What streets have the most affordable properties for sale in Greendown?
The streets with the most affordable properties for sale in Greendown are Chapel Way at an average of £270,000, Childrey Way at an average of £285,000 and South Street at an average of £319,105.
Which train stations are available in or near Greendown?
Some of the train stations available in or near Greendown are Didcot Parkway, Appleford and Culham.
Property Price Paid in Greendown by Year
The average sold property price by year was:
| Year | Average Sold Price | Price Change |
Sold Properties
|
|---|---|---|---|
| 2025 | £415,878 | -22% |
33 Properties |
| 2024 | £506,500 | 16% |
43 Properties |
| 2023 | £426,934 | -26% |
43 Properties |
| 2022 | £539,423 | 13% |
46 Properties |
| 2021 | £471,433 | -5% |
41 Properties |
| 2020 | £496,595 | 13% |
36 Properties |
| 2019 | £433,780 | -5% |
29 Properties |
| 2018 | £454,795 | -17% |
41 Properties |
| 2017 | £531,251 | 22% |
37 Properties |
| 2016 | £412,183 | -3% |
41 Properties |
| 2015 | £426,300 | 13% |
48 Properties |
| 2014 | £369,551 | -10% |
38 Properties |
| 2013 | £405,130 | -2% |
41 Properties |
| 2012 | £411,983 | 8% |
33 Properties |
| 2011 | £381,011 | -6% |
47 Properties |
| 2010 | £402,726 | 38% |
73 Properties |
| 2009 | £249,950 | -81% |
28 Properties |
| 2008 | £453,222 | 1% |
11 Properties |
| 2007 | £450,880 | 31% |
36 Properties |
| 2006 | £310,993 | 3% |
31 Properties |
| 2005 | £301,368 | 16% |
33 Properties |
| 2004 | £252,689 | -15% |
23 Properties |
| 2003 | £291,833 | -29% |
21 Properties |
| 2002 | £376,432 | 36% |
41 Properties |
| 2001 | £241,268 | 28% |
33 Properties |
| 2000 | £172,739 | -11% |
37 Properties |
| 1999 | £191,835 | 35% |
40 Properties |
| 1998 | £124,102 | -17% |
41 Properties |
| 1997 | £145,061 | 30% |
35 Properties |
| 1996 | £101,995 | -11% |
30 Properties |
| 1995 | £113,275 | - |
18 Properties |
Property Price per Property Type in Greendown
Here you can find historic sold price data in order to help with your property search.
The average Property Paid Price for specific property types in the last three years are:
| Property Type | Average Sold Price | Sold Properties |
|---|---|---|
| Semi Detached House | £385,769.00 | 34 Semi Detached Houses |
| Detached House | £790,480.00 | 25 Detached Houses |
| Terraced House | £366,571.00 | 7 Terraced Houses |
| Flat | £347,500.00 | 53 Flats |

