
Houses for sale in Hoober, Barnsley
House Prices in Hoober
Properties in Hoober have an average house price of £140k and had 65 Property Transactions within the last 3 years¹.
Hoober is an area in Barnsley, Rotherham with 1,038 households², where the most expensive property was sold for £825k.
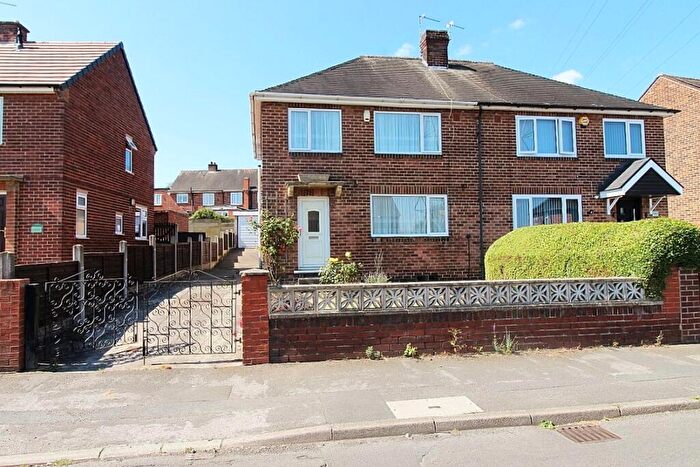
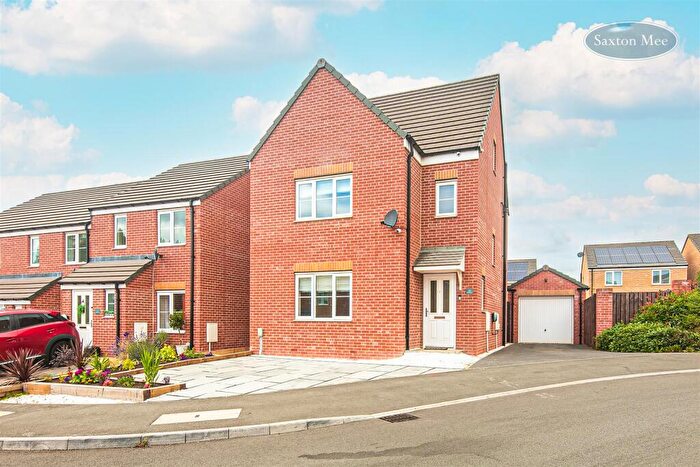
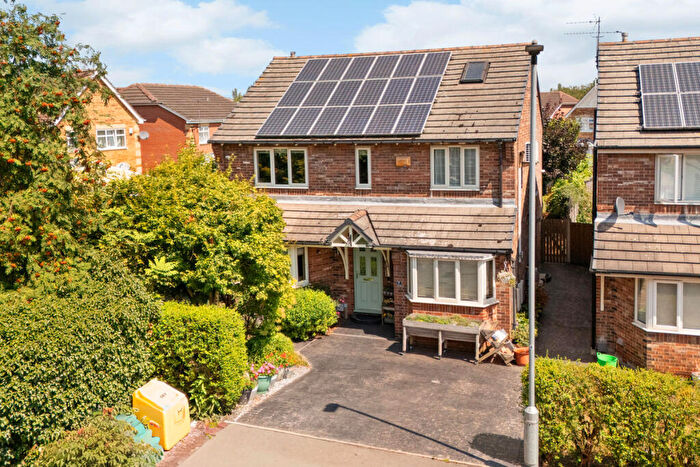
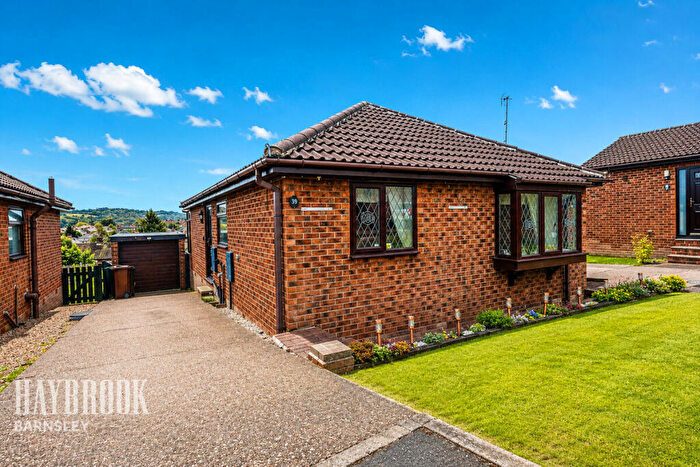
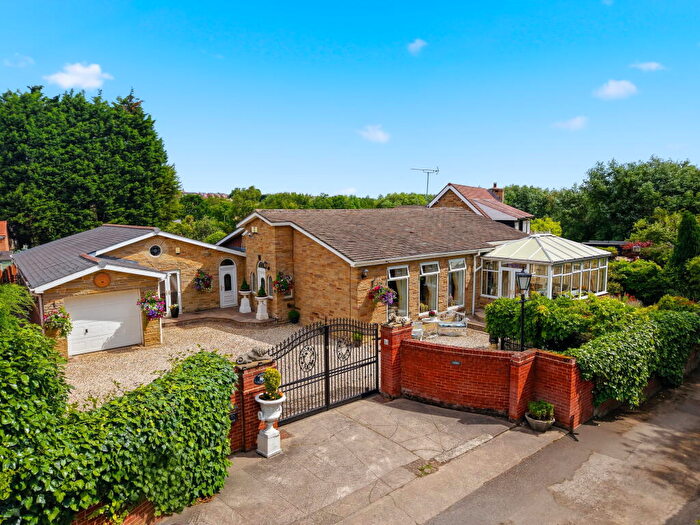
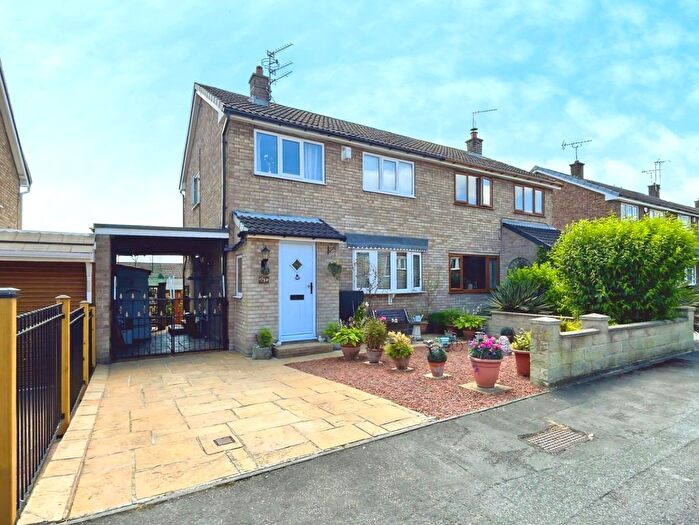
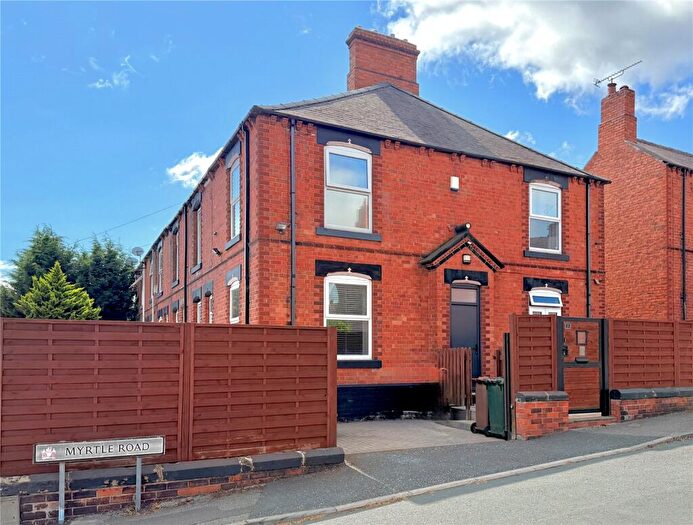
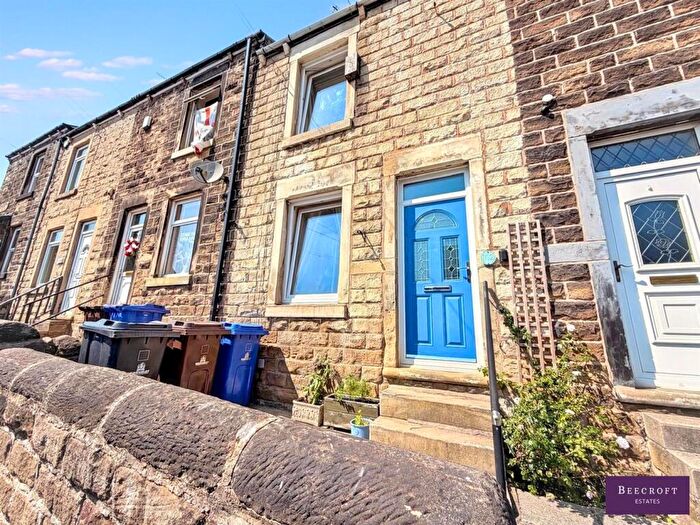
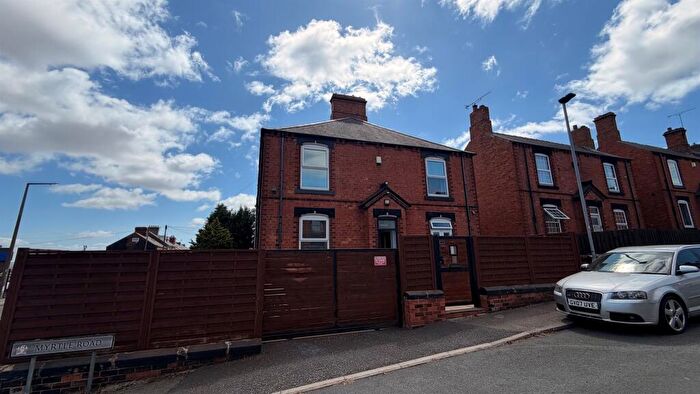
Properties for sale in Hoober
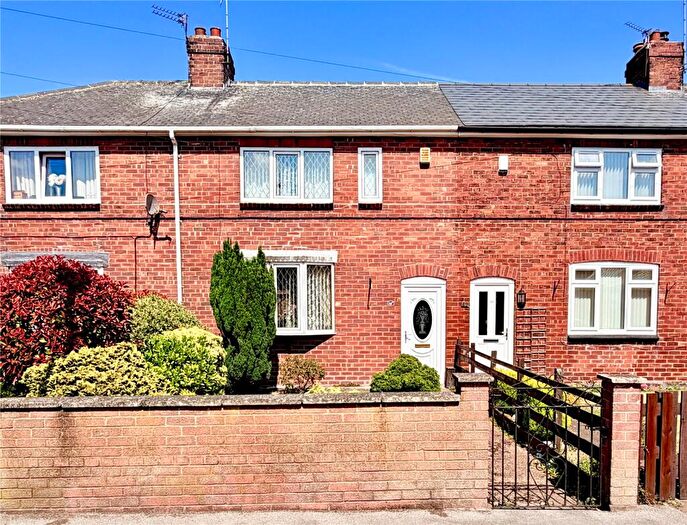
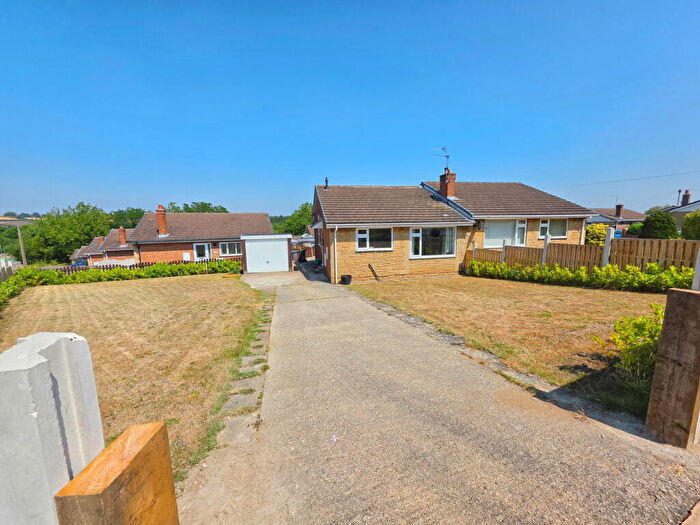
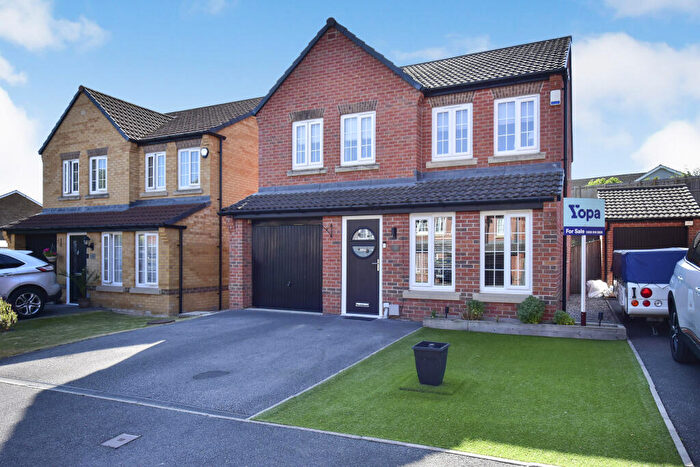
![]()
If you are looking to sell your house, let it out, or receive a property valuation, an expert can help you.
Click the button below to get started.
Roads and Postcodes in Hoober
Navigate through our locations to find the location of your next house in Hoober, Barnsley for sale or to rent.
| Streets | Postcodes |
|---|---|
| Becknoll Road | S73 0XL |
| Bierlow Close | S73 0TJ |
| Brampton Street | S73 0XR |
| Broad Carr Road | S74 9BU |
| Butterfield Court | S73 0UR |
| Chapel Avenue | S73 0XH S73 0XQ |
| Cliffe Road | S73 0XN S73 0XP S73 0XW |
| Corton Wood | S73 0TB |
| Cortonwood Drive | S73 0FA S73 0UF |
| Dearne Road | S73 0XA |
| Ellis Crescent | S73 0UG |
| Garden Drive | S73 0TG S73 0TN S73 0WF |
| Knollbeck Avenue | S73 0TH S73 0TS S73 0UB S73 0UH S73 0UL S73 0UQ |
| Knollbeck Crescent | S73 0TT |
| Knollbeck Lane | S73 0TF S73 0TP S73 0TR S73 0TU S73 0TW S73 0TX |
| Melton Avenue | S73 0XS |
| Melton Street | S73 0XT |
| Mission Field | S73 0XE |
| Moorbridge Crescent | S73 0XZ S73 0YA |
| Navigation Way | S73 0YD |
| Pontefract Road | S73 0XU S73 0XX S73 0XY |
| Rother Street | S73 0XJ |
| Royds Lane | S74 8AU |
| Sheffield Road | S74 0EF |
| Spring Drive | S73 0TQ |
| Springhill Avenue | S73 0TL |
| Wath Road | S73 0XB S73 0XD S73 0XF S73 0XG |
| Westfield Road | S73 0TY S73 0UA |
| Wyn Grove | S73 0UJ |
| Wynmoor Crescent | S73 0UD S73 0UE |
Property price trends in Hoober
According to the latest Land Registry data, the average home in Hoober sold for £103,000 in 2026. That figure comes from 752 sales logged over the past 31 years.
Prices have fallen back over the last three years. Compared with 2023, when the typical sale came in around £157,500, that's a fall of roughly 34.6%.
Looking back five years, average prices are down about 2.4% since 2021, a drop of around £2,479 in cash terms.
Zoom out to the past decade for the fuller picture. Back in 2016, homes here averaged £99,512, so the typical sold price has climbed about 3.5% since then, roughly 0.3% a year. Stretch the view to fifteen years and that annual pace edges up closer to 1.5%.
Frequently asked questions about Hoober
What is the average price for a property for sale in Hoober?
The average price for a property for sale in Hoober is £139,646. There are 3,709 property listings for sale in Hoober.
What streets have the most expensive properties for sale in Hoober?
The streets with the most expensive properties for sale in Hoober are Navigation Way at an average of £306,500, Wynmoor Crescent at an average of £163,500 and Westfield Road at an average of £158,000.
What streets have the most affordable properties for sale in Hoober?
The streets with the most affordable properties for sale in Hoober are Knollbeck Lane at an average of £85,000, Rother Street at an average of £92,300 and Becknoll Road at an average of £98,333.
Which train stations are available in or near Hoober?
Some of the train stations available in or near Hoober are Wombwell, Elsecar and Bolton-On-Dearne.
Property Price Paid in Hoober by Year
The average sold property price by year was:
| Year | Average Sold Price | Price Change |
Sold Properties
|
|---|---|---|---|
| 2026 | £103,000 | -33% |
1 Property |
| 2025 | £136,642 | 7% |
21 Properties |
| 2024 | £127,136 | -24% |
22 Properties |
| 2023 | £157,500 | 7% |
21 Properties |
| 2022 | £146,142 | 28% |
28 Properties |
| 2021 | £105,479 | 2% |
24 Properties |
| 2020 | £103,000 | 2% |
19 Properties |
| 2019 | £100,777 | 0,3% |
27 Properties |
| 2018 | £100,442 | 18% |
27 Properties |
| 2017 | £82,761 | -20% |
17 Properties |
Property Price per Property Type in Hoober
Here you can find historic sold price data in order to help with your property search.
The average Property Paid Price for specific property types in the last three years are:
| Property Type | Average Sold Price | Sold Properties |
|---|---|---|
| Semi Detached House | £132,655.00 | 45 Semi Detached Houses |
| Terraced House | £107,346.00 | 13 Terraced Houses |
| Flat | £89,400.00 | 5 Flats |
| Detached House | £632,500.00 | 2 Detached Houses |
