
Houses for sale & to rent in Silverwood, Mexborough
House Prices in Silverwood
Properties in Silverwood have an average house price of £126k and had 15 Property Transactions within the last 3 years¹.
Silverwood is an area in Mexborough, Rotherham with 241 households², where the most expensive property was sold for £243k.
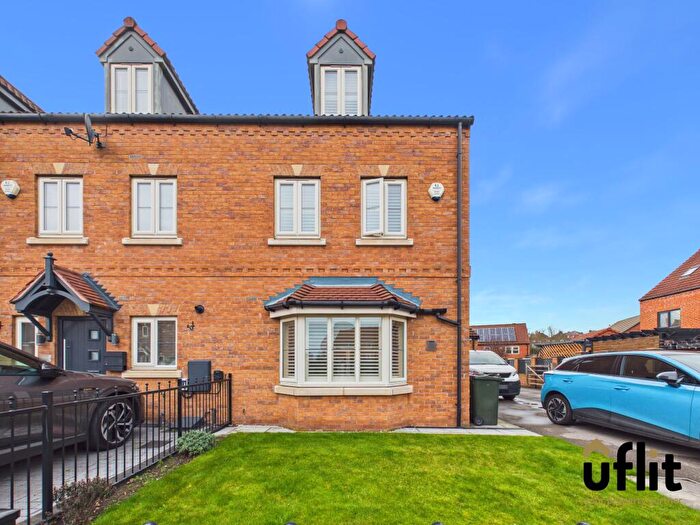
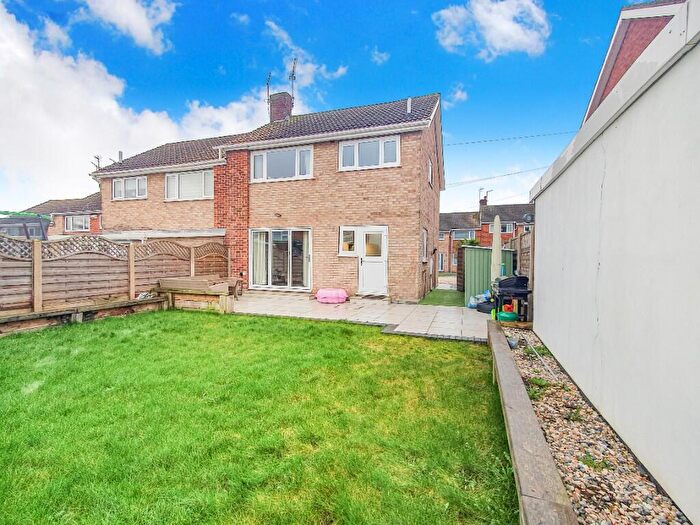
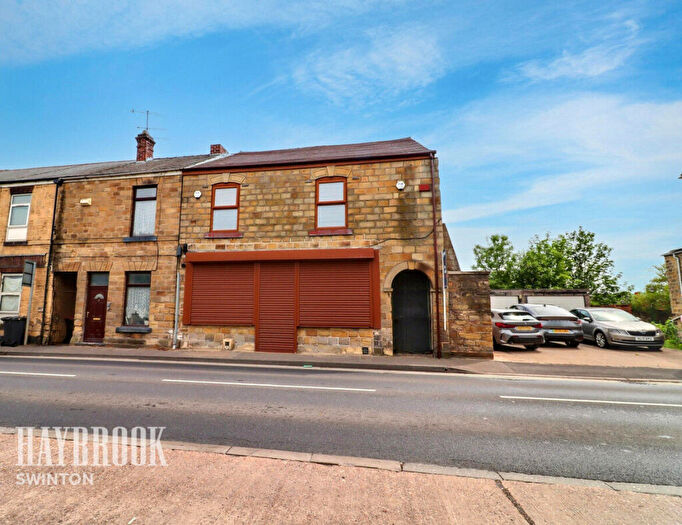
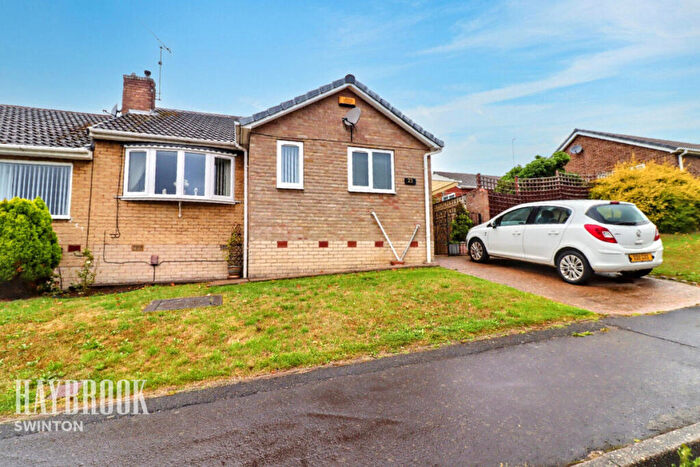
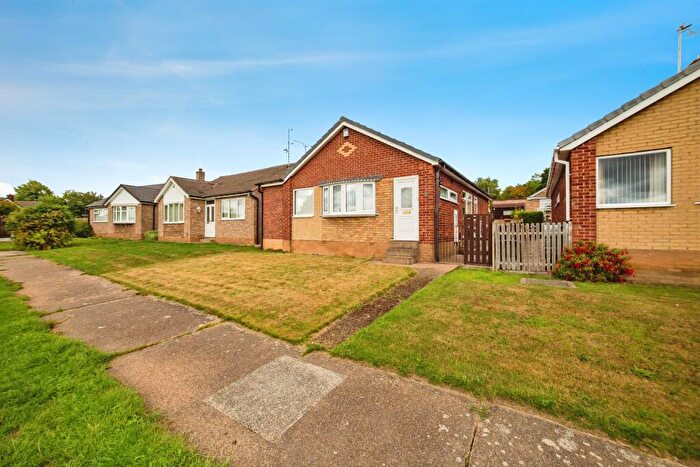
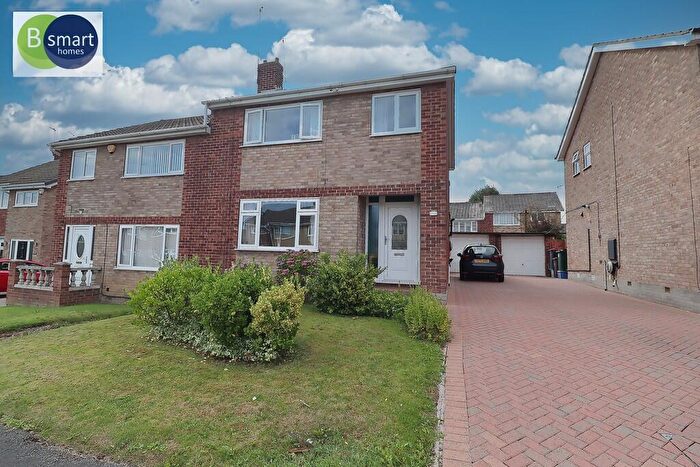
Properties for sale in Silverwood
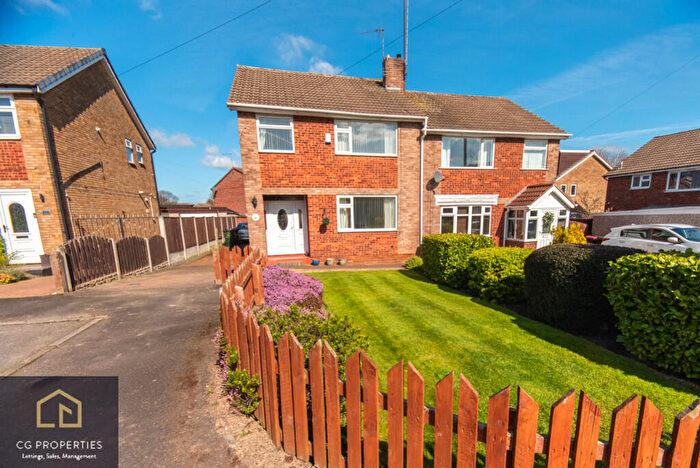

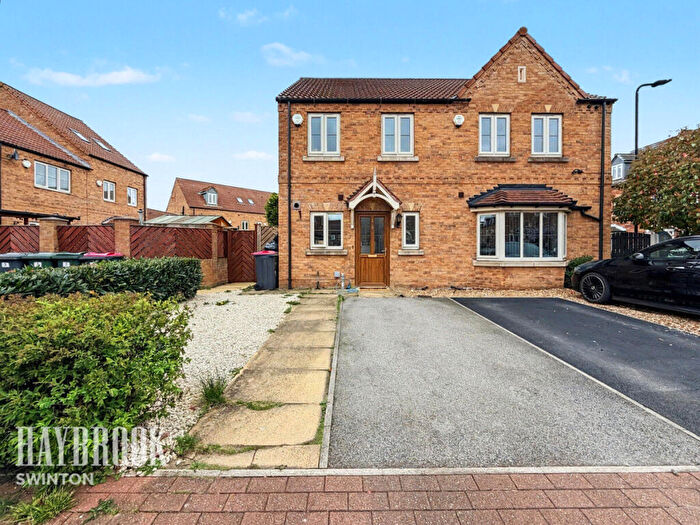
![]()
If you are looking to sell your house, let it out, or receive a property valuation, an expert can help you.
Click the button below to get started.


Previously listed properties in Silverwood
Roads and Postcodes in Silverwood
Navigate through our locations to find the location of your next house in Silverwood, Mexborough for sale or to rent.
| Streets | Postcodes |
|---|---|
| Beighton Road | S64 5SW |
| Glasshouse Road | S64 5TQ |
| Greenwood Road | S64 5SJ |
| Hooton Road | S64 5TA |
| Kilnhurst Road | S64 5TL |
| Russell Road | S64 5SH |
| Springfield Road | S64 5SN |
| Victoria Street | S64 5SQ |
| Wheatley Road | S64 5SL |
Transport near Silverwood
-
 Swinton (South Yorkshire) Station
 -
Mexborough Station
-
Conisbrough Station
-
Bolton-On-Dearne Station
-
Rotherham Central Station
-
Goldthorpe Station
- FAQ
- Price Paid By Year
- Property Type Price
Frequently asked questions about Silverwood
What is the average price for a property for sale in Silverwood?
The average price for a property for sale in Silverwood is £126,180. This amount is 27% lower than the average price in Mexborough. There are 488 property listings for sale in Silverwood.
What streets have the most expensive properties for sale in Silverwood?
The streets with the most expensive properties for sale in Silverwood are Beighton Road at an average of £147,500, Springfield Road at an average of £136,200 and Greenwood Road at an average of £117,000.
What streets have the most affordable properties for sale in Silverwood?
The streets with the most affordable properties for sale in Silverwood are Victoria Street at an average of £80,000, Glasshouse Road at an average of £109,250 and Wheatley Road at an average of £111,666.
Which train stations are available in or near Silverwood?
Some of the train stations available in or near Silverwood are Swinton (South Yorkshire), Mexborough and Conisbrough.
Property Price Paid in Silverwood by Year
The average sold property price by year was:
| Year | Average Sold Price | Price Change |
Sold Properties
|
|---|---|---|---|
| 2025 | £98,071 | -47% |
7 Properties |
| 2024 | £143,733 | -8% |
3 Properties |
| 2023 | £155,000 | -40% |
5 Properties |
| 2022 | £217,000 | 47% |
6 Properties |
| 2021 | £114,833 | -3% |
6 Properties |
| 2020 | £117,750 | 26% |
4 Properties |
| 2019 | £87,416 | 17% |
6 Properties |
| 2018 | £72,516 | 21% |
6 Properties |
| 2017 | £57,000 | -33% |
1 Property |
| 2016 | £75,583 | -30% |
3 Properties |
| 2015 | £98,200 | -0,2% |
5 Properties |
| 2014 | £98,375 | 19% |
4 Properties |
| 2013 | £80,000 | 10% |
1 Property |
| 2012 | £72,290 | -7% |
2 Properties |
| 2011 | £77,500 | -9% |
2 Properties |
| 2010 | £84,285 | 5% |
7 Properties |
| 2009 | £80,000 | -5% |
1 Property |
| 2008 | £84,000 | -11% |
2 Properties |
| 2007 | £93,000 | 4% |
3 Properties |
| 2006 | £89,100 | 13% |
5 Properties |
| 2005 | £77,900 | 3% |
5 Properties |
| 2004 | £75,200 | 37% |
12 Properties |
| 2003 | £47,690 | 26% |
5 Properties |
| 2002 | £35,237 | -44% |
4 Properties |
| 2001 | £50,833 | 40% |
3 Properties |
| 2000 | £30,750 | -20% |
4 Properties |
| 1999 | £37,000 | -45% |
4 Properties |
| 1998 | £53,475 | 53% |
2 Properties |
| 1997 | £25,000 | 41% |
1 Property |
| 1996 | £14,750 | -92% |
1 Property |
| 1995 | £28,300 | - |
5 Properties |
Property Price per Property Type in Silverwood
Here you can find historic sold price data in order to help with your property search.
The average Property Paid Price for specific property types in the last three years are:
| Property Type | Average Sold Price | Sold Properties |
|---|---|---|
| Semi Detached House | £122,290.00 | 11 Semi Detached Houses |
| Terraced House | £101,500.00 | 3 Terraced Houses |
| Detached House | £243,000.00 | 1 Detached House |