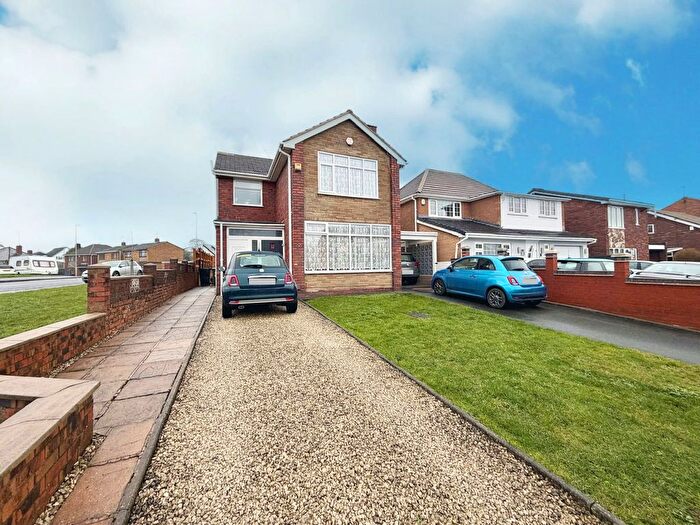
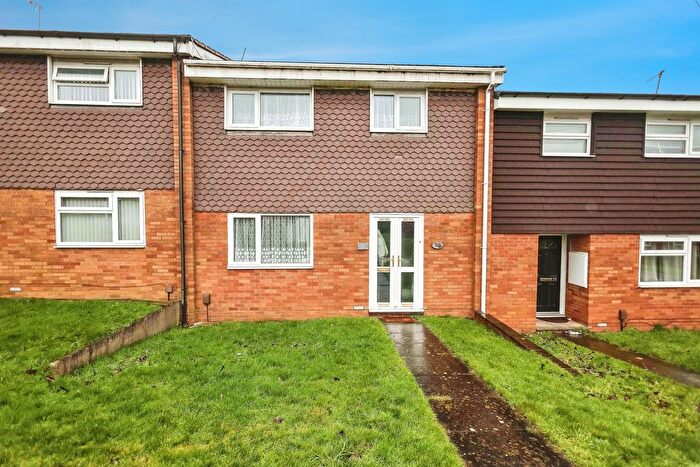
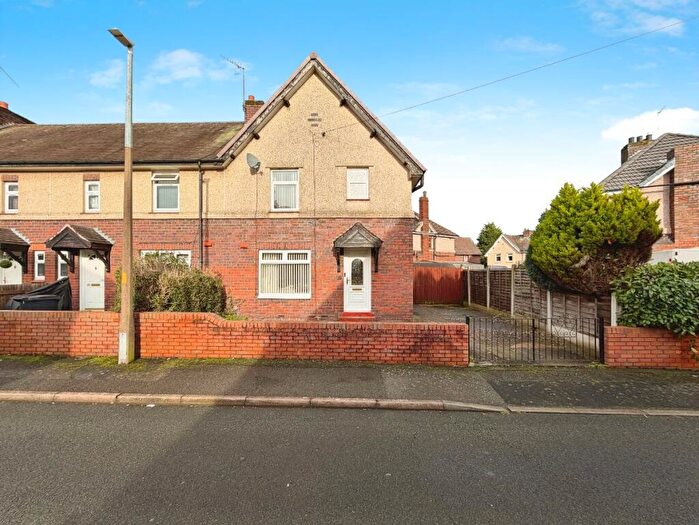
Houses for sale & to rent in Rowley, Cradley Heath
House Prices in Rowley
Properties in Rowley have an average house price of £200,925.00 and had 88 Property Transactions within the last 3 years¹.
Rowley is an area in Cradley Heath, Sandwell with 782 households², where the most expensive property was sold for £375,000.00.
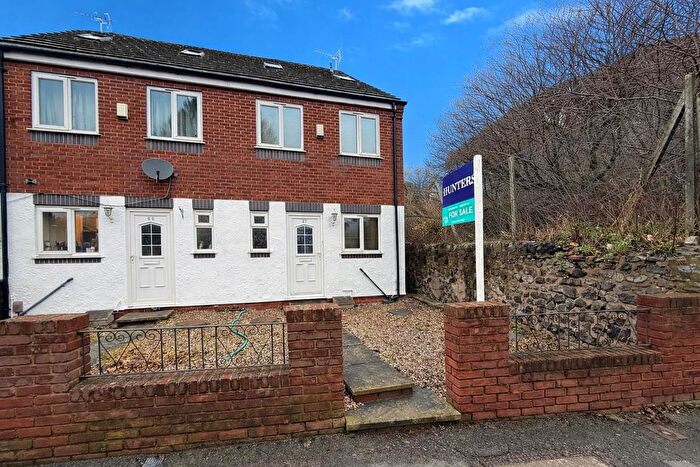
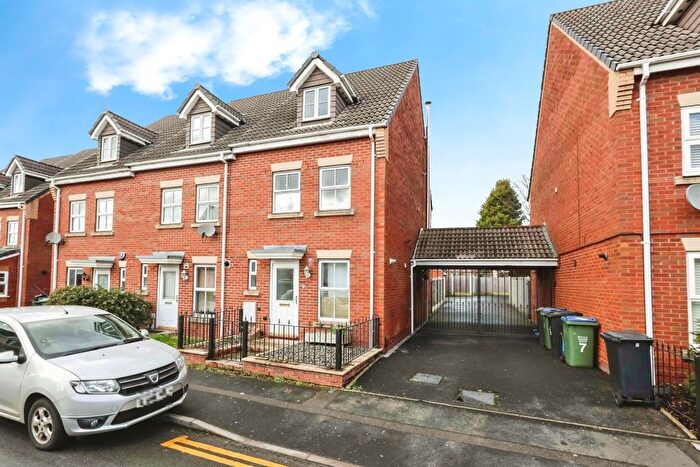
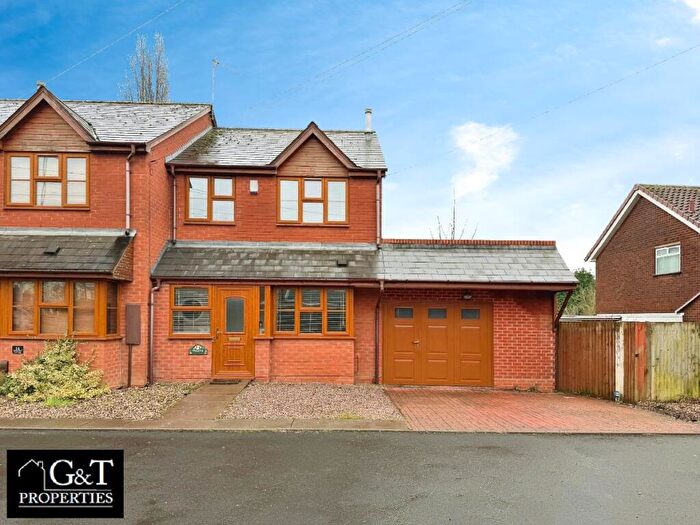
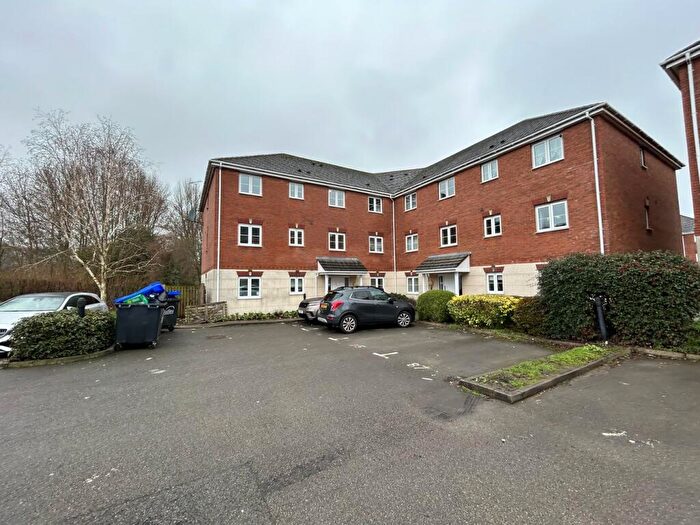
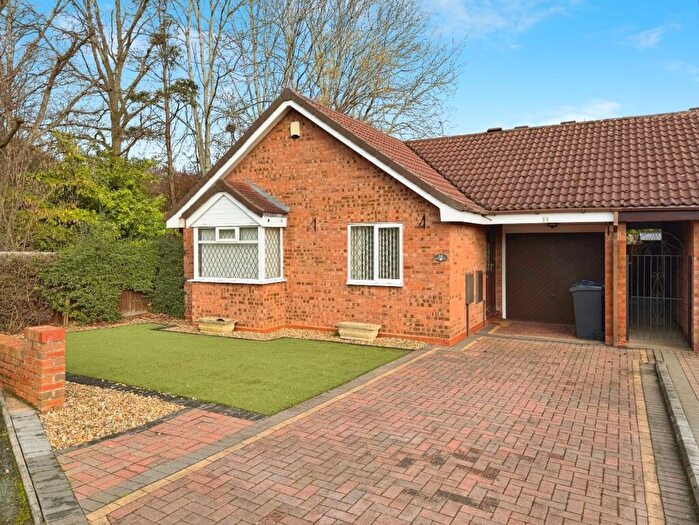
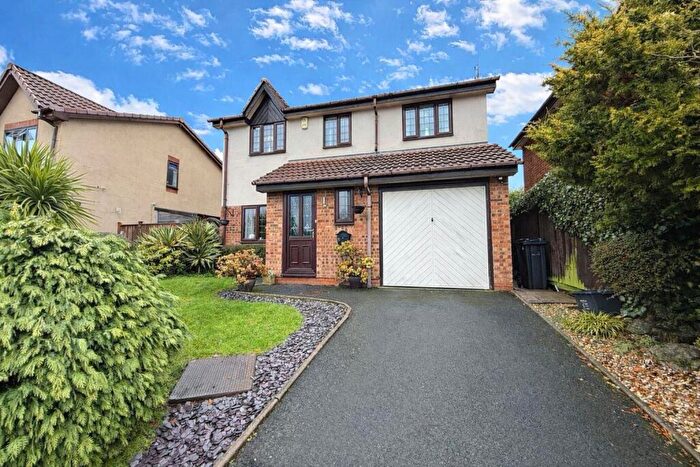
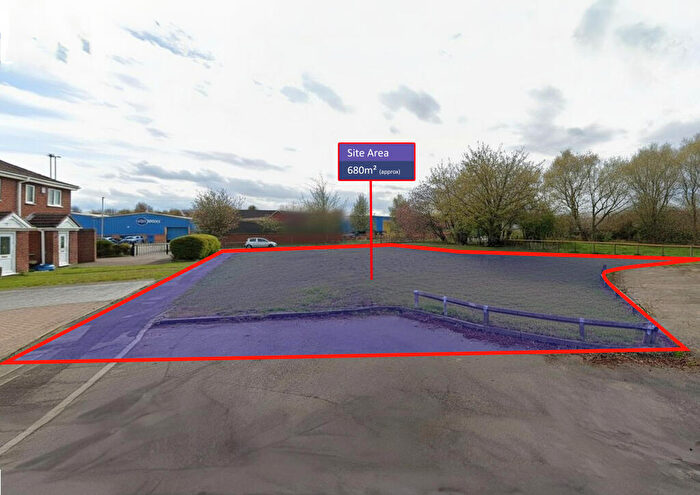
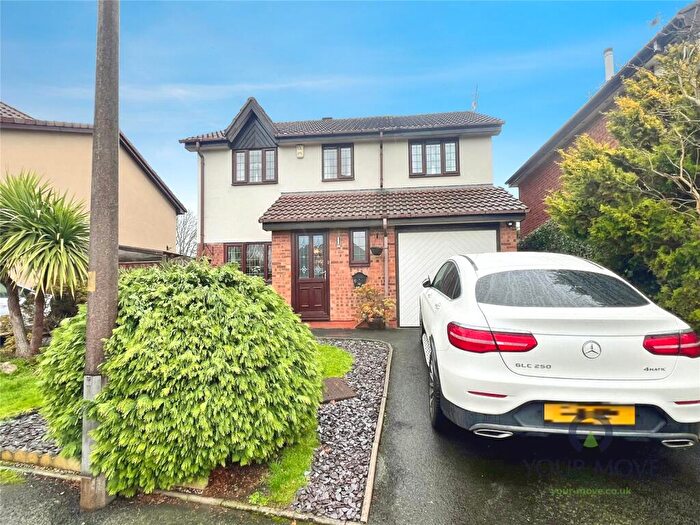
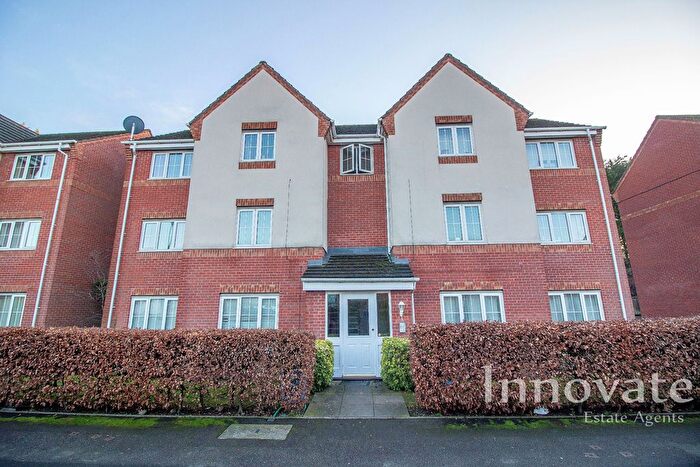
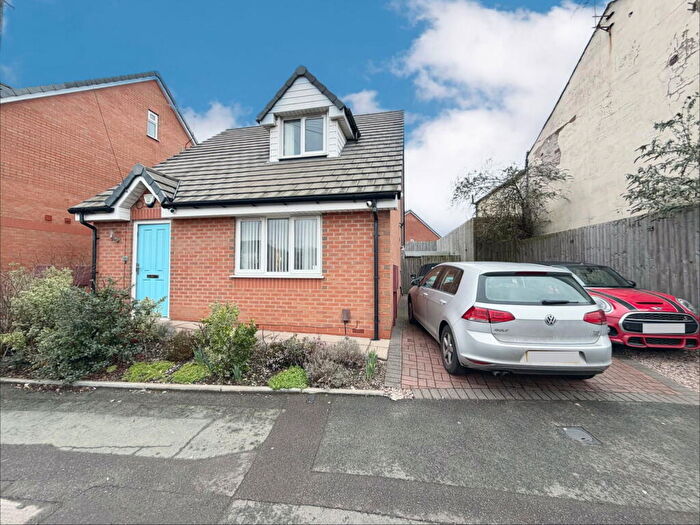
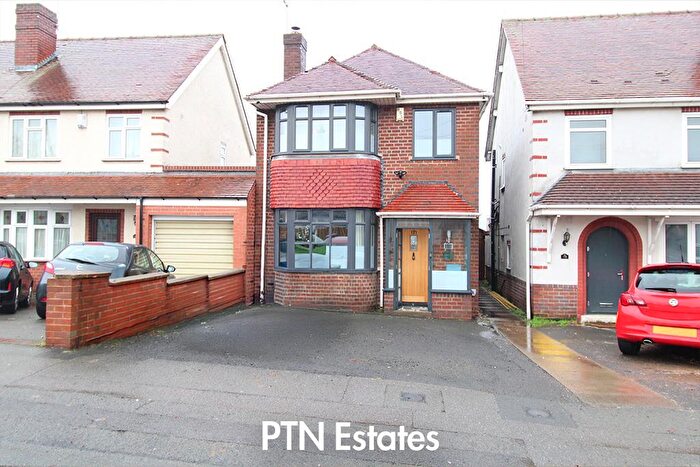
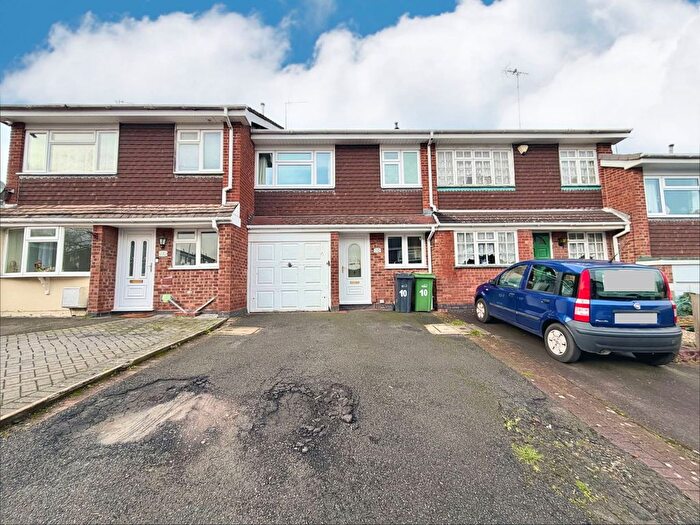
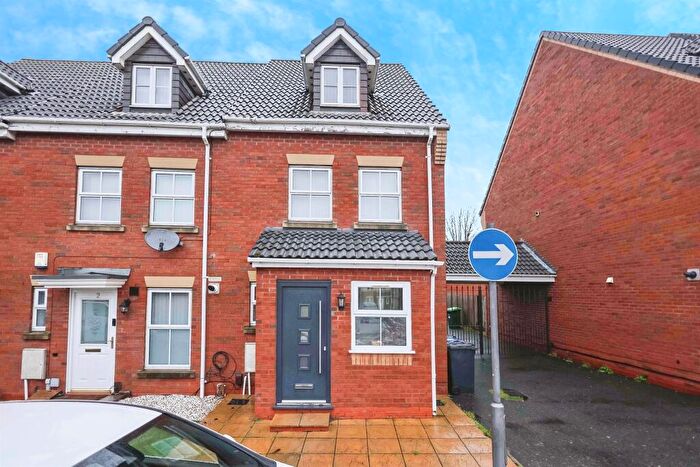
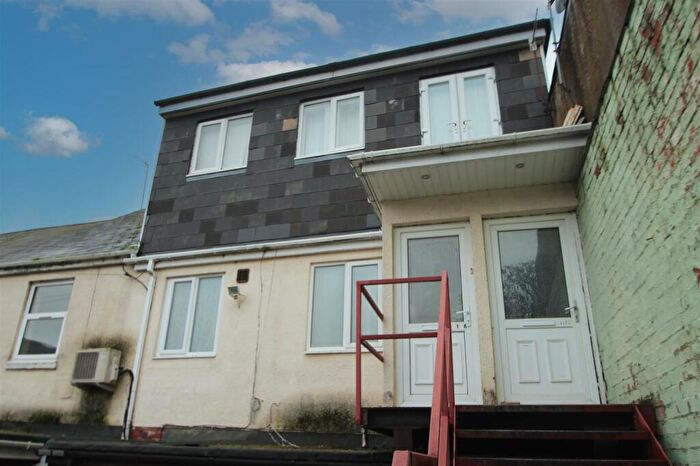
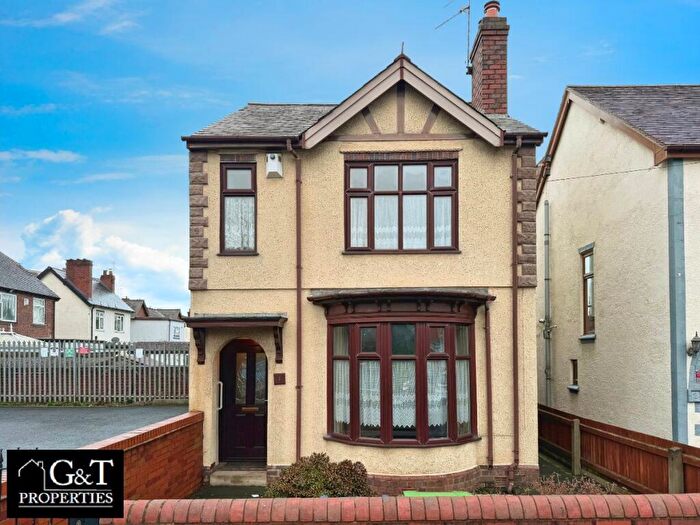
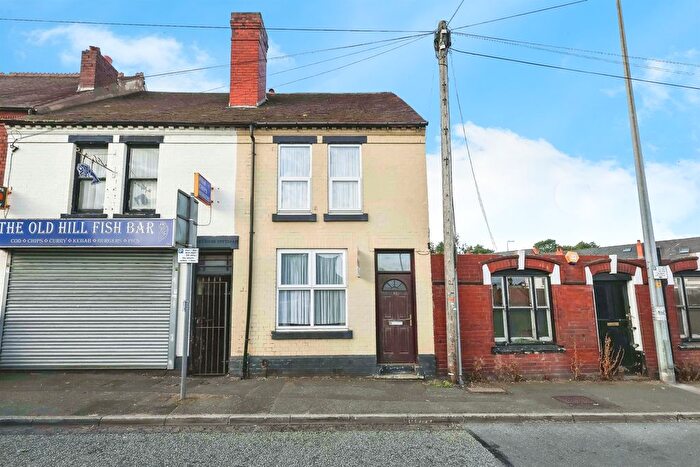
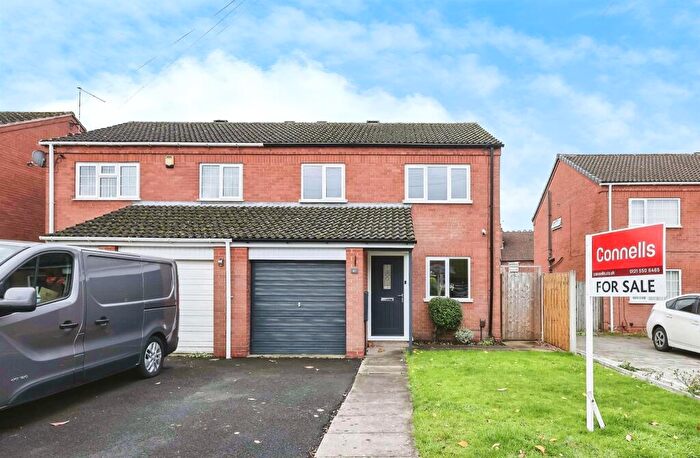
Properties for sale in Rowley
Roads and Postcodes in Rowley
Navigate through our locations to find the location of your next house in Rowley, Cradley Heath for sale or to rent.
| Streets | Postcodes |
|---|---|
| Ash Street | B64 5PW |
| Ashtree Road | B64 5PJ B64 5PL |
| Aynsley Drive | B64 5RJ |
| Beech Mews | B64 5LN |
| Bellfarm Mews | B64 5NW |
| Best Street | B64 5NY B64 5PA B64 5PB |
| Bluebell Road | B64 5NN B64 5NP |
| Boddis Industrial Park | B64 5SS |
| Brook Lane | B64 5JP |
| Century Mews | B64 5LQ |
| Cooksey Gardens | B64 5NX |
| Coxs Lane | B64 5NS B64 5NT B64 5NU B64 5QT B64 5QU |
| Cross Close | B64 5NZ |
| Denby Way | B64 5RD B64 5RF |
| Doulton Road | B64 5QB B64 5QJ B64 5QN B64 5QW |
| Forest Drive | B64 5LW |
| Garratts Lane | B64 5AW |
| Gawne Lane | B64 5QY |
| Halesowen Road | B64 5LJ B64 5LP B64 5LS B64 5LT B64 5LU B64 5LY B64 5NA B64 5NL |
| Hall Street | B64 5PH |
| Hickmans Avenue | B64 5ND B64 5NH |
| Highgate Street | B64 5RY B64 5SE B64 5RT |
| Highland Road | B64 5NB B64 5NE |
| Linton Road | B64 5NR |
| Lotus Drive | B64 5PN |
| Mildred Road | B64 5NJ |
| Millennium Gardens | B64 5LL |
| Minton Drive | B64 5RL |
| Oaklea Drive | B64 5SF |
| Pilkington Way | B64 5RA B64 5RB |
| Powke Lane | B64 5PR B64 5PS B64 5PT B64 5PX B64 5QF |
| Reddal Hill Road | B64 5JG B64 5JJ B64 5JL B64 5JN |
| Sapcote Trading Centre | B64 5QX B64 5QR |
| Unisant Trading Estate | B64 5PY |
| Victoria Gardens | B64 5LX |
| Victoria Road | B64 5NG B64 5NQ |
| Vine Gardens | B64 5RN |
| Wellington Street | B64 5NF B64 5PD |
| Willetts Way | B64 5SD |
Transport near Rowley
- FAQ
- Price Paid By Year
- Property Type Price
Frequently asked questions about Rowley
What is the average price for a property for sale in Rowley?
The average price for a property for sale in Rowley is £200,925. This amount is 4% lower than the average price in Cradley Heath. There are 1,027 property listings for sale in Rowley.
What streets have the most expensive properties for sale in Rowley?
The streets with the most expensive properties for sale in Rowley are Minton Drive at an average of £365,000, Aynsley Drive at an average of £355,000 and Denby Way at an average of £329,375.
What streets have the most affordable properties for sale in Rowley?
The streets with the most affordable properties for sale in Rowley are Victoria Gardens at an average of £92,400, Beech Mews at an average of £97,333 and Coxs Lane at an average of £145,000.
Which train stations are available in or near Rowley?
Some of the train stations available in or near Rowley are Old Hill, Cradley Heath and Rowley Regis.
Property Price Paid in Rowley by Year
The average sold property price by year was:
| Year | Average Sold Price | Price Change |
Sold Properties
|
|---|---|---|---|
| 2025 | £192,645 | -7% |
24 Properties |
| 2024 | £206,769 | 3% |
35 Properties |
| 2023 | £200,724 | -10% |
29 Properties |
| 2022 | £221,083 | 23% |
24 Properties |
| 2021 | £169,327 | 11% |
31 Properties |
| 2020 | £151,300 | -13% |
25 Properties |
| 2019 | £170,954 | -29% |
45 Properties |
| 2018 | £220,577 | 23% |
73 Properties |
| 2017 | £169,146 | 24% |
63 Properties |
| 2016 | £128,068 | 16% |
29 Properties |
| 2015 | £107,304 | -6% |
23 Properties |
| 2014 | £113,345 | 9% |
21 Properties |
| 2013 | £103,617 | -0,3% |
17 Properties |
| 2012 | £103,954 | 4% |
11 Properties |
| 2011 | £100,100 | -8% |
15 Properties |
| 2010 | £108,558 | -9% |
17 Properties |
| 2009 | £117,985 | 6% |
7 Properties |
| 2008 | £110,738 | -6% |
21 Properties |
| 2007 | £117,554 | 8% |
35 Properties |
| 2006 | £107,943 | -1% |
48 Properties |
| 2005 | £109,010 | 10% |
32 Properties |
| 2004 | £98,370 | 20% |
39 Properties |
| 2003 | £78,635 | 9% |
55 Properties |
| 2002 | £71,645 | 7% |
54 Properties |
| 2001 | £66,425 | -1% |
71 Properties |
| 2000 | £67,286 | 28% |
58 Properties |
| 1999 | £48,425 | -1% |
32 Properties |
| 1998 | £48,820 | 12% |
51 Properties |
| 1997 | £42,808 | 11% |
34 Properties |
| 1996 | £38,275 | -23% |
35 Properties |
| 1995 | £47,100 | - |
20 Properties |
Property Price per Property Type in Rowley
Here you can find historic sold price data in order to help with your property search.
The average Property Paid Price for specific property types in the last three years are:
| Property Type | Average Sold Price | Sold Properties |
|---|---|---|
| Semi Detached House | £201,769.00 | 39 Semi Detached Houses |
| Detached House | £293,525.00 | 18 Detached Houses |
| Terraced House | £154,307.00 | 26 Terraced Houses |
| Flat | £103,400.00 | 5 Flats |

