
Houses for sale & to rent in Farnham, Slough
House Prices in Farnham
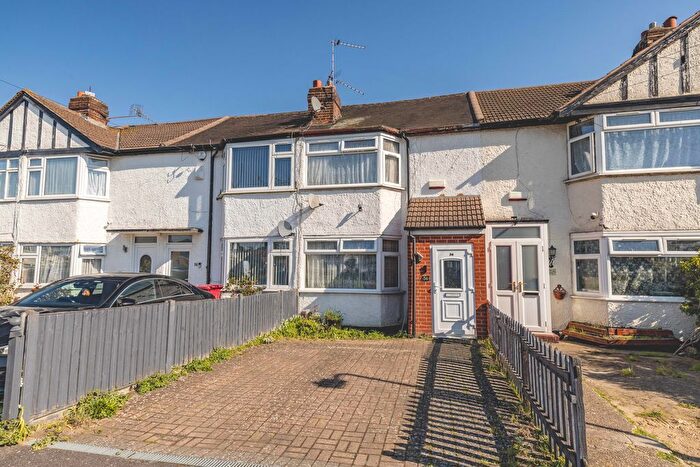
Properties in Farnham have an average house price of £337k and had 175 Property Transactions within the last 3 years¹.
Farnham is an area in Slough, Slough with 3,483 households², where the most expensive property was sold for £725k.
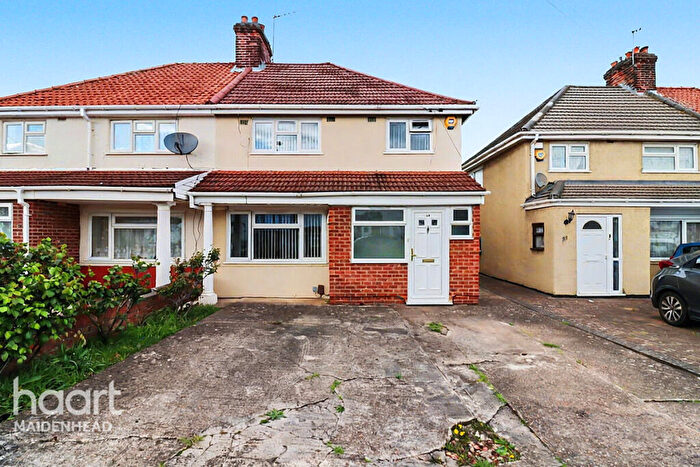
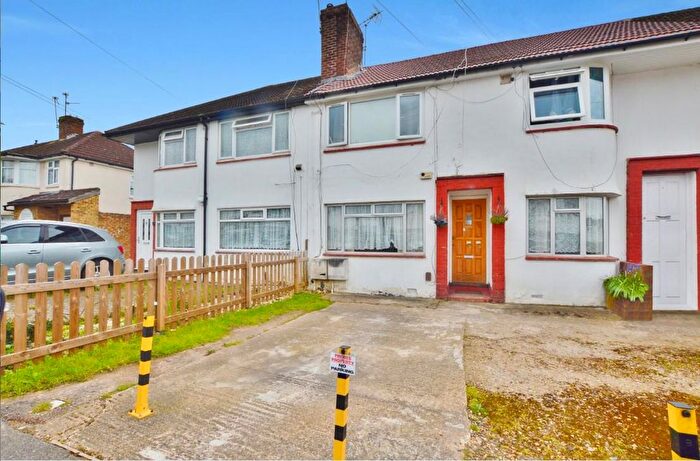
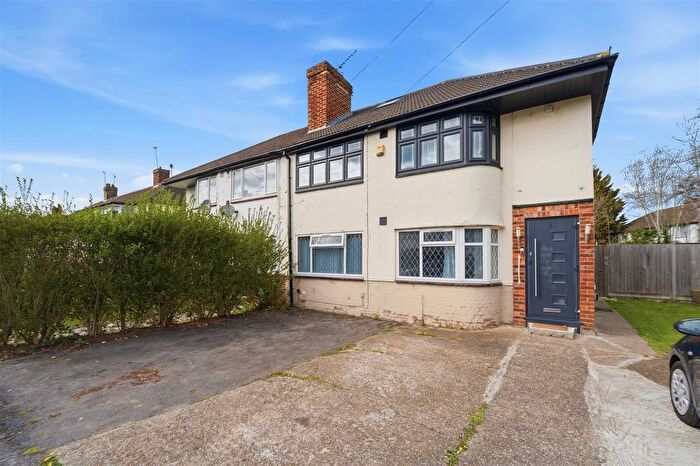
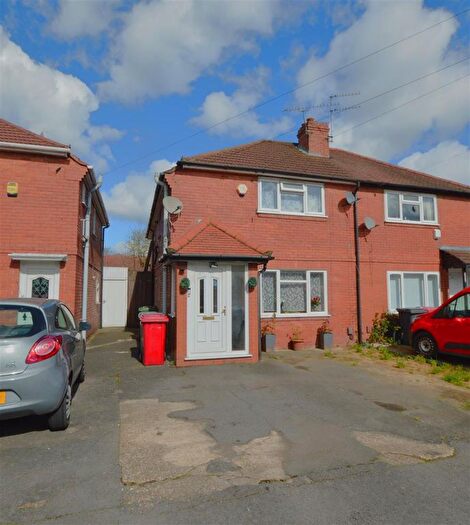
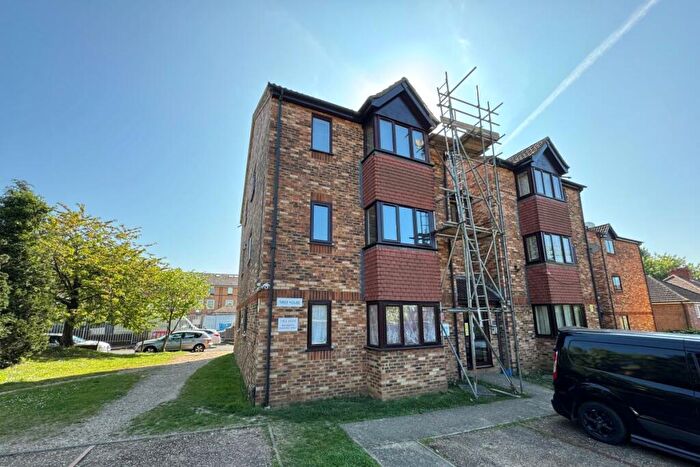
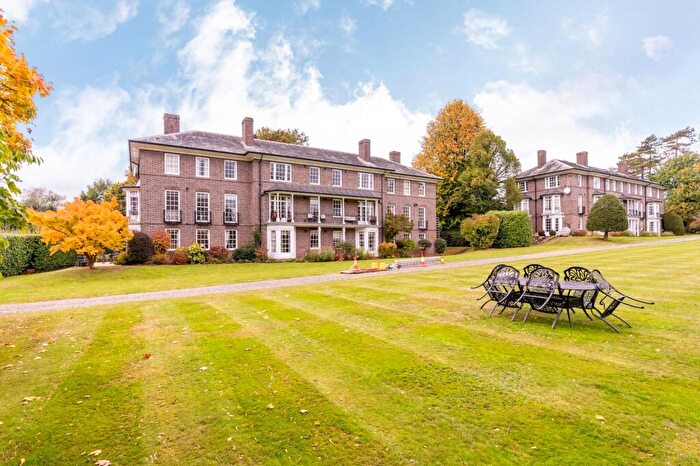
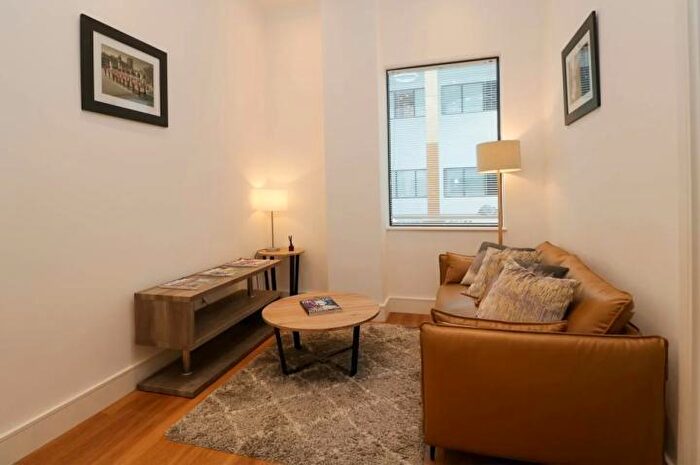
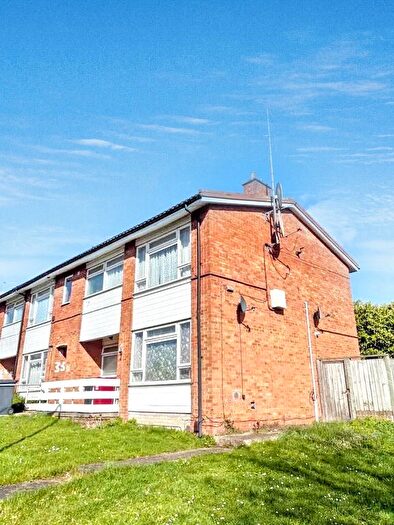
Properties for sale in Farnham


![]()
If you are looking to sell your house, let it out, or receive a property valuation, an expert can help you.
Click the button below to get started.


Roads and Postcodes in Farnham
Navigate through our locations to find the location of your next house in Farnham, Slough for sale or to rent.
Transport near Farnham
-

 Burnham Station
 -
Slough Station
-
Taplow Station
-
Windsor and Eton Riverside Station
-
Windsor and Eton Central Station
- FAQ
- Price Paid By Year
- Property Type Price
Frequently asked questions about Farnham
What is the average price for a property for sale in Farnham?
The average price for a property for sale in Farnham is £336,601. This amount is 12% lower than the average price in Slough. There are 1,039 property listings for sale in Farnham.
What streets have the most expensive properties for sale in Farnham?
The streets with the most expensive properties for sale in Farnham are Northampton Avenue at an average of £560,000, First Crescent at an average of £500,000 and Second Crescent at an average of £475,000.
What streets have the most affordable properties for sale in Farnham?
The streets with the most affordable properties for sale in Farnham are Franklin Avenue at an average of £184,375, Stafford Avenue at an average of £199,250 and Montrose Avenue at an average of £210,000.
Which train stations are available in or near Farnham?
Some of the train stations available in or near Farnham are Burnham, Slough and Taplow.
Property Price Paid in Farnham by Year
The average sold property price by year was:
| Year | Average Sold Price | Price Change |
Sold Properties
|
|---|---|---|---|
| 2026 | £205,666 | -71% |
3 Properties |
| 2025 | £352,170 | 6% |
45 Properties |
| 2024 | £332,691 | -1% |
66 Properties |
| 2023 | £335,786 | 9% |
61 Properties |
| 2022 | £303,900 | 5% |
95 Properties |
| 2021 | £289,912 | -3% |
98 Properties |
| 2020 | £299,284 | 3% |
50 Properties |
| 2019 | £289,324 | -1% |
65 Properties |
| 2018 | £292,481 | 7% |
84 Properties |
| 2017 | £272,478 | 8% |
112 Properties |
| 2016 | £249,407 | 12% |
143 Properties |
| 2015 | £219,689 | 9% |
112 Properties |
| 2014 | £200,465 | 8% |
123 Properties |
| 2013 | £184,479 | 8% |
78 Properties |
| 2012 | £170,204 | -1% |
74 Properties |
| 2011 | £172,750 | 5% |
66 Properties |
| 2010 | £164,559 | 8% |
63 Properties |
| 2009 | £151,952 | -11% |
54 Properties |
| 2008 | £168,818 | -7% |
104 Properties |
| 2007 | £180,787 | 6% |
193 Properties |
| 2006 | £170,145 | 8% |
212 Properties |
| 2005 | £156,086 | 3% |
178 Properties |
| 2004 | £151,832 | 3% |
214 Properties |
| 2003 | £146,564 | 19% |
256 Properties |
| 2002 | £118,422 | 15% |
224 Properties |
| 2001 | £100,978 | 13% |
233 Properties |
| 2000 | £87,390 | 22% |
224 Properties |
| 1999 | £68,136 | 7% |
230 Properties |
| 1998 | £63,144 | 8% |
188 Properties |
| 1997 | £58,273 | 12% |
191 Properties |
| 1996 | £50,989 | 4% |
170 Properties |
| 1995 | £48,972 | - |
129 Properties |
Property Price per Property Type in Farnham
Here you can find historic sold price data in order to help with your property search.
The average Property Paid Price for specific property types in the last three years are:
| Property Type | Average Sold Price | Sold Properties |
|---|---|---|
| Flat | £217,561.00 | 59 Flats |
| Semi Detached House | £410,326.00 | 57 Semi Detached Houses |
| Terraced House | £375,008.00 | 56 Terraced Houses |
| Detached House | £560,000.00 | 3 Detached Houses |