
Houses for sale & to rent in North Curry And Stoke St Gregory, Bridgwater
House Prices in North Curry And Stoke St Gregory
Properties in North Curry And Stoke St Gregory have an average house price of £578k and had 8 Property Transactions within the last 3 years¹.
North Curry And Stoke St Gregory is an area in Bridgwater, Somerset with 188 households², where the most expensive property was sold for £1.32M.
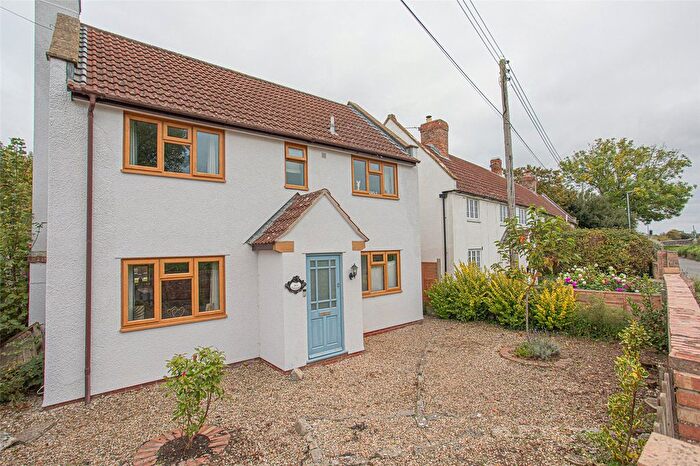
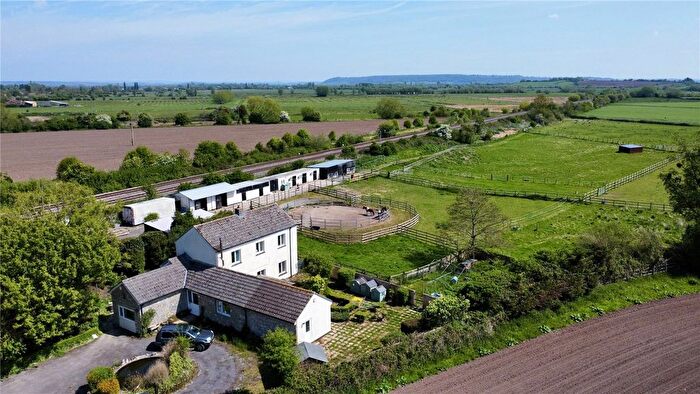
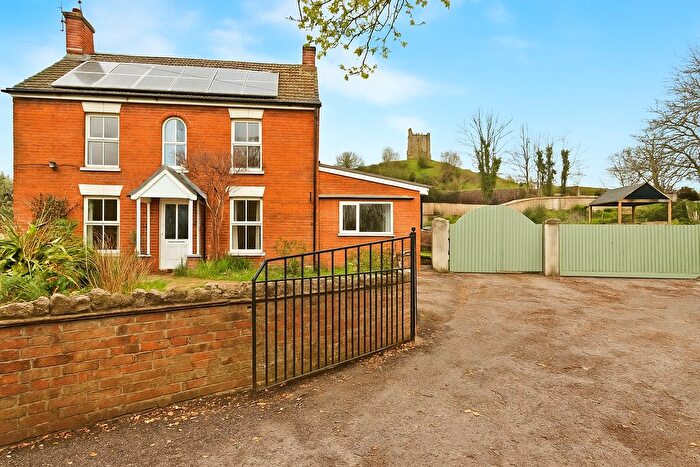
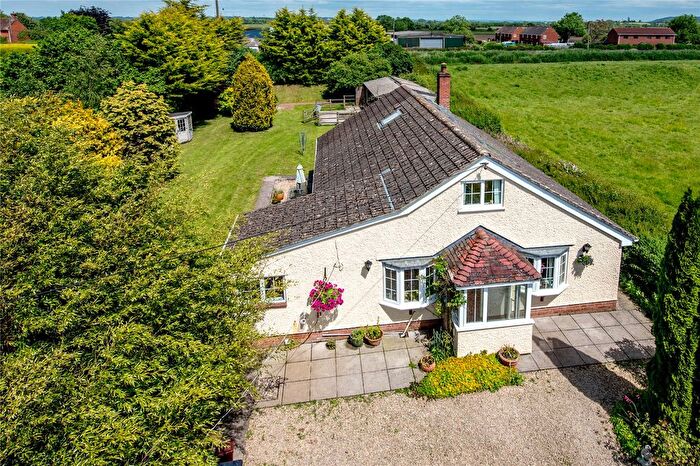
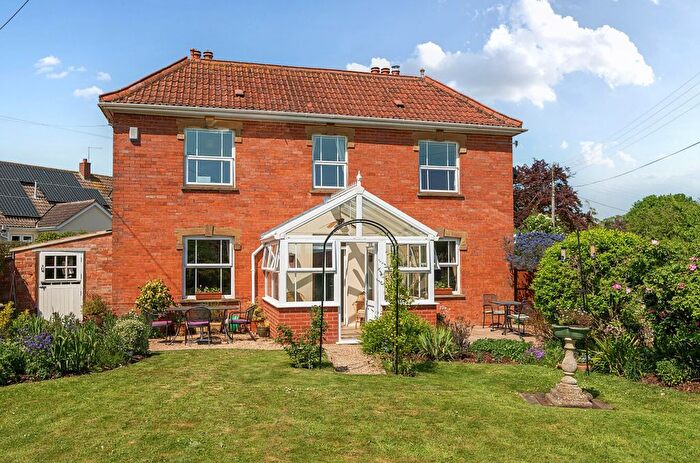
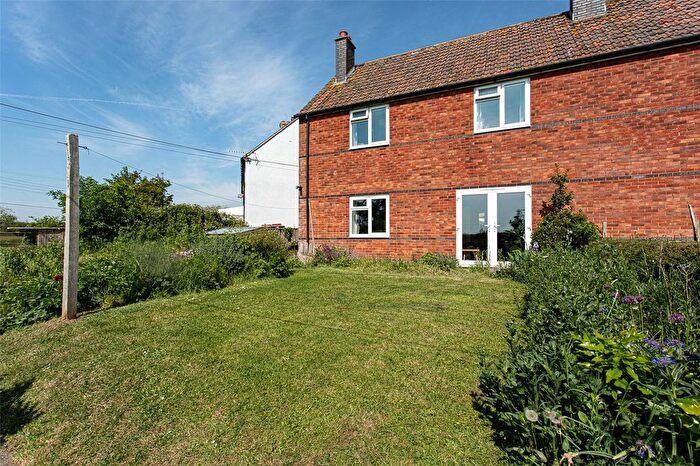
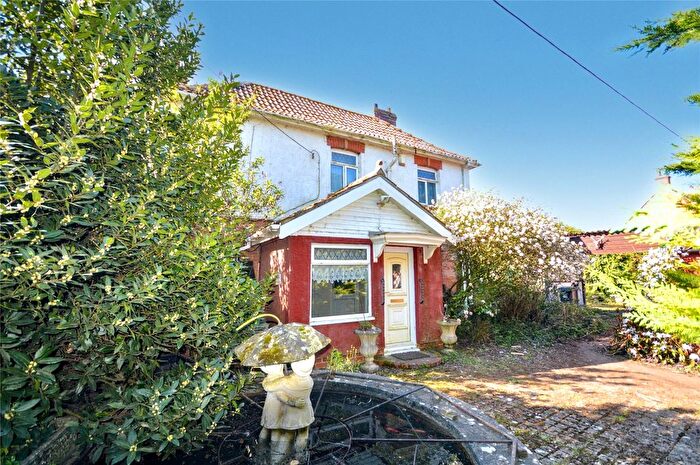
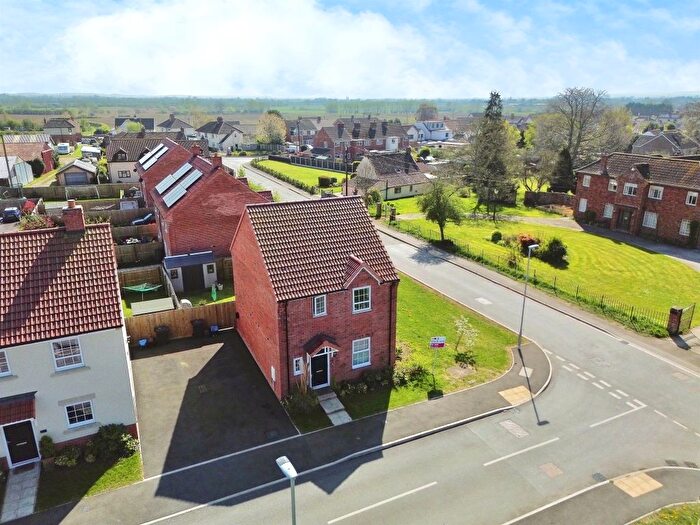
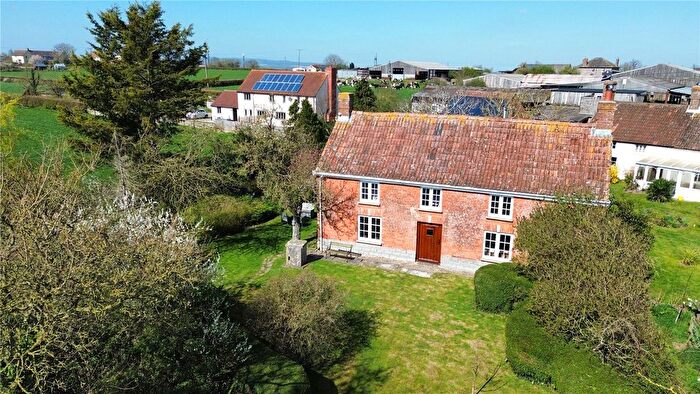
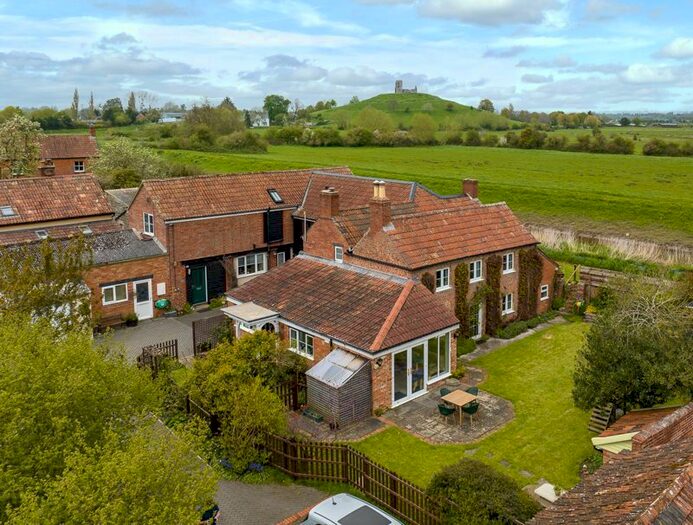
Properties for sale in North Curry And Stoke St Gregory
Previously listed properties in North Curry And Stoke St Gregory
![]()
If you are looking to sell your house, let it out, or receive a property valuation, an expert can help you.
Click the button below to get started.
Roads and Postcodes in North Curry And Stoke St Gregory
Navigate through our locations to find the location of your next house in North Curry And Stoke St Gregory, Bridgwater for sale or to rent.
| Streets | Postcodes |
|---|---|
| Athelney Bridge | TA7 0SB |
| Burrow Wall | TA7 0JQ |
| Burrowbridge | TA7 0RB TA7 0RE TA7 0RF TA7 0RG |
| Saltmoor | TA7 0RJ TA7 0RL TA7 0RW |
| Stanmoor Road | TA7 0RX TA7 0SA |
| Stathe Road | TA7 0JH TA7 0RY |
| TA7 0JJ TA7 0JL TA7 0JN TA7 0SE |
Transport near North Curry And Stoke St Gregory

- FAQ
- Price Paid By Year
- Property Type Price
Frequently asked questions about North Curry And Stoke St Gregory
What is the average price for a property for sale in North Curry And Stoke St Gregory?
The average price for a property for sale in North Curry And Stoke St Gregory is £578,125. This amount is 108% higher than the average price in Bridgwater. There are 39 property listings for sale in North Curry And Stoke St Gregory.
What streets have the most expensive properties for sale in North Curry And Stoke St Gregory?
The streets with the most expensive properties for sale in North Curry And Stoke St Gregory are Saltmoor at an average of £1,010,000 and Stathe Road at an average of £455,000.
What streets have the most affordable properties for sale in North Curry And Stoke St Gregory?
The street with the most affordable properties for sale in North Curry And Stoke St Gregory is Stanmoor Road at an average of £425,000.
Which train stations are available in or near North Curry And Stoke St Gregory?
Some of the train stations available in or near North Curry And Stoke St Gregory are Bridgwater, Taunton and Highbridge and Burnham.
Property Price Paid in North Curry And Stoke St Gregory by Year
The average sold property price by year was:
| Year | Average Sold Price | Price Change |
Sold Properties
|
|---|---|---|---|
| 2025 | £671,000 | 37% |
5 Properties |
| 2024 | £425,000 | 1% |
1 Property |
| 2023 | £422,500 | -8% |
2 Properties |
| 2022 | £455,000 | -5% |
1 Property |
| 2021 | £476,245 | 13% |
5 Properties |
| 2020 | £416,243 | -38% |
8 Properties |
| 2019 | £575,000 | 32% |
2 Properties |
| 2018 | £393,000 | 6% |
5 Properties |
| 2017 | £368,000 | 6% |
5 Properties |
| 2016 | £344,928 | -7% |
7 Properties |
| 2015 | £368,750 | 36% |
2 Properties |
| 2014 | £234,333 | -49% |
6 Properties |
| 2013 | £349,237 | 6% |
4 Properties |
| 2012 | £327,908 | -105% |
6 Properties |
| 2011 | £673,333 | 61% |
3 Properties |
| 2010 | £263,666 | 22% |
6 Properties |
| 2009 | £204,991 | -21% |
6 Properties |
| 2008 | £247,975 | -46% |
4 Properties |
| 2007 | £362,820 | 25% |
7 Properties |
| 2006 | £272,878 | 6% |
7 Properties |
| 2005 | £256,800 | -2% |
5 Properties |
| 2004 | £261,790 | -11% |
5 Properties |
| 2003 | £291,357 | 28% |
7 Properties |
| 2002 | £208,408 | 48% |
15 Properties |
| 2001 | £107,666 | -49% |
3 Properties |
| 2000 | £160,925 | 22% |
13 Properties |
| 1999 | £125,300 | 2% |
8 Properties |
| 1998 | £122,491 | 7% |
6 Properties |
| 1997 | £114,233 | 28% |
12 Properties |
| 1996 | £82,260 | -8% |
15 Properties |
| 1995 | £88,500 | - |
3 Properties |
Property Price per Property Type in North Curry And Stoke St Gregory
Here you can find historic sold price data in order to help with your property search.
The average Property Paid Price for specific property types in the last three years are:
| Property Type | Average Sold Price | Sold Properties |
|---|---|---|
| Semi Detached House | £575,000.00 | 1 Semi Detached House |
| Detached House | £578,571.00 | 7 Detached Houses |