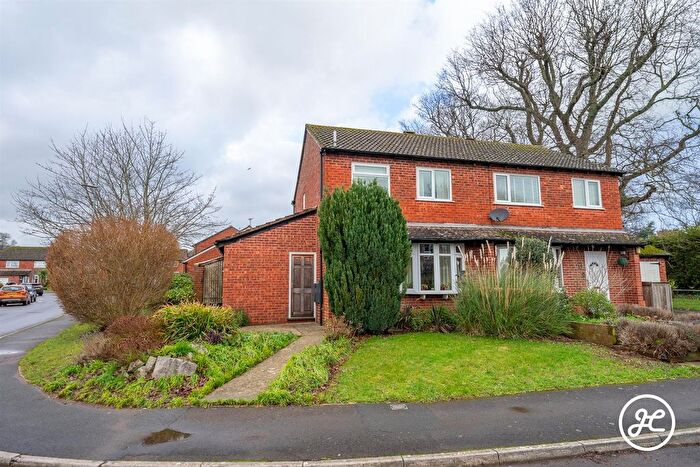
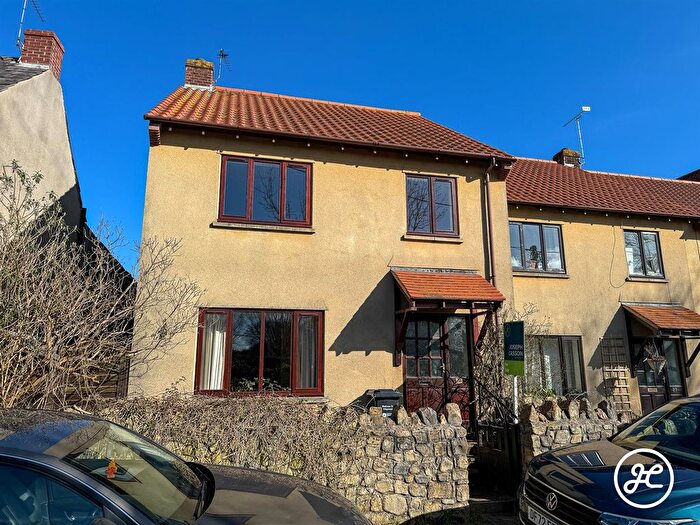
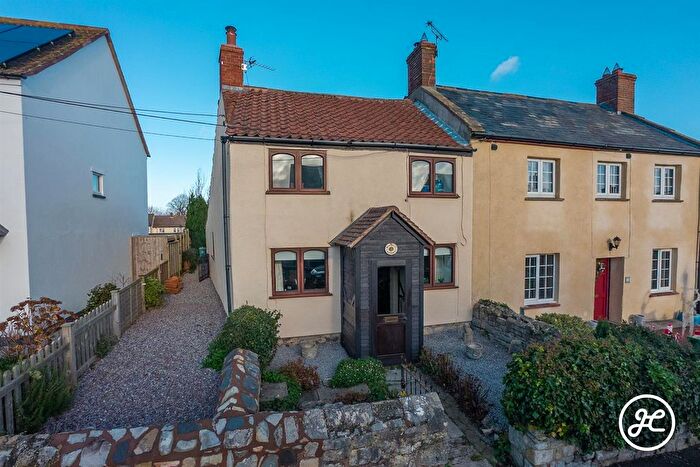
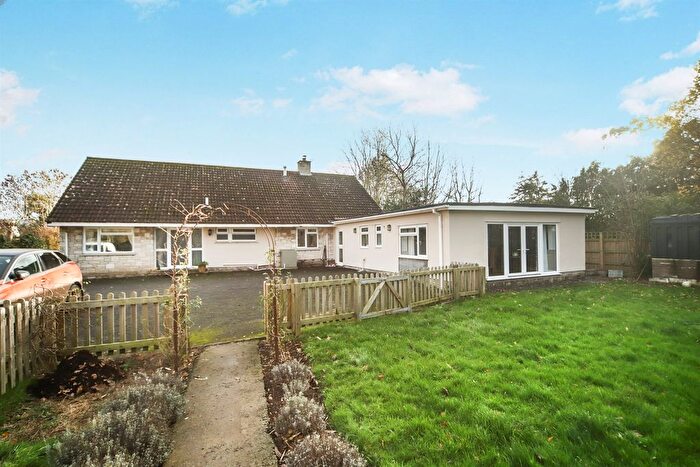
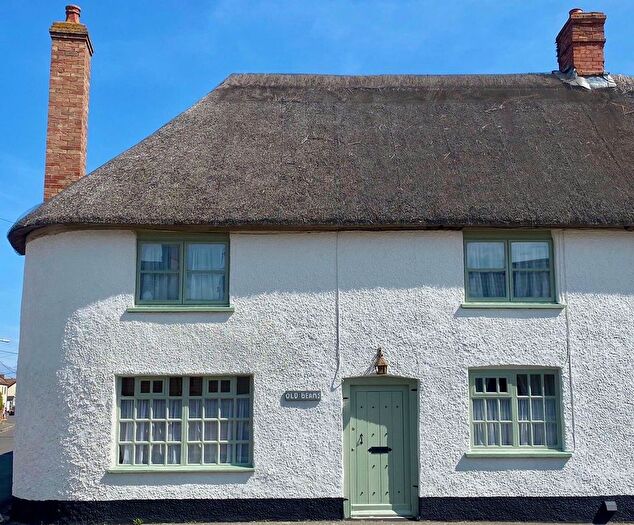
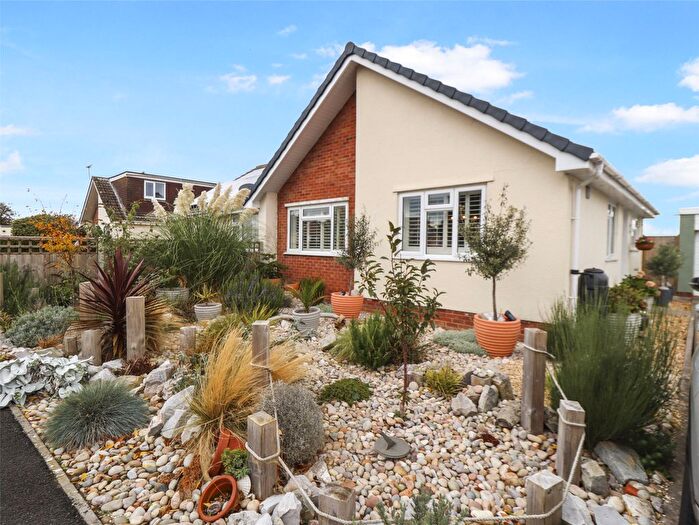
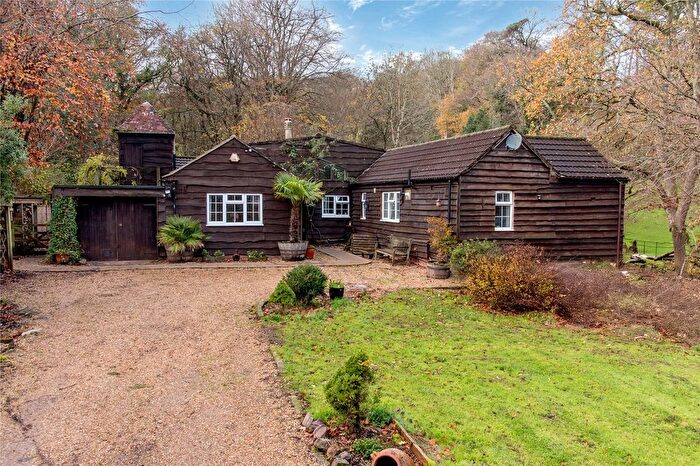
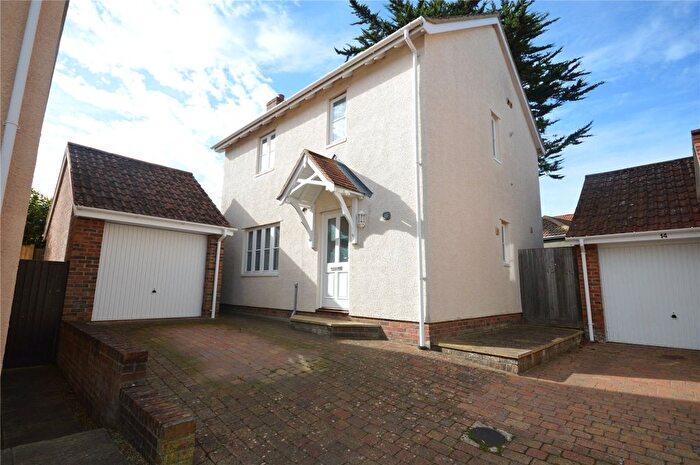
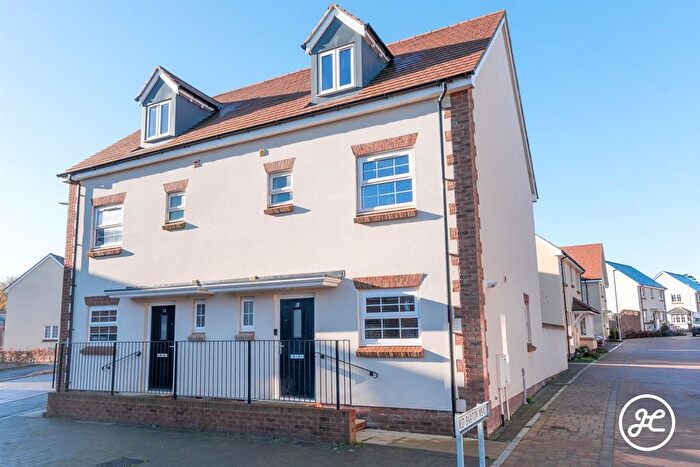
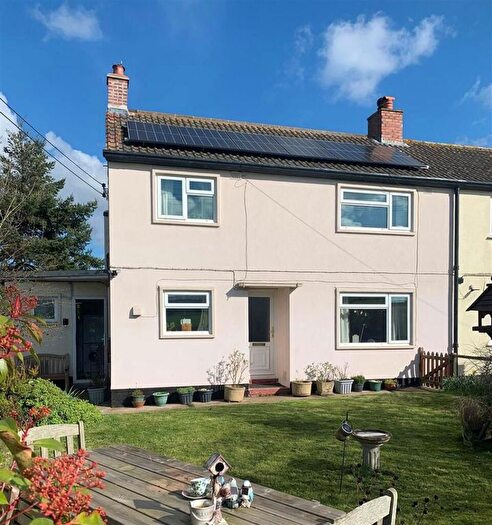
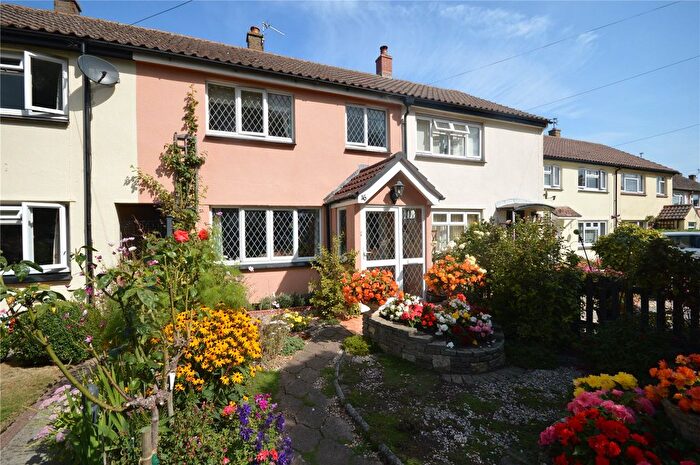
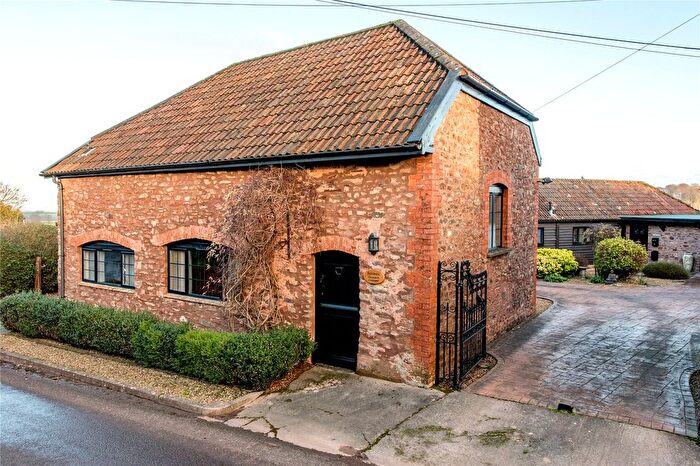
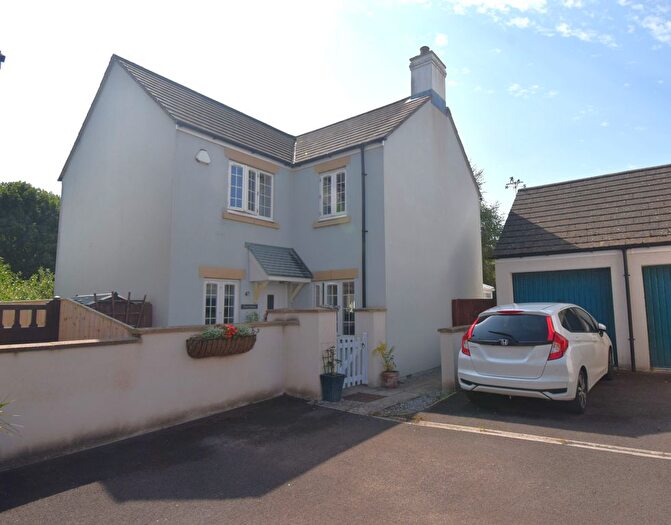
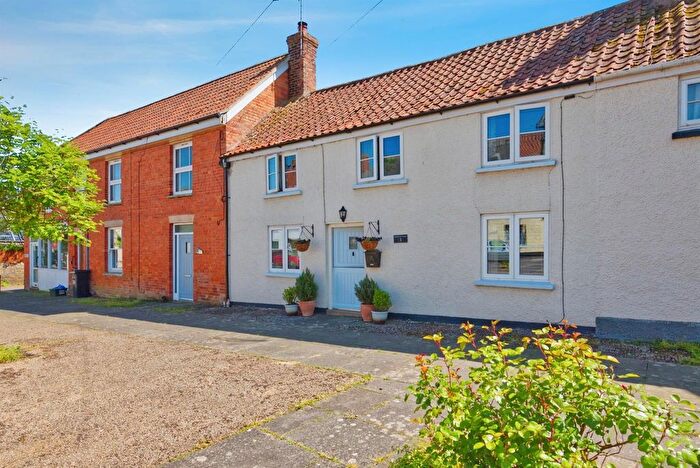
Houses for sale & to rent in Quantock Vale, Bridgwater
House Prices in Quantock Vale
Properties in Quantock Vale have an average house price of £365,990.00 and had 101 Property Transactions within the last 3 years¹.
Quantock Vale is an area in Bridgwater, Somerset with 949 households², where the most expensive property was sold for £921,000.00.
Previously listed properties in Quantock Vale
Roads and Postcodes in Quantock Vale
Navigate through our locations to find the location of your next house in Quantock Vale, Bridgwater for sale or to rent.
| Streets | Postcodes |
|---|---|
| Bears Meadow Lane | TA5 1EN |
| Burgage Road | TA5 1QZ TA5 1RB |
| Burton | TA5 1QB |
| Castle Street | TA5 1TG |
| Church Street | TA5 1TQ |
| Cockwood | TA5 1RH |
| Dodington | TA5 1LE TA5 1LF |
| Fairfield Drive | TA5 1PX |
| Farringdon Hill | TA5 1TJ |
| Forge Corner | TA5 1QJ |
| Gowell Lane | TA5 1TF |
| Green Close | TA5 1SB |
| High Street | TA5 1PL TA5 1TA TA5 1TB TA5 1TD |
| Hilltop Lane | TA5 1SR |
| Hinkley Point | TA5 1TP |
| Hunts Lane | TA5 1DY |
| Kilton | TA5 1ST |
| Knighton | TA5 1QD |
| Lime Street | TA5 1QR TA5 1QT |
| Lonlay Mews | TA5 1QN |
| Meadow Gardens | TA5 1RW |
| Millands Lane | TA5 1ED |
| Northfields Close | TA5 1QY |
| Old Ham | TA5 1EF |
| Paddons Farm | TA5 1BG |
| Park View | TA5 1QS |
| Portway Lane | TA5 1SH |
| Putsham Hill | TA5 1DX |
| Putsham Mead | TA5 1DZ |
| Quantock View | TA5 1EE |
| Rowditch Lane | TA5 1SY |
| Shurton | TA5 1QE TA5 1QF TA5 1QG TA5 1QH TA5 1QQ |
| Shurton Lane | TA5 1QL |
| Sowden Hill | TA5 1RP |
| St Andrews Road | TA5 1TE |
| St Audries Close | TA5 1QU |
| Stogursey Road | TA5 1LA |
| Stolford | TA5 1TL TA5 1TN TA5 1TW |
| Tower Hill | TA5 1PR |
| Town Close | TA5 1RN |
| Vicarage Close | TA5 1QX |
| Vicarage Road | TA5 1RD |
| TA5 1DU TA5 1EA TA5 1EB TA5 1EG TA5 1EQ TA5 1RG TA5 1RJ TA5 1RY TA5 1RZ TA5 1SA TA5 1SD TA5 1SE TA5 1SG TA5 1SQ TA5 1SS TA5 1SU TA5 1SX TA5 1TR TA4 4DL TA4 4DY TA4 4DZ TA5 1EH TA5 1EL TA5 1PS TA5 1PT TA5 1PU TA5 1PY TA5 1PZ TA5 1QA TA5 1RL TA5 1RQ TA5 1SF TA5 1SP TA5 1TH TA5 1UD TA5 1UF TA5 1YA |
Transport near Quantock Vale
- FAQ
- Price Paid By Year
- Property Type Price
Frequently asked questions about Quantock Vale
What is the average price for a property for sale in Quantock Vale?
The average price for a property for sale in Quantock Vale is £365,990. This amount is 32% higher than the average price in Bridgwater. There are 253 property listings for sale in Quantock Vale.
What streets have the most expensive properties for sale in Quantock Vale?
The streets with the most expensive properties for sale in Quantock Vale are Dodington at an average of £670,500, Hilltop Lane at an average of £546,290 and Kilton at an average of £513,750.
What streets have the most affordable properties for sale in Quantock Vale?
The streets with the most affordable properties for sale in Quantock Vale are Burgage Road at an average of £198,890, Lonlay Mews at an average of £201,600 and Castle Street at an average of £229,000.
Which train stations are available in or near Quantock Vale?
Some of the train stations available in or near Quantock Vale are Bridgwater, Highbridge and Burnham and Taunton.
Property Price Paid in Quantock Vale by Year
The average sold property price by year was:
| Year | Average Sold Price | Price Change |
Sold Properties
|
|---|---|---|---|
| 2025 | £447,359 | 23% |
26 Properties |
| 2024 | £344,859 | 3% |
29 Properties |
| 2023 | £333,320 | 9% |
46 Properties |
| 2022 | £304,886 | -20% |
42 Properties |
| 2021 | £365,492 | 7% |
55 Properties |
| 2020 | £338,739 | 3% |
23 Properties |
| 2019 | £327,089 | 6% |
28 Properties |
| 2018 | £308,440 | 4% |
26 Properties |
| 2017 | £296,126 | 10% |
37 Properties |
| 2016 | £267,934 | 11% |
31 Properties |
| 2015 | £239,682 | -42% |
34 Properties |
| 2014 | £339,154 | 28% |
26 Properties |
| 2013 | £244,467 | -9% |
26 Properties |
| 2012 | £267,317 | 19% |
14 Properties |
| 2011 | £215,310 | -2% |
32 Properties |
| 2010 | £219,094 | 6% |
29 Properties |
| 2009 | £205,014 | -1% |
28 Properties |
| 2008 | £206,620 | -48% |
31 Properties |
| 2007 | £306,155 | 23% |
39 Properties |
| 2006 | £236,005 | 1% |
44 Properties |
| 2005 | £234,201 | 4% |
32 Properties |
| 2004 | £223,973 | 13% |
32 Properties |
| 2003 | £193,825 | 12% |
39 Properties |
| 2002 | £169,639 | 24% |
35 Properties |
| 2001 | £129,706 | 1% |
37 Properties |
| 2000 | £128,495 | 13% |
31 Properties |
| 1999 | £111,905 | 0,4% |
52 Properties |
| 1998 | £111,441 | 24% |
46 Properties |
| 1997 | £84,873 | -10% |
39 Properties |
| 1996 | £92,964 | 29% |
37 Properties |
| 1995 | £66,439 | - |
25 Properties |
Property Price per Property Type in Quantock Vale
Here you can find historic sold price data in order to help with your property search.
The average Property Paid Price for specific property types in the last three years are:
| Property Type | Average Sold Price | Sold Properties |
|---|---|---|
| Semi Detached House | £279,670.00 | 23 Semi Detached Houses |
| Detached House | £489,431.00 | 47 Detached Houses |
| Terraced House | £242,881.00 | 31 Terraced Houses |

