
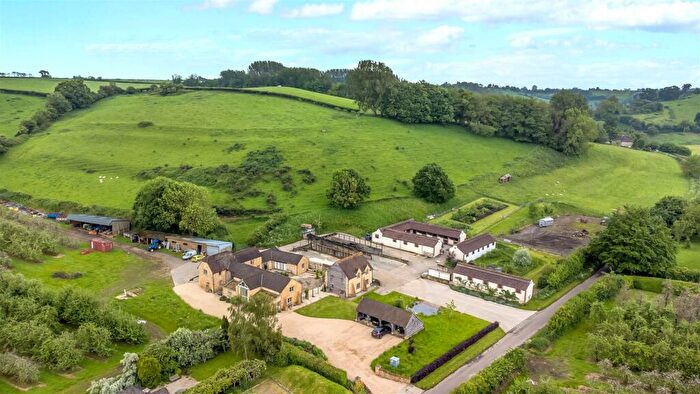
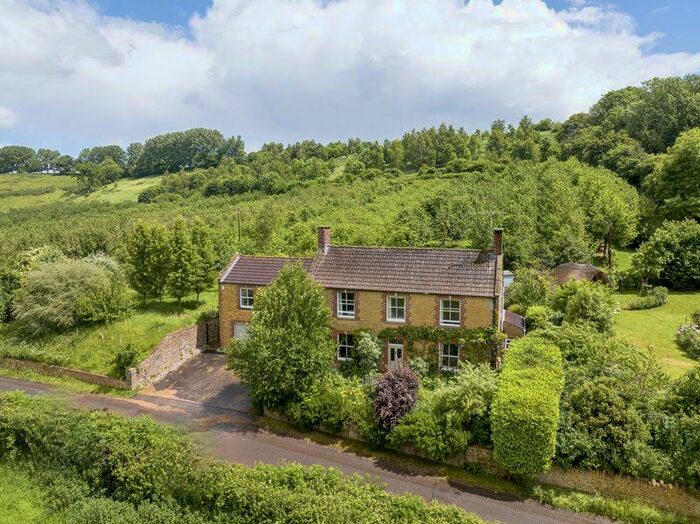
Houses for sale in Tower, Castle Cary
House Prices in Tower
Properties in Tower have an average house price of £1.18M and had 2 Property Transactions within the last 3 years¹.
Tower is an area in Castle Cary, Somerset with 52 households², where the most expensive property was sold for £1.85M.
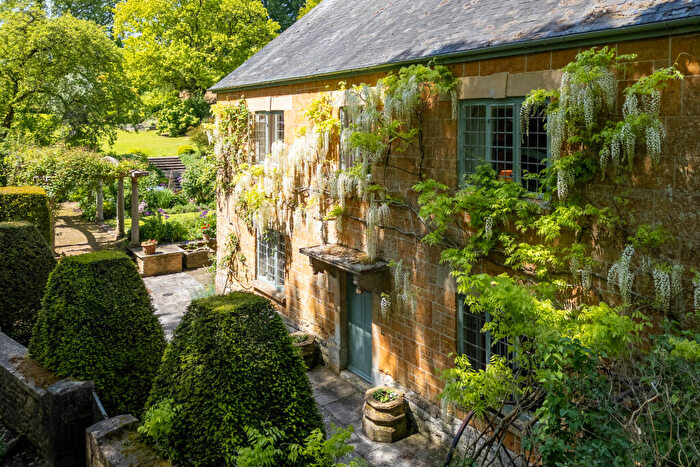
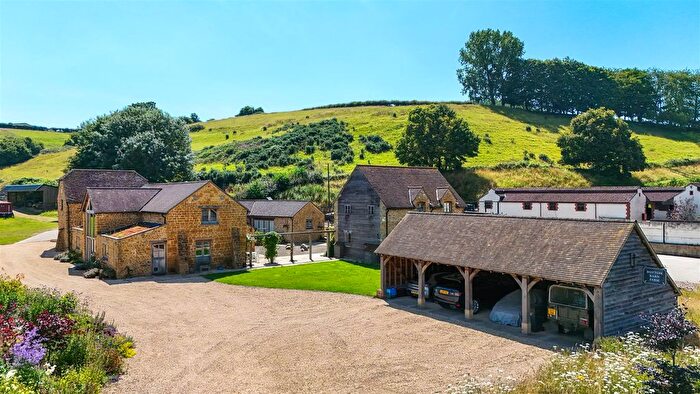
Properties for sale in Tower
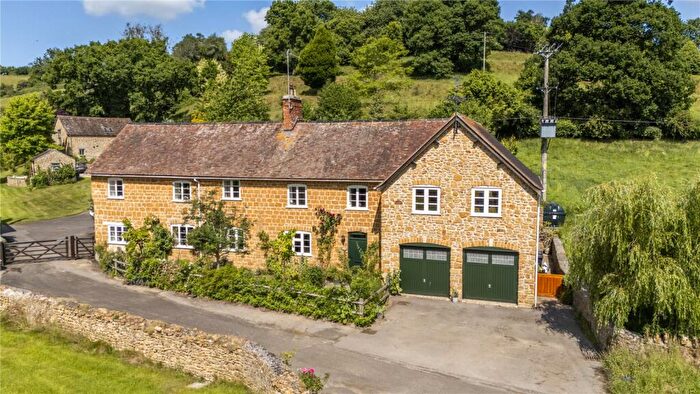
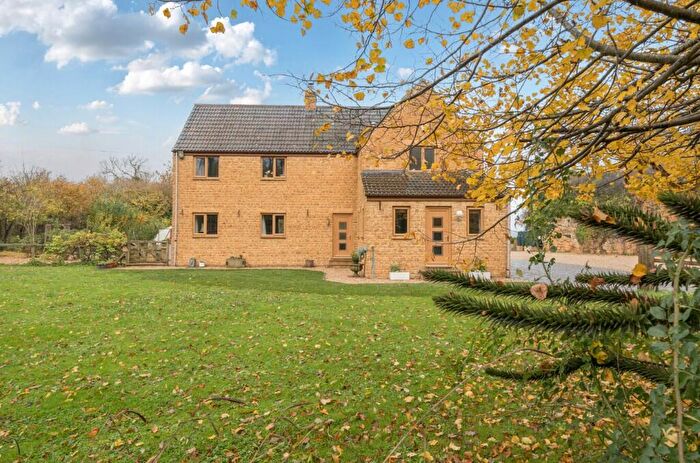
Previously listed properties in Tower
Roads and Postcodes in Tower
Navigate through our locations to find the location of your next house in Tower, Castle Cary for sale or to rent.
| Streets | Postcodes |
|---|---|
| Cary Edge Lane | BA7 7LZ |
| Cary Hill | BA7 7NN |
| Gristway Cottages | BA7 7NQ |
| Grove Cottages | BA7 7NJ |
| Grove Mead | BA7 7NH |
| Honeywick | BA7 7LP |
| Lime Kiln Lane | BA7 7NX |
| BA7 7LN BA7 7LR BA7 7LW BA7 7LX BA7 7LY BA7 7NA BA7 7NE BA7 7NF BA7 7NG |
Property price trends in Tower
According to the latest Land Registry data, the average home in Tower sold for £1,850,000 in 2024. That figure comes from 60 sales logged over the past 29 years.
Prices have continued to climb over the last three years. Compared with 2021, when the typical sale came in around £850,000, that's a rise of roughly 117.6%.
Looking back five years, average prices are up about 393.3% since 2020, a gain of around £1,475,003 in cash terms.
Zoom out to the past decade for the fuller picture. Back in 2014, homes here averaged £715,833, so the typical sold price has climbed about 158.4% since then, roughly 10% a year. Stretch the view to fifteen years and that annual pace holds at about 9.9%.
Frequently asked questions about Tower
What is the average price for a property for sale in Tower?
The average price for a property for sale in Tower is £1,175,000. This amount is 225% higher than the average price in Castle Cary. There are 7 property listings for sale in Tower.
Which train stations are available in or near Tower?
Some of the train stations available in or near Tower are Castle Cary, Bruton and Templecombe.
Property Price Paid in Tower by Year
The average sold property price by year was:
| Year | Average Sold Price | Price Change |
Sold Properties
|
|---|---|---|---|
| 2024 | £1,850,000 | 73% |
1 Property |
| 2023 | £500,000 | -70% |
1 Property |
| 2021 | £850,000 | 56% |
1 Property |
| 2020 | £374,997 | -90% |
2 Properties |
| 2017 | £711,666 | 2% |
3 Properties |
| 2016 | £695,000 | 32% |
1 Property |
| 2015 | £470,000 | -52% |
2 Properties |
| 2014 | £715,833 | 36% |
3 Properties |
| 2013 | £460,250 | 9% |
3 Properties |
| 2012 | £421,000 | 13% |
3 Properties |
Property Price per Property Type in Tower
Here you can find historic sold price data in order to help with your property search.
The average Property Paid Price for specific property types in the last three years are:
| Property Type | Average Sold Price | Sold Properties |
|---|---|---|
| Semi Detached House | £500,000.00 | 1 Semi Detached House |
| Detached House | £1,850,000.00 | 1 Detached House |
