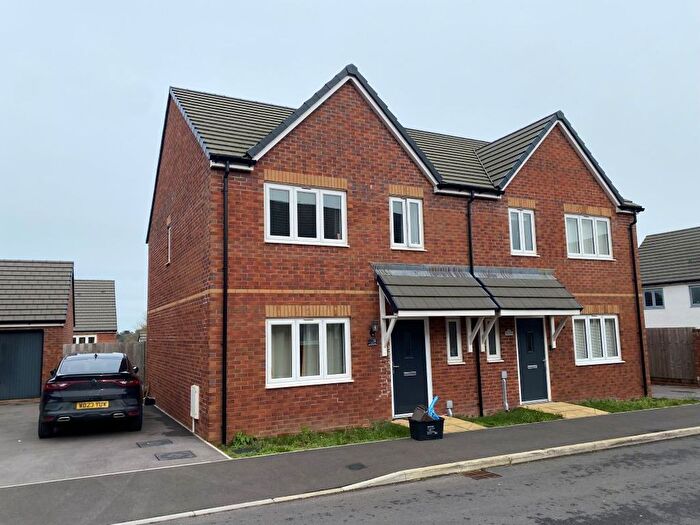
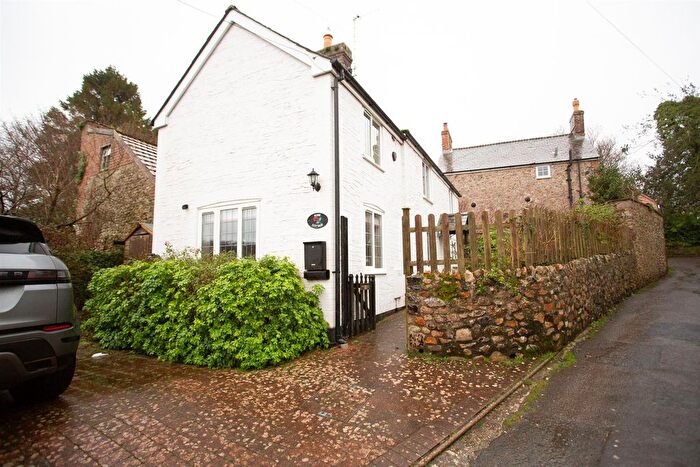
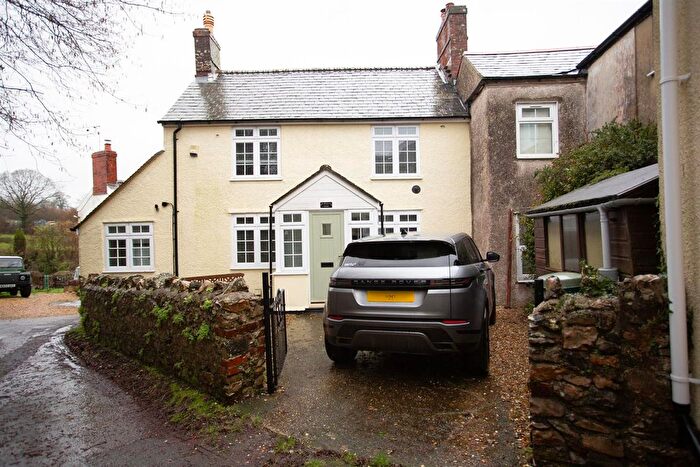
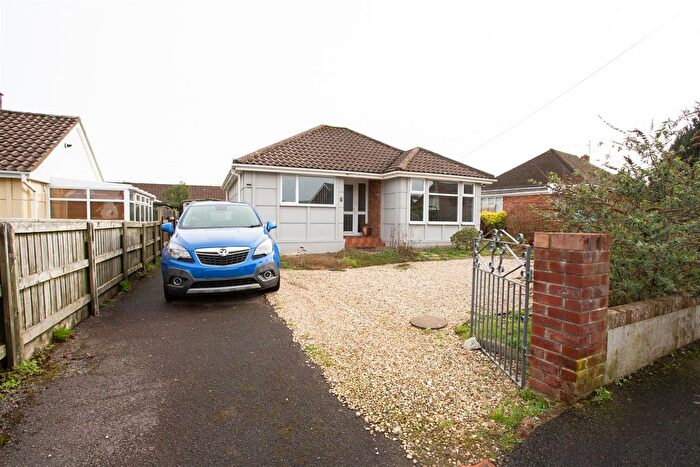
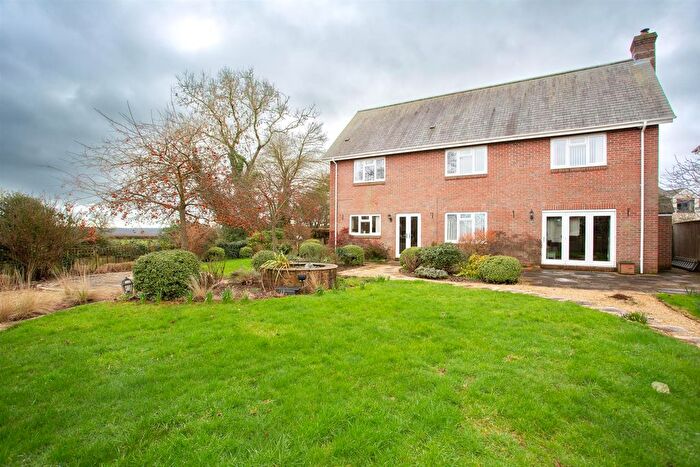
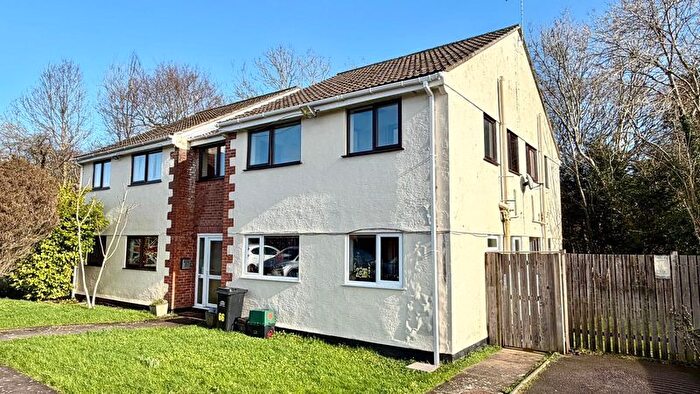
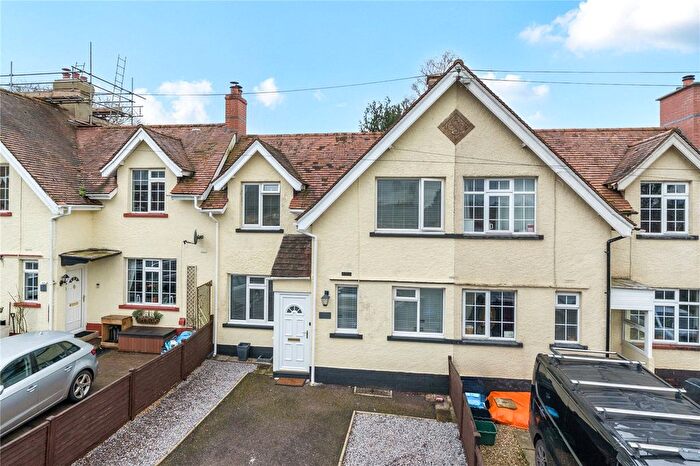
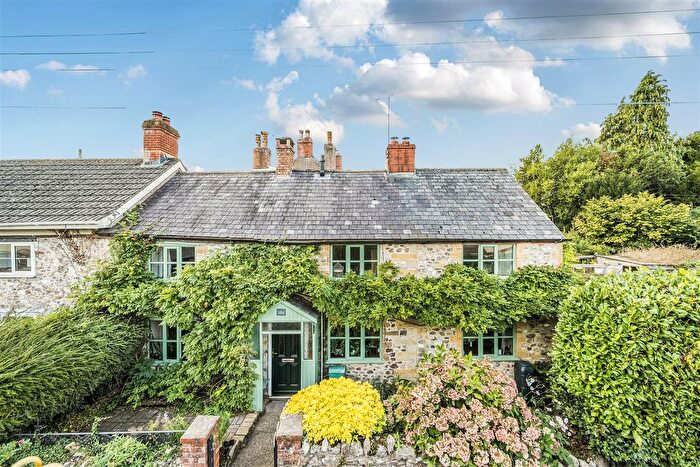
Houses for sale & to rent in Tatworth And Forton, Chard
House Prices in Tatworth And Forton
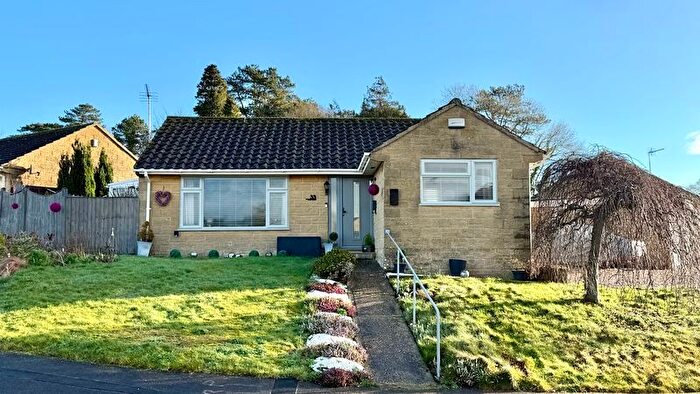
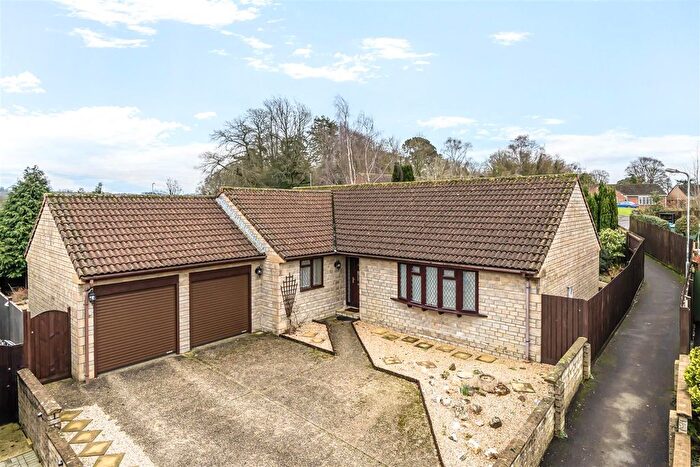
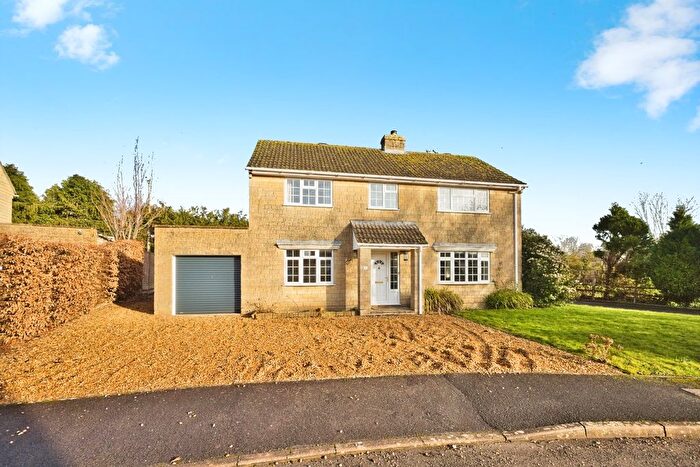
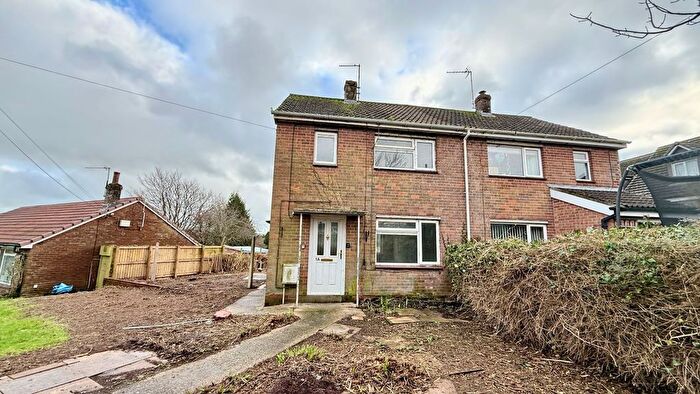
Properties in Tatworth And Forton have an average house price of £338,231.00 and had 114 Property Transactions within the last 3 years¹.
Tatworth And Forton is an area in Chard, Somerset with 1,042 households², where the most expensive property was sold for £895,000.00.
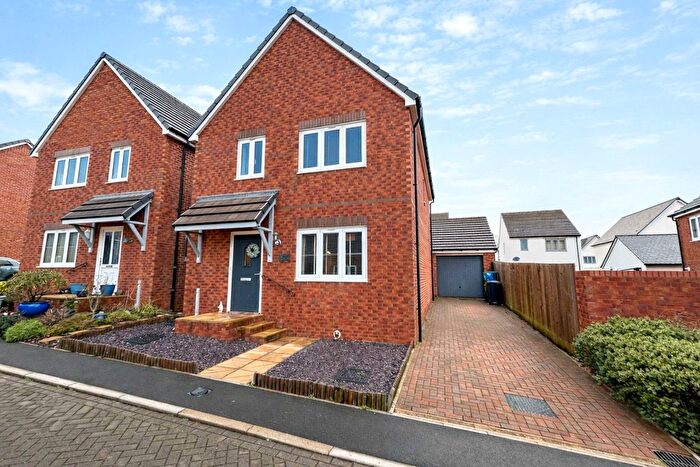
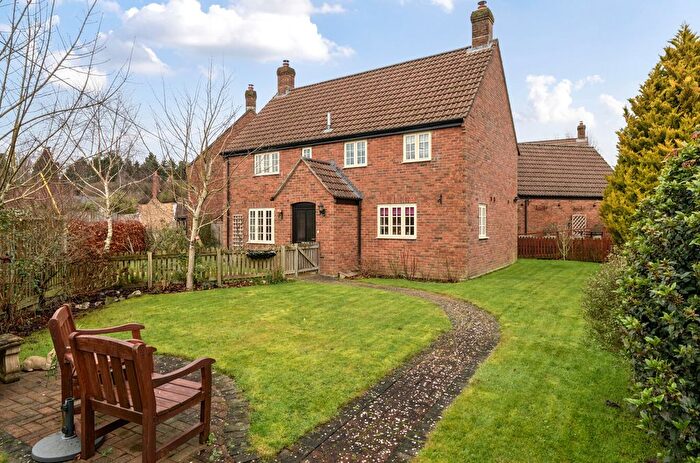
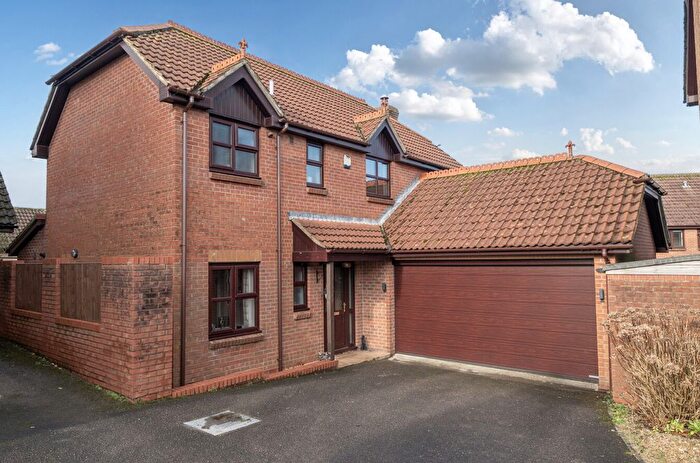
Properties for sale in Tatworth And Forton
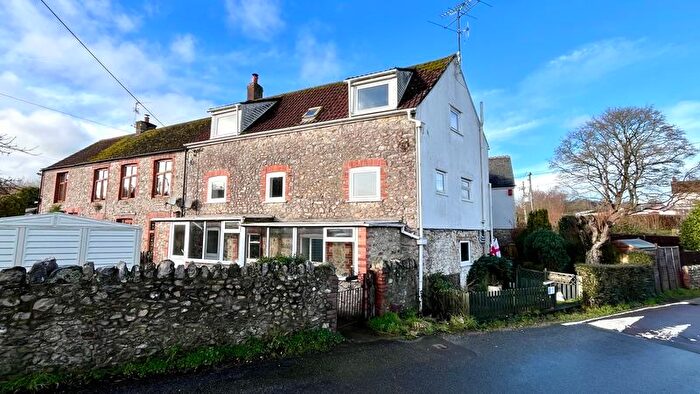
Previously listed properties in Tatworth And Forton
Roads and Postcodes in Tatworth And Forton
Navigate through our locations to find the location of your next house in Tatworth And Forton, Chard for sale or to rent.
| Streets | Postcodes |
|---|---|
| Abbey Close | TA20 2LD |
| Abbey Mews | TA20 2LE |
| Axeford | TA20 4QL |
| Axeford Meadows | TA20 4QQ |
| Beaufitz Place | TA20 2LR |
| Belle View Terrace | TA20 2RZ |
| Blacklands Lane | TA20 2NF |
| Bounds Lane | TA20 2TJ |
| Bulls Lane | TA20 2SL |
| Chard Common | TA20 4HH |
| Chard Junction | TA20 4QJ TA20 4QN TA20 4QP TA20 4QR TA20 4QW |
| Chilson | TA20 2NX |
| Chilson Common | TA20 2NS TA20 2NT |
| Crewkerne Road | TA20 4DL TA20 4DR |
| Crossways | TA20 2PG TA20 2PP TA20 2PW |
| Cuffs Mead | TA20 2NQ |
| Dairs Orchard | TA20 2TA |
| Deane Way | TA20 2TD |
| Drakes Crescent | TA20 2TE |
| Dyke Hill | TA20 2PY |
| Dyke Hill Terrace | TA20 2PZ |
| Factory Lane | TA20 2NR |
| Fore Street | TA20 2SJ TA20 2SW |
| Forton Lane | TA20 2SF |
| Forton Road | TA20 2LS |
| Garden Court | TA20 2QX |
| Glynsmead | TA20 2TQ |
| Greenfield Terrace | TA20 2SD |
| Gulway Mead | TA20 2TB |
| Henderson Drive | TA20 2HW |
| Higher Coombses | TA20 2SY |
| Hillside Villas | TA20 2QE |
| Holleys Close | TA20 2LF |
| Holway | TA20 2SS |
| Horn Lane | TA20 4DP |
| Kents Bungalows | TA20 2QJ |
| Kents Close | TA20 2QU |
| Kents Cottages | TA20 2QH |
| Kents Orchard | TA20 2QB TA20 2QD TA20 2QQ |
| Kents Road | TA20 2QA |
| Kingston Villas | TA20 2SE |
| Knapp | TA20 2SZ |
| Langdons Way | TA20 2TF TA20 2TG TA20 2TH |
| Linkhay Close | TA20 2QT |
| Linkhay Orchard | TA20 2QR TA20 2QS |
| Loveridge Lane | TA20 2SB |
| Manor Farm Close | TA20 2SQ |
| Mill Lane | TA20 2ND |
| Old Orchard | TA20 2LX |
| Orchard Villas | TA20 2QF |
| Perry Street | TA20 2QG |
| Post Office Lane | TA20 2PH TA20 2PJ TA20 2PL TA20 2PN TA20 2PQ TA20 2RR |
| School Lane | TA20 2PR |
| Springfield Terrace | TA20 2PX |
| St Margarets Lane | TA20 2RU |
| Staples Meadow | TA20 2TN |
| Tatworth Street | TA20 2SG |
| The Drift | TA20 4DN TA20 4DW TA20 4HJ |
| Waterlake | TA20 2SP |
| Watermead | TA20 2QL TA20 2QN |
| Wellings Close | TA20 2RY |
| Whitegate | TA20 4HE TA20 4HF TA20 4HG TA20 4HQ |
| Wreath Green | TA20 2SN |
| TA20 2LU TA20 2LY TA20 2LZ TA20 2NA TA20 2NB TA20 2NN TA20 2NY TA20 2NZ TA20 2PD TA20 2PS TA20 2PT TA20 2PU TA20 2RS TA20 2RT TA20 2RX TA20 2SA TA20 2SH TA20 2SR TA20 2SX TA20 2TL TA20 4HB TA20 4HD TA20 4JX TA20 4QH |
Transport near Tatworth And Forton
- FAQ
- Price Paid By Year
- Property Type Price
Frequently asked questions about Tatworth And Forton
What is the average price for a property for sale in Tatworth And Forton?
The average price for a property for sale in Tatworth And Forton is £338,231. This amount is 17% higher than the average price in Chard. There are 391 property listings for sale in Tatworth And Forton.
What streets have the most expensive properties for sale in Tatworth And Forton?
The streets with the most expensive properties for sale in Tatworth And Forton are Forton Lane at an average of £746,640, Loveridge Lane at an average of £685,000 and School Lane at an average of £540,000.
What streets have the most affordable properties for sale in Tatworth And Forton?
The streets with the most affordable properties for sale in Tatworth And Forton are Holway at an average of £110,000, Kents Bungalows at an average of £147,200 and Crossways at an average of £171,000.
Which train stations are available in or near Tatworth And Forton?
Some of the train stations available in or near Tatworth And Forton are Axminster, Crewkerne and Honiton.
Property Price Paid in Tatworth And Forton by Year
The average sold property price by year was:
| Year | Average Sold Price | Price Change |
Sold Properties
|
|---|---|---|---|
| 2025 | £312,452 | -9% |
35 Properties |
| 2024 | £340,992 | -6% |
45 Properties |
| 2023 | £361,113 | 17% |
34 Properties |
| 2022 | £298,576 | 0,4% |
35 Properties |
| 2021 | £297,257 | 8% |
57 Properties |
| 2020 | £273,083 | -4% |
46 Properties |
| 2019 | £282,757 | 9% |
40 Properties |
| 2018 | £257,460 | -1% |
49 Properties |
| 2017 | £260,988 | 9% |
48 Properties |
| 2016 | £238,642 | 2% |
46 Properties |
| 2015 | £234,300 | 4% |
56 Properties |
| 2014 | £225,371 | 4% |
52 Properties |
| 2013 | £216,876 | -0,4% |
42 Properties |
| 2012 | £217,818 | -2% |
33 Properties |
| 2011 | £221,133 | 6% |
28 Properties |
| 2010 | £207,756 | -2% |
36 Properties |
| 2009 | £212,664 | -9% |
24 Properties |
| 2008 | £231,007 | -2% |
33 Properties |
| 2007 | £234,854 | 11% |
56 Properties |
| 2006 | £210,048 | -4% |
51 Properties |
| 2005 | £219,320 | 15% |
45 Properties |
| 2004 | £186,310 | 10% |
48 Properties |
| 2003 | £168,356 | 27% |
55 Properties |
| 2002 | £123,642 | 2% |
54 Properties |
| 2001 | £120,790 | 11% |
69 Properties |
| 2000 | £107,551 | 18% |
38 Properties |
| 1999 | £88,372 | 12% |
74 Properties |
| 1998 | £77,475 | 6% |
62 Properties |
| 1997 | £72,644 | 14% |
61 Properties |
| 1996 | £62,228 | -3% |
46 Properties |
| 1995 | £64,252 | - |
41 Properties |
Property Price per Property Type in Tatworth And Forton
Here you can find historic sold price data in order to help with your property search.
The average Property Paid Price for specific property types in the last three years are:
| Property Type | Average Sold Price | Sold Properties |
|---|---|---|
| Semi Detached House | £251,411.00 | 31 Semi Detached Houses |
| Detached House | £443,568.00 | 55 Detached Houses |
| Terraced House | £231,494.00 | 27 Terraced Houses |
| Flat | £118,000.00 | 1 Flat |

