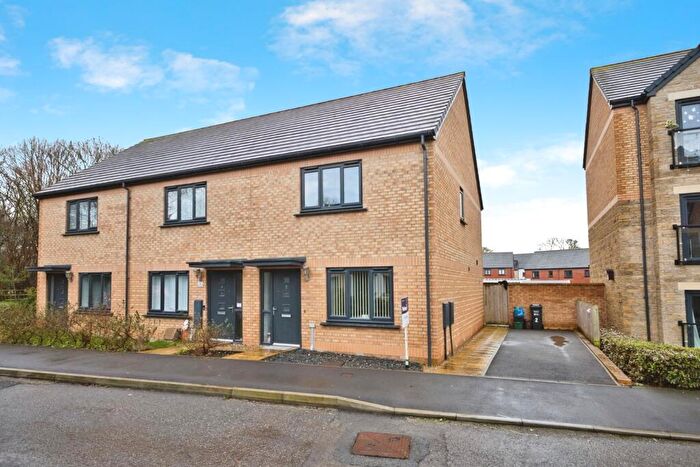
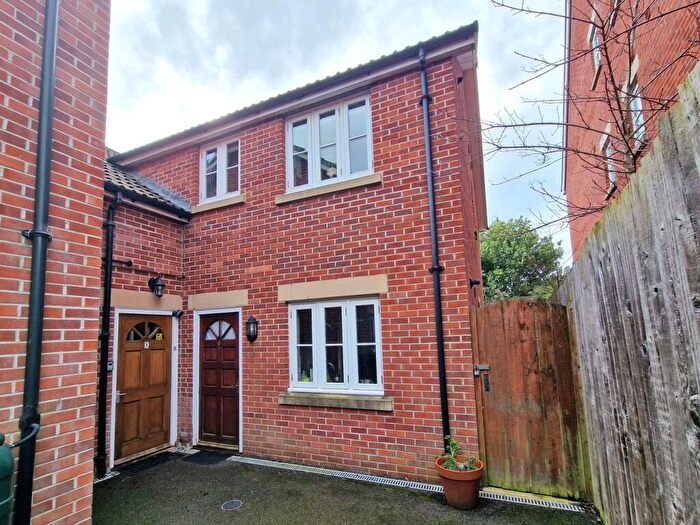
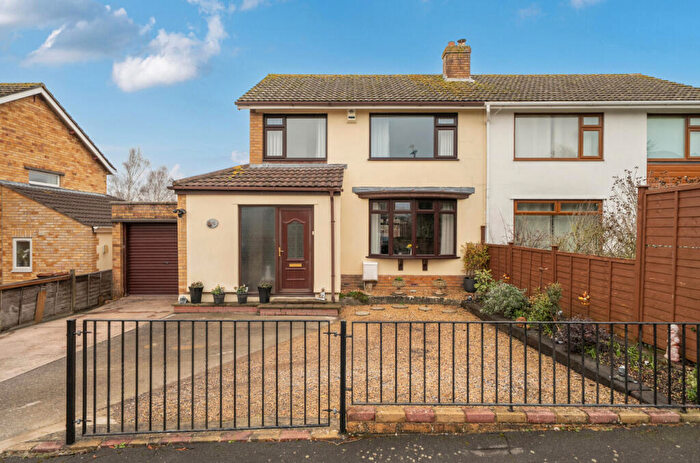
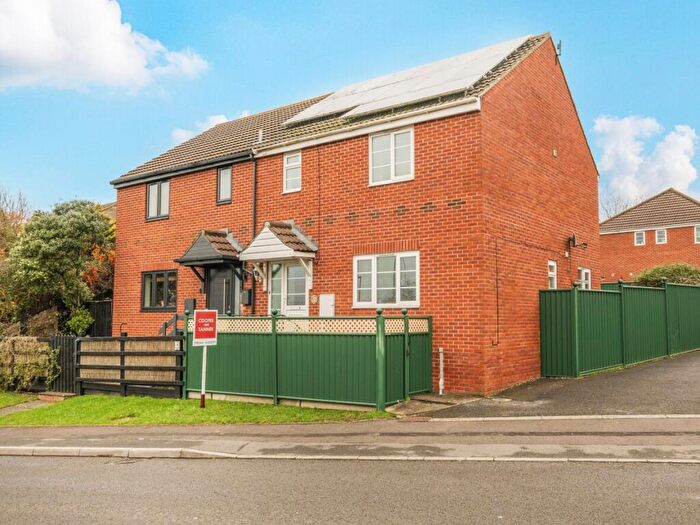
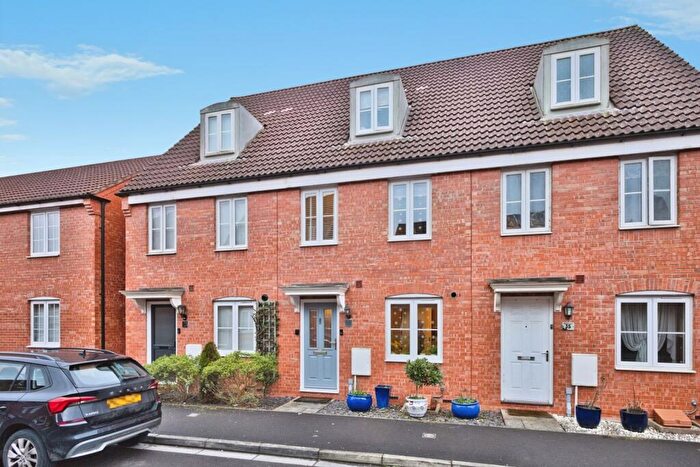
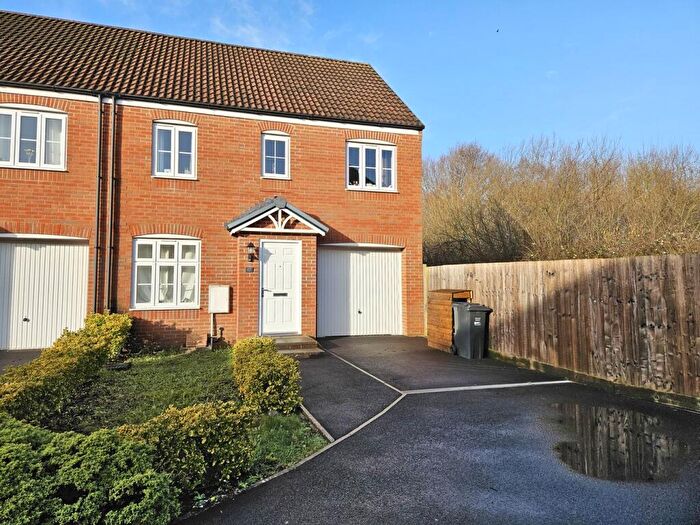
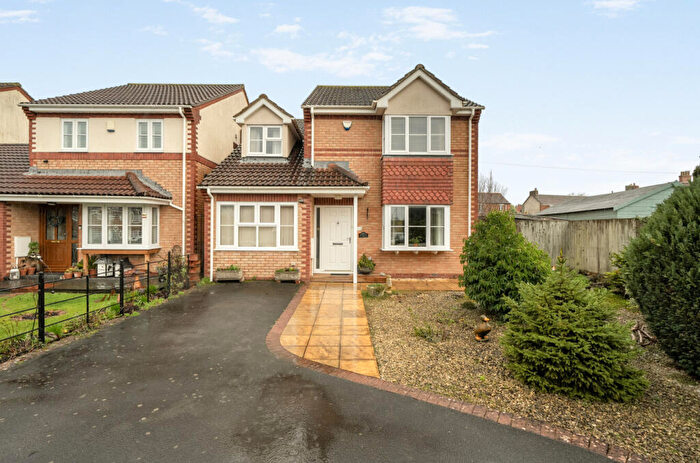
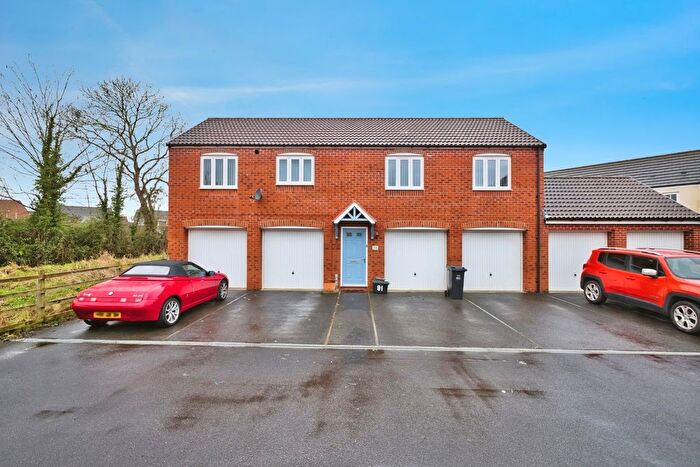
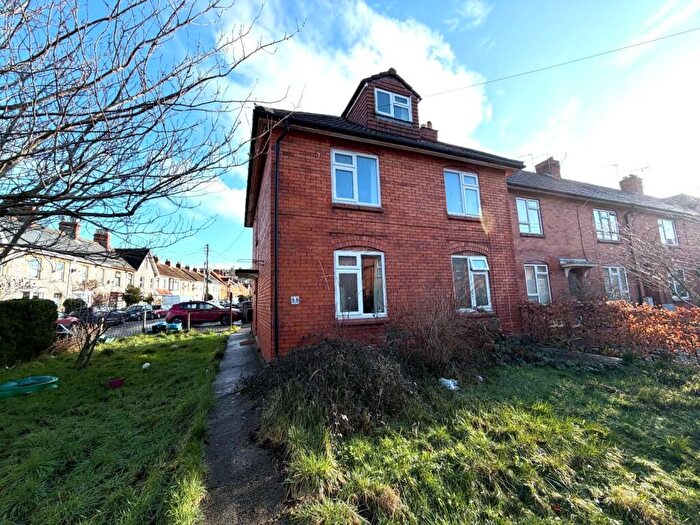
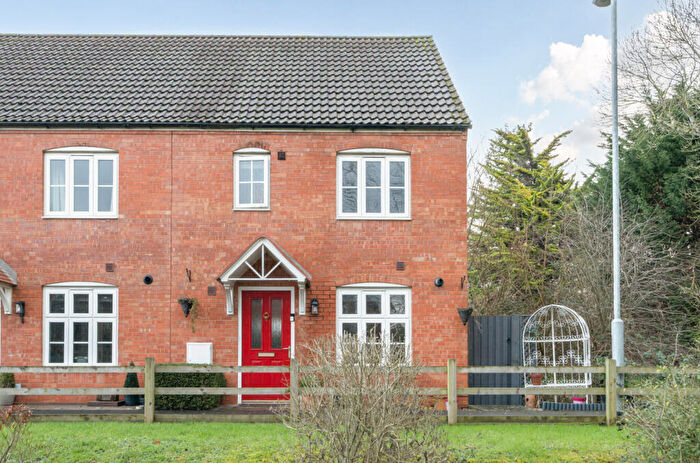
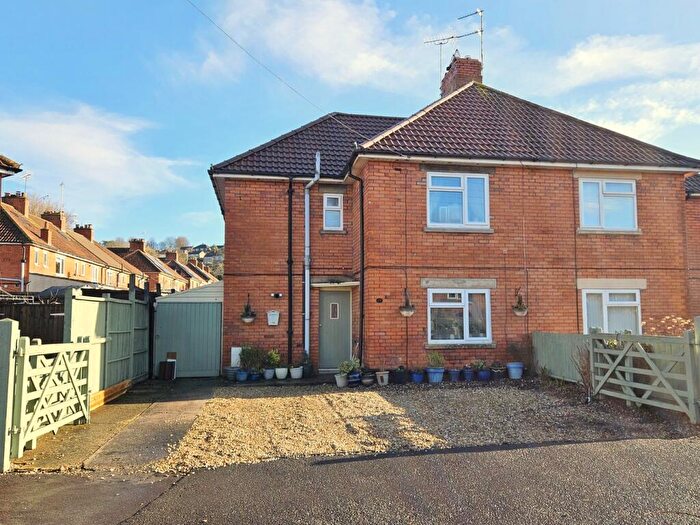
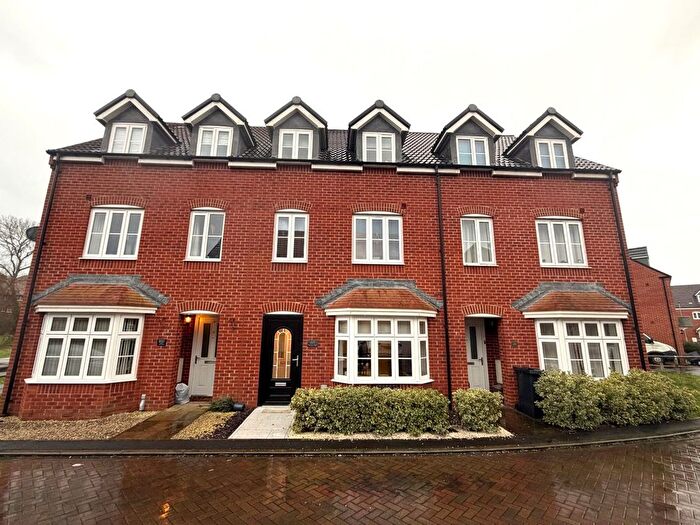
Houses for sale & to rent in Glastonbury St Johns, Glastonbury
House Prices in Glastonbury St Johns
Properties in Glastonbury St Johns have an average house price of £267,654.00 and had 125 Property Transactions within the last 3 years¹.
Glastonbury St Johns is an area in Glastonbury, Somerset with 914 households², where the most expensive property was sold for £700,000.00.
Properties for sale in Glastonbury St Johns
Roads and Postcodes in Glastonbury St Johns
Navigate through our locations to find the location of your next house in Glastonbury St Johns, Glastonbury for sale or to rent.
| Streets | Postcodes |
|---|---|
| Ashcott Close | BA6 9GN |
| Austin Road | BA6 9BA BA6 9BB BA6 9BD |
| Avalon Estate | BA6 9AA |
| Baily Close | BA6 9AU |
| Bartlett Industrial Estate | BA6 9AF |
| Bath Close | BA6 9BJ |
| Bligh Bond Road | BA6 9RB |
| Bowyers Close | BA6 9DA |
| Compton Close | BA6 9GG BA6 9GH |
| Coxley Close | BA6 9GJ |
| Coxs Close | BA6 9AY |
| Edgarley Close | BA6 9GE |
| Ferryman Road | BA6 9BW |
| Godney Close | BA6 9GA |
| Hartlake Close | BA6 9GF |
| Holman Close | BA6 9BN |
| Jack's Close | BA6 9FX |
| Landmead | BA6 9DB BA6 9LD |
| Lowerside Lane | BA6 9GY |
| Lowerside Road | BA6 9BE BA6 9BH |
| Manor Close | BA6 9DL |
| Manor Farm Mews | BA6 9FG |
| Manor House Road | BA6 9DE BA6 9DF BA6 9DG BA6 9DQ |
| Meare Road | BA6 9LA |
| Merrick Road | BA6 9AT |
| Newman Close | BA6 9BL |
| Normans Terrace | BA6 9FL |
| Northload Bridge | BA6 9LF |
| Northload Bridge Cottages | BA6 9LE |
| Pendragon Park | BA6 9PG BA6 9PQ |
| Sharpham Road | BA6 9GB BA6 9GD |
| St Brides Close | BA6 9JU |
| St Dunstans Close | BA6 9AR |
| St Edmunds Road | BA6 9HU BA6 9HX |
| The Archers Way | BA6 9JD |
| Underwood Road | BA6 9BG BA6 9BQ |
| Walton Close | BA6 9GL |
| Watts Corner | BA6 8FD |
| Wells Road | BA6 9AG BA6 9AH BA6 9AJ BA6 9AN BA6 9AQ BA6 9AW BA6 9AZ BA6 9BP BA6 9BR BA6 9BS BA6 9BX BA6 9BY BA6 9BZ BA6 9DJ BA6 9DW BA6 9AS BA6 9BU BA6 9QU |
| Willcox Close | BA6 9AP |
| BA6 9AX BA6 9RA |
Transport near Glastonbury St Johns
- FAQ
- Price Paid By Year
- Property Type Price
Frequently asked questions about Glastonbury St Johns
What is the average price for a property for sale in Glastonbury St Johns?
The average price for a property for sale in Glastonbury St Johns is £267,654. This amount is 20% lower than the average price in Glastonbury. There are 570 property listings for sale in Glastonbury St Johns.
What streets have the most expensive properties for sale in Glastonbury St Johns?
The streets with the most expensive properties for sale in Glastonbury St Johns are Watts Corner at an average of £498,750, Newman Close at an average of £335,000 and Wells Road at an average of £333,230.
What streets have the most affordable properties for sale in Glastonbury St Johns?
The streets with the most affordable properties for sale in Glastonbury St Johns are Manor Close at an average of £121,333, Jack's Close at an average of £171,166 and Landmead at an average of £187,500.
Which train stations are available in or near Glastonbury St Johns?
Some of the train stations available in or near Glastonbury St Johns are Castle Cary, Bruton and Highbridge and Burnham.
Property Price Paid in Glastonbury St Johns by Year
The average sold property price by year was:
| Year | Average Sold Price | Price Change |
Sold Properties
|
|---|---|---|---|
| 2025 | £281,487.5 | 0,3% |
48 Properties |
| 2024 | £280,654.44 | 19% |
45 Properties |
| 2023 | £228,621.88 | -42% |
32 Properties |
| 2022 | £323,844.44 | 20% |
45 Properties |
| 2021 | £260,226.12 | 9% |
67 Properties |
| 2020 | £237,433.75 | -3% |
60 Properties |
| 2019 | £245,152.44 | -2% |
41 Properties |
| 2018 | £250,262.82 | 10% |
39 Properties |
| 2017 | £224,359.46 | -0,5% |
74 Properties |
| 2016 | £225,428.77 | 9% |
65 Properties |
| 2015 | £204,447.63 | 6% |
68 Properties |
| 2014 | £192,217 | 10% |
76 Properties |
| 2013 | £172,959 | -11% |
50 Properties |
| 2012 | £192,542 | -3% |
45 Properties |
| 2011 | £197,799 | 4% |
38 Properties |
| 2010 | £189,413 | 3% |
56 Properties |
| 2009 | £183,776 | -30% |
19 Properties |
| 2008 | £238,351 | -13% |
31 Properties |
| 2007 | £269,710 | 24% |
64 Properties |
| 2006 | £205,793 | 27% |
61 Properties |
| 2005 | £150,264 | 10% |
28 Properties |
| 2004 | £134,922 | -6% |
45 Properties |
| 2003 | £142,704 | 13% |
39 Properties |
| 2002 | £124,409 | 29% |
36 Properties |
| 2001 | £88,381 | 16% |
51 Properties |
| 2000 | £74,040 | 2% |
44 Properties |
| 1999 | £72,854 | 18% |
43 Properties |
| 1998 | £59,604 | 7% |
46 Properties |
| 1997 | £55,655 | 16% |
39 Properties |
| 1996 | £46,819 | -6% |
31 Properties |
| 1995 | £49,504 | - |
35 Properties |
Property Price per Property Type in Glastonbury St Johns
Here you can find historic sold price data in order to help with your property search.
The average Property Paid Price for specific property types in the last three years are:
| Property Type | Average Sold Price | Sold Properties |
|---|---|---|
| Semi Detached House | £266,242.45 | 53 Semi Detached Houses |
| Detached House | £391,428.57 | 21 Detached Houses |
| Terraced House | £238,037.18 | 39 Terraced Houses |
| Flat | £153,537.00 | 12 Flats |

