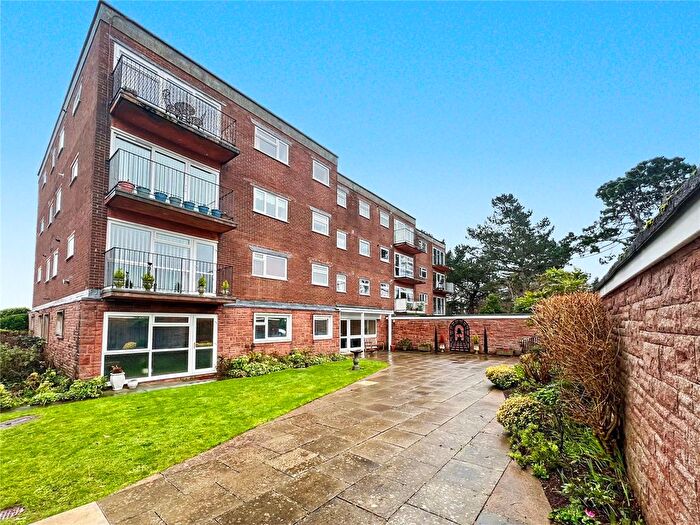
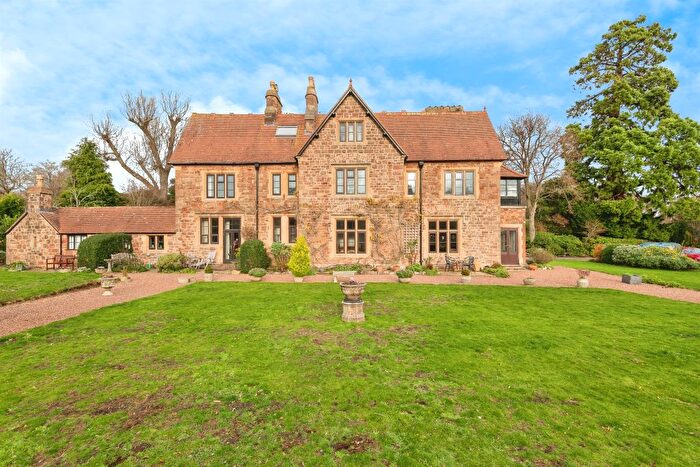
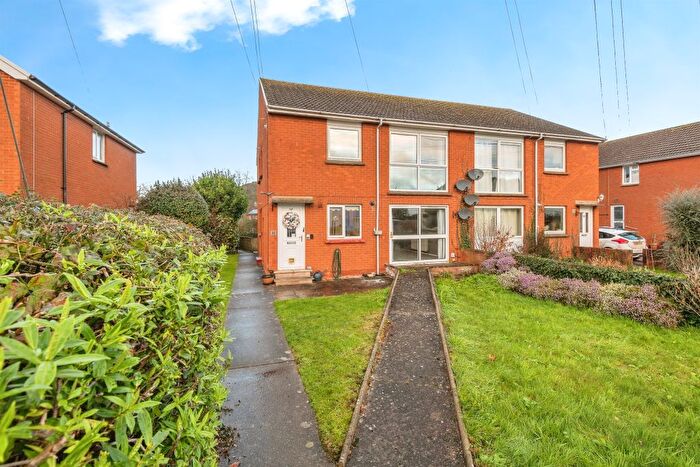
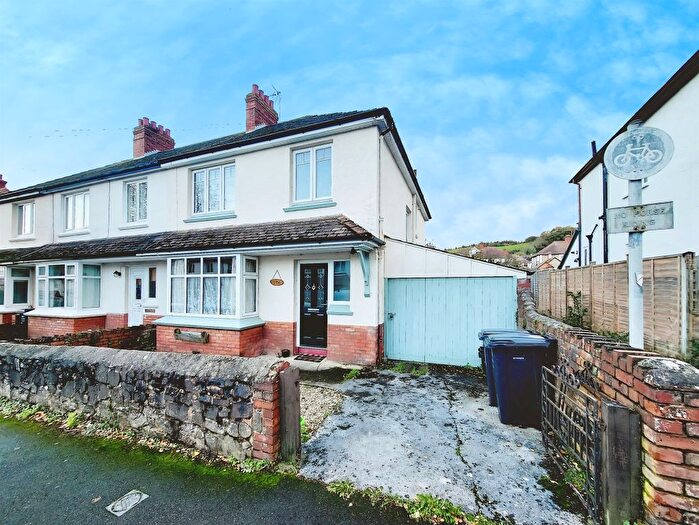
Houses for sale & to rent in Dunster And Timberscombe, Minehead
House Prices in Dunster And Timberscombe
Properties in Dunster And Timberscombe have an average house price of £352,371.00 and had 43 Property Transactions within the last 3 years¹.
Dunster And Timberscombe is an area in Minehead, Somerset with 452 households², where the most expensive property was sold for £825,000.00.
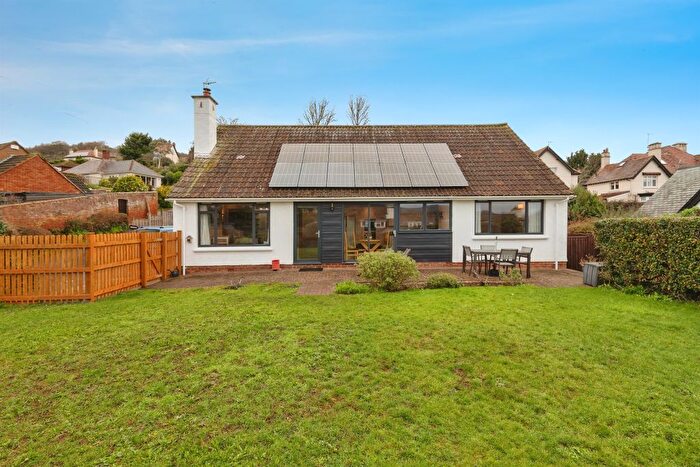
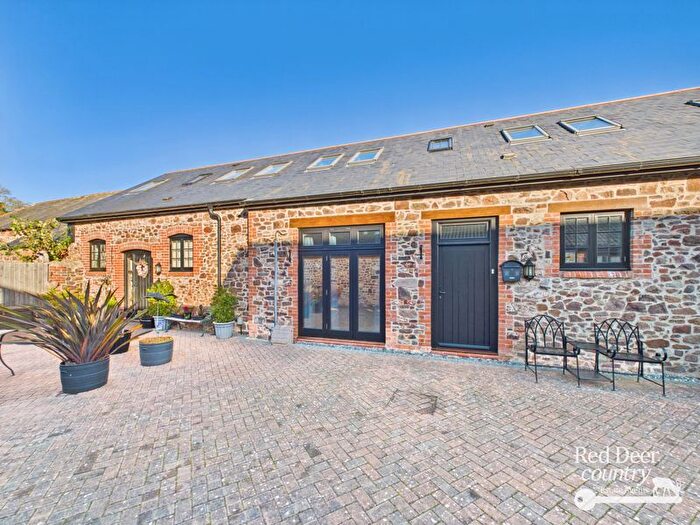
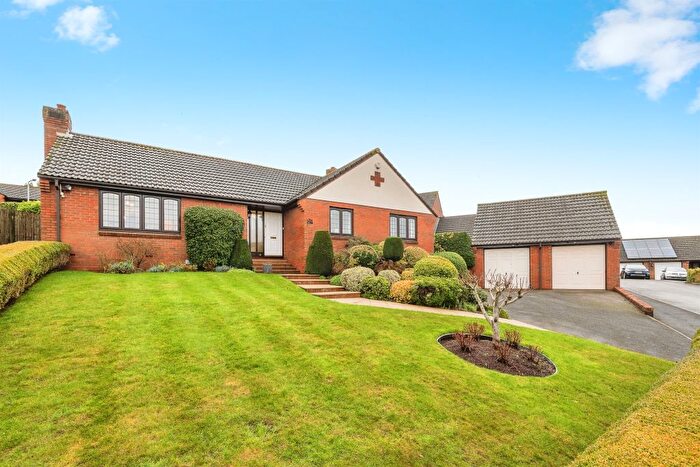
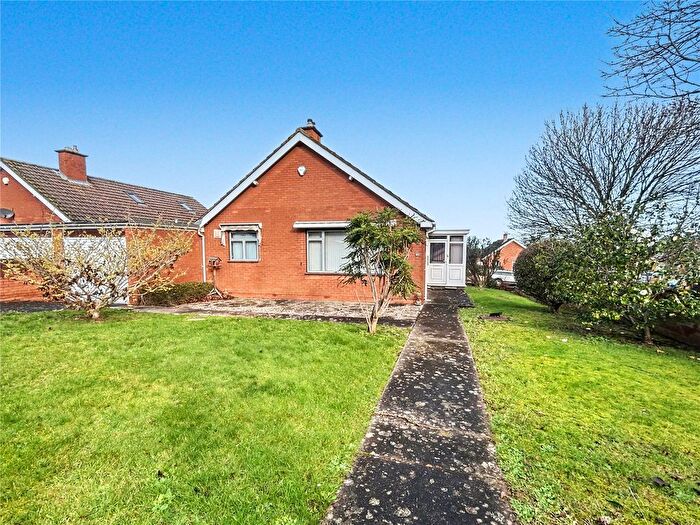
Properties for sale in Dunster And Timberscombe
Previously listed properties in Dunster And Timberscombe
Roads and Postcodes in Dunster And Timberscombe
Navigate through our locations to find the location of your next house in Dunster And Timberscombe, Minehead for sale or to rent.
| Streets | Postcodes |
|---|---|
| Bremis Road | TA24 6PR |
| Bridges Mead | TA24 6RN |
| Brook Street | TA24 7TG |
| Castle Hill | TA24 6SQ |
| Chapel Row | TA24 6RU |
| Church Street | TA24 6SH TA24 7TP |
| Conygar View | TA24 6PP TA24 6PW |
| Cowbridge | TA24 7TD |
| Great House Street | TA24 7TQ |
| Hangers Way | TA24 6RT |
| Haven Close | TA24 6RW |
| High Street | TA24 6SF TA24 6SG |
| Knowle Lane | TA24 6TU TA24 6UA |
| Lower Marsh | TA24 6PJ |
| Main Road | TA24 6PS |
| Marsh Street | TA24 6PD TA24 6PN |
| Meadow View | TA24 7TE |
| Mill Gardens | TA24 6SP |
| Mill Lane | TA24 6SW |
| Park Street | TA24 6SR |
| Pikes Crescent | TA24 6SY |
| Priory Green | TA24 6RY |
| St Georges Close | TA24 6SS |
| St Georges Street | TA24 6RS TA24 6RX TA24 6RZ TA24 6SB |
| St Thomas Street | TA24 6AS |
| The Glebe | TA24 7TS |
| West Close | TA24 6SA |
| West Street | TA24 6SN |
| Wheddon Cross | TA24 7BL |
| Willow View | TA24 7TH |
| Willowbank | TA24 7TW |
| TA24 6SD TA24 6TR TA24 6TS TA24 6TX TA24 6TY TA24 7TF TA24 7TR TA24 7TT TA24 7TU TA24 7TY TA24 7UN |
Transport near Dunster And Timberscombe
-
Rhoose (Cardiff Int Airpt) Station
-
Llantwit Major Station
-
Barry Island Station
-
Barry Station
-
Barry Docks Station
-
Cadoxton Station
-
Tiverton Parkway Station
-
Taunton Station
- FAQ
- Price Paid By Year
- Property Type Price
Frequently asked questions about Dunster And Timberscombe
What is the average price for a property for sale in Dunster And Timberscombe?
The average price for a property for sale in Dunster And Timberscombe is £352,371. This amount is 15% higher than the average price in Minehead. There are 816 property listings for sale in Dunster And Timberscombe.
What streets have the most expensive properties for sale in Dunster And Timberscombe?
The streets with the most expensive properties for sale in Dunster And Timberscombe are Hangers Way at an average of £685,000, Park Street at an average of £387,500 and West Street at an average of £367,500.
What streets have the most affordable properties for sale in Dunster And Timberscombe?
The streets with the most affordable properties for sale in Dunster And Timberscombe are St Georges Close at an average of £203,500, Brook Street at an average of £240,493 and St Georges Street at an average of £242,333.
Which train stations are available in or near Dunster And Timberscombe?
Some of the train stations available in or near Dunster And Timberscombe are Rhoose (Cardiff Int Airpt), Llantwit Major and Barry Island.
Property Price Paid in Dunster And Timberscombe by Year
The average sold property price by year was:
| Year | Average Sold Price | Price Change |
Sold Properties
|
|---|---|---|---|
| 2025 | £403,650 | 9% |
10 Properties |
| 2024 | £366,105 | 14% |
14 Properties |
| 2023 | £315,263 | -10% |
19 Properties |
| 2022 | £345,565 | 15% |
23 Properties |
| 2021 | £293,961 | -28% |
26 Properties |
| 2020 | £377,428 | 38% |
14 Properties |
| 2019 | £234,184 | -35% |
19 Properties |
| 2018 | £315,134 | 24% |
21 Properties |
| 2017 | £240,019 | -8% |
25 Properties |
| 2016 | £260,283 | 13% |
24 Properties |
| 2015 | £227,695 | -12% |
22 Properties |
| 2014 | £254,431 | 2% |
22 Properties |
| 2013 | £249,296 | 22% |
15 Properties |
| 2012 | £194,125 | -28% |
12 Properties |
| 2011 | £247,679 | -15% |
26 Properties |
| 2010 | £283,840 | -10% |
22 Properties |
| 2009 | £313,264 | 16% |
17 Properties |
| 2008 | £262,738 | -11% |
13 Properties |
| 2007 | £291,767 | 18% |
28 Properties |
| 2006 | £239,636 | 10% |
34 Properties |
| 2005 | £215,194 | 11% |
27 Properties |
| 2004 | £190,653 | -4% |
27 Properties |
| 2003 | £198,972 | 28% |
24 Properties |
| 2002 | £142,972 | -18% |
34 Properties |
| 2001 | £168,532 | 20% |
29 Properties |
| 2000 | £135,189 | 35% |
30 Properties |
| 1999 | £88,089 | -5% |
29 Properties |
| 1998 | £92,586 | 13% |
23 Properties |
| 1997 | £80,387 | -0,4% |
28 Properties |
| 1996 | £80,748 | -15% |
25 Properties |
| 1995 | £92,805 | - |
18 Properties |
Property Price per Property Type in Dunster And Timberscombe
Here you can find historic sold price data in order to help with your property search.
The average Property Paid Price for specific property types in the last three years are:
| Property Type | Average Sold Price | Sold Properties |
|---|---|---|
| Semi Detached House | £358,400.00 | 10 Semi Detached Houses |
| Detached House | £429,410.00 | 17 Detached Houses |
| Terraced House | £275,750.00 | 12 Terraced Houses |
| Flat | £239,750.00 | 4 Flats |

